Transcription
On Dominant Characteristics ofResidential Broadband Internet TrafficGregor MaierTU-Berlin/T-LabsAnja FeldmannTU-Berlin/T-LabsABSTRACTWhile residential broadband Internet access is popular in manyparts of the world, only a few studies have examined the characteristics of such traffic. In this paper we describe observations frommonitoring the network activity for more than 20,000 residentialDSL customers in an urban area. To ensure privacy, all data is immediately anonymized. We augment the anonymized packet traceswith information about DSL-level sessions, IP (re-)assignments,and DSL link bandwidth.Our analysis reveals a number of surprises in terms of the mentalmodels we developed from the measurement literature. For example, we find that HTTP—not peer-to-peer—traffic dominates by asignificant margin; that more often than not the home user’s immediate ISP connectivity contributes more to the round-trip times theuser experiences than the WAN portion of the path; and that theDSL lines are frequently not the bottleneck in bulk-transfer performance.Categories and Subject DescriptorsC.2.2 [Computer-Communication Networks]:NetworkProtocols—Applications;C.2.3 [Computer-CommunicationNetworks]: Network Operations—Network monitoringGeneral TermsMeasurement, PerformanceKeywordsNetwork Measurement, Application Mix, HTTP usage, TCP performance, Residential Broadband Traffic, DSL1.INTRODUCTIONResidential broadband Internet connectivity is a mature servicein many countries. This foundation of rich access allows users totightly integrate network use into their lives—from checking theweather or sports scores to shopping and banking to communicat-Permission to make digital or hard copies of all or part of this work forpersonal or classroom use is granted without fee provided that copies arenot made or distributed for profit or commercial advantage and that copiesbear this notice and the full citation on the first page. To copy otherwise, torepublish, to post on servers or to redistribute to lists, requires prior specificpermission and/or a fee.IMC’09, November 4–6, 2009, Chicago, Illinois, USA.Copyright 2009 ACM 978-1-60558-770-7/09/11 . 10.00.Vern PaxsonUC Berkeley/ICSIMark AllmanICSIing with family and friends in myriad ways. However, the nature ofthe connectivity differs from previously studied environments suchas campus networks and enterprises in salient ways.First, users of residential broadband connections will often havedifferent goals than those in other environments, and are not subject to the same sorts of strict acceptable use policies that may regulate their access at work or at school, such as prohibitions againstaccessing certain Web sites or employing certain applications. Inaddition, we expect that the users who set up hosts and ancillaryequipment in residences often have no expertise in system administration, nor much desire to understand any more than is necessaryto “make it work”. Finally, unlike for campuses (and to a lesserextent, enterprises), researchers rarely have large-scale access toresidential traffic, and thus its makeup, dynamics, and variationsremain underexamined.In this work we present observations developed from passivepacket-level monitoring of more than 20,000 residential DSL linesfrom a major European ISP. This unique vantage point provides abroad view of residential traffic, enabling more comprehensive anddetailed characterizations than was possible in previous work, suchas Cho et al.’s studies based on backbone traces [19, 9, 10], otherwork that examined specific applications like P2P-assisted contentdistribution [27] and Skype [7], or studies using active measurements [12].In this initial exploration we focus on studying a broad rangeof dominant characteristics of residential traffic across a numberof dimensions, including DSL session characteristics, network andtransport-level features, prominent applications, and network pathdynamics. Our study discovered a number of results we found surprising in terms of the standard “mental models” one develops fromthe Internet measurement literature and by talking with operatorsand colleagues. For example: HTTP traffic, not peer-to-peer, dominates. Overall, HTTPmakes up nearly 60% of traffic by bytes while peer-to-peercontributes roughly 14%. Even if we assume that all unclassified traffic is peer-to-peer, this latter figure only risesto one-quarter, confirming contemporaneous observations byErman et al. [15] for a major US broadband provider. DSL sessions run quite short in duration, with a medianlength of only 20–30 min. The short lifetime affects the rateof IP address reassignments, and we find 50% of addressesare assigned at least twice in 24 h, and 1–5% of addressesmore than 10 times, with significant implications for IP address aliasing.
Sep 08APRApr 0924 hSizeLoss100–600 noneGB ea. 4 TBseveral multi-secondperiods with nopackets 4 TBsee aboveTable 1: Summary of anonymized packet traces Delays experienced from a residence to the ISP’s Internetgateway often exceed those over the wide-area path from thegateway to the remote peer. We find a median local component of 46 ms (due to DSL interleaving), versus a medianremote component of 17 ms. Users rarely employ the full capacity of their lines, confirming observations by Siekkinen et al. [47]. 802.11 wirelessnetworking in customers’ homes, and TCP settings on theresidential systems, appear to limit the achievable throughput.NameTENEVERY42.DATA AND TERMINOLOGYWe base our study on passive, anonymized packet-level observations of residential DSL connections collected at aggregation points within a large European ISP. Overall, the ISP hasroughly 10 million (4%) of the 251 million worldwide broadband subscribers [38]. They predominantly use DSL. The monitor operated at the broadband access router connecting customersto the ISP’s backbone. The access bandwidth of the monitoredlines varies between 1,200/200 Kbps (downstream/upstream) and17,000/1,200 Kbps, with the exact rate depending on both the customer’s contract and their distance from the DSLAM (the ISP’sline-card). In the portion of the network we monitored most usershad distances low enough to in principle support 17 Mbps.For clarity of exposition, we define the following terms. A linedenotes a physical DSL line as identified by a line-card identifier.We define a DSL-level session as the period when the DSL modem and the line-card are together in operation. We refer to thenetwork between the monitoring point and the customer as the local side, as opposed to the remote side (remainder of the Internet).Similarly, the customer sends upstream traffic and receives downstream traffic. A flow refers to unidirectional data transmissionat the usual 5-tuple granularity (IP addresses, transport protocol,transport ports). A connection is a bi-directional transport-levelcommunication channel, demarked for TCP by the usual controlpackets (SYN, FIN/RST) and for UDP by the the arrival of the firstpacket and the absence of activity detected using an idle timeoutof 20 s. Finally, the originator endpoint actively initiated the connection, as opposed to the responder, which passively awaited theconnection request.Our monitoring vantage point allowed us to observe more than20,000 DSL lines from one urban area, connected to one accessDuration10 days6x 24 hLossnonenoneTable 2: Summary of additional anonymized DSL session informationall sessionsmedian duration per DSL line0We organize the paper as follows. After giving a short overviewof our datasets and terminology in Section 2, we look at DSL session characteristics in Section 3. In Section 4 we explore which applications are popular among the user population, and take a closerlook at the most predominant, HTTP, in Section 5. We briefly examine transport protocol features in Section 6, and examine pathcharacteristics in Section 7. We summarize in Section 8.TimeFeb 2009Jan–Feb 20090.4SEPDuration14x90 min24 hprobability density0.20.3TimeAug 080.1WEEK0.0Name51015session duration [h]2025Figure 1: PDF of session durations for sessions with durationlonger than 5 minutes for dataset TEN.router, for which we employed Endace DAG network monitoringcards [14] for traffic capture. Immediately after capture we extractapplication classifications (using DPD [13]; see Section 4.1) andinformation such as HTTP headers from the traces using Bro [41],storing anonymized versions of the packet and application headers for later processing. Table 1 provides an overview of the datatraces, including when gathered and overall size. WEEK reflects14 intervals of 90 minutes each, gathered twice per day during thesame hours over the course of one week. In addition, we gathered anonymized DSL session information, including the sessionstart and end times, anonymized IP address, anonymized line-cardidentifier, and the configured access-bandwidth. Along with DSLsession traces for each of our packet measurements, we obtained a10-day DSL session-only trace from Jan 2009 (TEN), as well as sixseparate 24h session-only traces (see Table 2).To simplify the presentation, we focus our discussion on SEPand TEN. However, we verified our results across all traces andexplicitly point out differences. In particular, we use the 14 samplesfrom WEEK to verify that there are no dominant day-of-week orother biases apparent in the 24 h traces (SEP, APR). In addition,we cross-checked our results with sampled NetFlow data exportedby 10 of the ISP’s routers. This further increases our confidence inthe representativeness of our application mix results.3. DSL SESSION CHARACTERISTICSWe begin our study with a look at the behavior of the users’ DSLsessions (periods of connection to the ISP’s network). A first basic question concerns the durations of such connections. Networkanalysis studies often make the assumption that one can use IP addresses as host identifiers (for example, for studies that count thenumber of systems exhibiting a particular phenomenon), and previous studies have found stability in these mappings on the orderof several hours to days. Moore et al. analyzed the 2001 Code
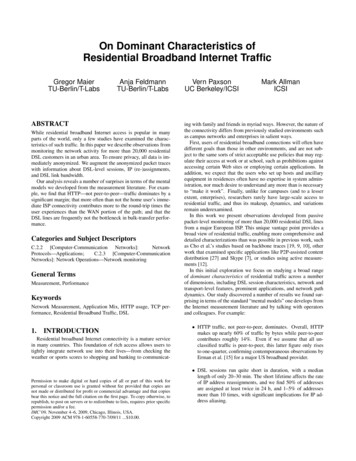
downstreamupstreamPortError 7.7%Other 1.9%IdleTimeout 1.7%UserRequest81.5%relative volumeSessionTimeout 7.2%4hFigure 2: DSL (Radius) session termination causes distributionfor sessions lasting longer than 5 minutes.8h12h16htime20h0h40fraction of online DSL lines [%]4244464850Figure 4: Bandwidth usage of all DSL lines across time (1 minbins).4h8h12h16htime20h0h4hFigure 3: Relative number of concurrent DSL lines across timefor one 24h weekday period of dataset TEN. Note the base-line.Red outbreak and found that for larger timescales (days to weeks),IP addresses cannot be used as reliable host identifiers due to IPreassignment [35]; they did not examine timescales below severalhours. Xie et al. observed some highly volatile dynamic IP addressranges, which they attributed mainly to dial-up hosts [54].Thus, we expected to find typical session lengths of severalhours. However, we find instead that many are quite short. Webase our analysis on Radius [43] logs, which many European ISPsuse for authentication and IP address leasing. Radius supports twotimeouts, SessionTimeout and IdleTimeout, though the monitoredISP only makes use of the first. SessionTimeout performs a rolesimilar to the DHCP lease time, limiting the maximum lifetime ofa session. The ISP sets it to 24 hr (a popular choice among European ISPs [52, 37]). DSL home routers generally offer an option toreconnect immediately after a session expires. However, in contrastto DHCP, Radius does not provide an option to request a particularIP address (e.g., the previously used IP address), and the ISP allowsaddresses to change across sessions.We analyzed the DSL session duration of the Radius logs, excluding sessions lasting under 5 minutes. Surprisingly, we find thatsessions are quite short, with a median duration of only 20–30 minutes. Figure 1 shows the distribution of DSL session durations forthose longer than 5 minutes, computed over all sessions, along withthe distribution of the median session duration computed per DSLline. The data exhibits two strong modes around 20–30 minutesand 24 hr (the maximum duration given the Radius setup), partitioning the DSL lines in two large groups: always-connected lines,and lines that only connect on demand and disconnect shortly after. We do not find much in between (lines connected for severalhours). While previous work found short sessions (70% lasting atmost 1 hour) in the context of wireless university networks [30], wefound it striking to discover such short DSL sessions in residentialnetworks, in violation of our mental model that sessions would besignificantly longer-lived.To check if there is a significant difference in DSL session durations for P2P users vs. non-P2P users (see Section 4), we partitioned the DSL-lines into two groups. Overall, the characteristicsof the distribution are similar, with two prevalent modes. However,we find that P2P users tend to have longer session durations andthat a larger fraction of P2P users always remain connected.To better understand the high prevalence of short sessions, weexamined the Radius termination status in the logs. Radius differentiates between 18 termination causes. Figure 2 shows the distribution of causes for sessions longer than 5 minutes. We observethat more than 80% of sessions are terminated by user request (thisrises to 95% for sessions under 5 minutes). Most likely these arecaused by idle timeouts in the DSL modem on the client side.While most current broadband contracts are flat-rate, in the pasttime-based contracts were popular in Europe. Indeed, these latterare still offered by most European ISPs. Therefore, it is likely thatconsumer DSL routers come with a small idle timeout as a factory default in an effort to aid users in keeping down costs, and weverified this for several popular home routers. The second mostcommon termination cause is PortError, which likely results whenusers power off their DSL modem as part of powering down theirentire computing setup.Since many DSL sessions are short and Radius does not preserveIP address assignments across sessions, we therefore expect (andfind) IP addresses used for multiple DSL lines across each dataset.During a 24 hr period we find 50% of the IP addresses assigned toat least 2 distinct DSL lines, and 1–5% to more than 10 DSL lines.These results underscore the peril involved in using an IP addressas a long-term reliable host identifier.
Previous work found that for consumers diurnal patterns startwith activity in the morning, steadily increasing throughout thecourse of the day, with the height of activity starting in the earlyevening and lasting till midnight [19, 17]. We see this same overallpattern in terms of the number of active DSL sessions, as shownin Figure 3. However, we note that the variation is in fact modest,with 40% of the lines permanently connected. We also observe aslight day-of-week effect, with Sundays having larger numbers ofconcurrent sessions, and Friday/Saturday having lower daily maxima than other weekdays.We also observe a diurnal pattern in bandwidth usage, per Figure 4, with the relative differences now being much more pronounced. After all, keeping a session alive does not imply anybandwidth usage per se.Our data also offers us an opportunity to analyze the potentialresource requirements of an ISP wide NAT deployment. In particular, we study how many public IP addresses are needed to supportthe traffic on the monitored lines. For this purpose we count thenumber of concurrently active TCP/UDP connections and add a 5min or 10-min timeout to the duration of each 5-tuple. Doing soimplies that we do not allow the immediate reuse of each 5-tuple.Under the assumption that a single public IP address can support65,536 concurrent connections (due to available port space) we findthat a single public IP address suffices to support 1,300–2,000 active lines with a 10-min timeout, and roughly twice that when usinga 5-min timeout.Given the maximum number of concurrently connected lines, 5–10 public addresses would in principle suffice to accommodate themonitored DSL-lines—a huge reduction of the required public IPaddress space.So far we only considered outgoing connections, yet a NAT mustalso accommodate incoming connections. We find that very fewlines utilize incoming connections for traditional services such asHTTP. Most successful incoming connections are to ports commonly used for VoIP (SIP and RTP), default P2P ports, IPSec keymanagement, and traceroute destination ports. It is plausible thatP2P applications can use Universal Plug-and-Play to dynamicallynegotiate ports with the NAT devices. SIP and RTP include NATtraversal solutions and proxy services. In addition, we find that almost all SIP connections are to/from the ISP’s SIP server, since SIPis used as a transparent VoIP replacement for end-customers. Moreover, one does not have to support traceroute. As such it appearsthat one would not need too many additional public IP addressesfor incoming connections.While we acknowledge that more in-depth study is needed, itappears that such NAT deployment would indeed conserve a verylarge number of public IP addresses. Whether it proves manageable, and/or impedes innovation, remains a separate question.4.APPLICATION USAGETo understand the popular applications among our user population, we examine our application classifications (made at datacollection time) and anonymized application-layer header traces.We in addition assess how well purely port-based classificationwould perform for correctly identifying residential traffic patterns,and characterize traffic asymmetries.Previous studies of Internet application mix found HTTP to predominate around the turn of the century. Fraleigh et al. [18] analyzed packet level traces recorded from the Sprint backbone in2001, finding that in most traces HTTP contributed 40% of allbytes, though several traces had P2P contributing 80%.Subsequent studies found that P2P became the dominant application. Ipoque and Cachelogic both used data from their deployedunlcassified10.6%otherDPD 10%BitTorrent 8.5%eDonkey 5%NNTP 4.8%well known 3.6%HTTP57.6%Figure 5: Application Mix for trace SEP.deep packet inspection and traffic management systems at selectedcustomers sites to assess the application usage [45, 46, 40]. Cachelogic claimed that by 2006 P2P accounted for more than 70% ofthe traffic, with Ipoque supporting this claim for 2007. For 2008Ipoque found that P2P in Europe accounted for more than 50% oftraffic (with Web contributing another 25%).On the other hand, Hyun-chul et al. reported that payload-basedanalysis conducted in 2004 from within the PAIX backbone foundalmost no P2P traffic, but more than 45% HTTP [23]. On the otherhand, the same study developed how at various university networksthe traffic differs; for example, at KAIST in 2006 they found under 10% HTTP, and 40–50% P2P.Cho et al. [9, 10] also found in 2008 that TCP port 80 contributedonly 14% of all bytes in Japanese ISP backbones (9% in 2005),with the bulk of traffic being on unassigned ports. None of thedefault P2P ports contributed more 1% of the traffic volume. (Theauthors point out that WINNY, the most prelevant P2P applicationin Japan, uses unassigned ports.) They found that residential trafficexhibited a shift to more streaming and video content, which agreeswith recent blog and news reports that claim that P2P traffic hassomewhat declined, with streaming media increasing [50, 3]. Withan assumption that the unassigned ports indeed reflected P2P, theirdatasets indicated that P2P dominated the total traffic volume.From a somewhat different perspective, Kotz and Essien [29,30] reported that 50% of wireless traffic in 2001 on a universitycampus, which included residential buildings, used HTTP’s wellknown ports, with 40% of this traffic incoming to local servers.Henderson et al. [22] compared these results with newer tracesfrom 2003/2004 of the same network, finding major shifts in theapplication mix (HTTP 63% 27%, File systems 5% 19%, P2P5% 22%), and that more traffic stayed on-campus than in 2001(70%, up from 34%). Of the P2P traffic, 73% remained internal.Therefore, we cannot easily compare these results to residentialbroadband use. Finally, Fraleigh et al. [18] also used a port-basedapproach on 2001 data, finding that on some links 60% of the bytescome from P2P and only 30% from HTTP, although most of theirtraces have more than 40% HTTP.Given this context, we now turn to an analysis of applicationusage in our 2008/2009 residential traces.4.1 Application usage analysisTo robustly identify application protocols, we employ the Brosystem’s Dynamic Protocol Detection (DPD) [13]. DPD essentially tries to parse each byte stream with parsers for numerousprotocols, deferring determination of the corresponding application until only that application’s parser recognizes the traffic. DPD
1 We do not consider video delivery via HTTP as streaming. Werefer to those as progressive HTTP downloads.10080percent4060200also uses regular expression signatures to winnow down the initialset of candidate parsers. The Bro distribution includes full DPDparsers/recognizers for BitTorrent, FTP, HTTP, IRC, POP3, SMTP,SSH, and SSL. We extended the set of detectors with partial recognizers for eDonkey and Gnutella (both based on L7-filter signatures [32]), NNTP, RTP, RTSP, SHOUTcast, SOCKS, and Skype.In the SEP trace we can classify more than 85% of all bytes,with another 3.6% using well-known ports, as reflected in Figure 5.We find that HTTP, not P2P, is the most significant protocol, accounting for 57% of residential bytes. We also find that NNTPcontributes a significant amount of volume, nearly 5%. Almost allof the NNTP bytes arise due to transfers of binary files, with RARarchives (application/rar) being among the most common file types,suggesting that the traffic reflects the equivalent of file-sharing.We find that P2P applications—BitTorrent, Gnutella, andeDonkey—contribute 14% of all bytes, with BitTorrent the mostprevalent, and Gnutella almost non-existent. However, the L7-filtersignatures for eDonkey may be incomplete. We observe a significant amount of traffic (1.2%) on well-known eDonkey ports thatthe classifier fails to detect as eDonkey. The distribution of connection sizes for this traffic closely matches that for traffic positivelyidentified as eDonkey (and differs from other applications). If wepresume that this indeed reflects eDonkey traffic, then the overallshare of P2P traffic increases to 17–19%, with eDonkey’s popularity roughly the same as BitTorrent’s. But even if we assume that allunclassified traffic is P2P, the total P2P share still runs below 25%.P2P applications could also in principle use HTTP for datadownload, thus “hiding” among the bulk of HTTP traffic and increasing the significance of P2P traffic volume. However, our indepth analysis of HTTP traffic (Section 5) finds that this is not thecase.Streaming protocols1 (RTSP, RTMP, SHOUTcast) account for5% of the traffic in terms of bytes. We identify RTSP and SHOUTcast using partial DPD parsers, while we identify RTMP’s basedonly on its well-known port. We also find noticeable Voice-over-IPtraffic (Skype [7], RTP), about 1.3% of the total bytes.In order to increase our confidence in the representativeness ofour application mix results, we analyzed sampled NetFlow data exported by 10 of the ISP’s routers. This data shows that 50% ofthe traffic comes from TCP port 80. We further compared our results with those from a commercial deep-packet-inspection systemdeployed at a different network location, finding a close match.Our analysis of the other traces confirms the findings outlinedabove. In particular the other traces confirm that our results are notbiased by the day-of-week we choose. However, while the HTTPtraffic share in the APR trace is about the same, we find slightlymore unclassified traffic. We note that the overall P2P traffic decreases somewhat, and shifts from eDonkey to BitTorrent (now9.3%). Also the fraction of NNTP traffic decreases. On this dayit only accounted for 2.2% of the traffic. Our hypothesis is that especially the latter observations reflect day-to-day variations ratherthan indications of trends, but we will require longer-time measurements to determine this definitively.We might expect that application usage differs widely betweenusers with different access speeds. Figure 6 shows the applicationmix seen for different downstream bandwidth rates. Although themix does vary, the changes are modest, other than for more P2Ptraffic with higher bandwidths, and much higher NNTP prevalencefor the 17000 Kbps class. However, only a small percentage of linesuse NNTP, so its contribution to traffic mix can see more variationacross different types of lines.1200230035006500access bandwidth [Kbps]HTTPBitTorrenteDonkeyNNTP17000otherDPDwell knownunclassifiedFigure 6: Relative application mix per access bandwidth. Bottom bar is HTTP, top bar unclassified.However, we do find that lines with higher access bandwidthhave a higher utilization in terms of average volume per line.Lines in the 3500 and 6500 Kbps categories contribute about twiceas many bytes per line than lines in the 1200 Kbps class, and17,000 Kbps lines three times more. We also find that general traffic per line is consistent with a heavy-tailed distribution, and thetop 2.5% of lines account for 50% of the traffic.To see if time-of-day effects influence the application mix, weexamine the application mix per hour, see Figure 7. We would expect to to observe more bulk downloads and less interactive trafficduring off-hour period, which our data confirms. Night-time traffic includes a larger fraction of P2P traffic, though HTTP remainsdominant during every time slot. Also, we again note high variability in NNTP due to the small number of lines using it.In contemporaneous work Erman et al. [15] studied the application mix and HTTP content type of a major US broadband providerin the context of understanding the potential for forward caching.They find that HTTP contributes 61% on average and 68% during the busy-hour to the traffic volume in the downstream direction while P2P only contributes 12%. As such, their results arestrikingly similar to our results, strengthening the observation thatHTTP is again on the rise and P2P on the decline.4.2 Application mix of P2P VS. Non-P2P linesNext we study if the application usage of those lines that frequently use P2P differs from those that do not. We find that roughly3% of DSL-lines use P2P protocols and that their traffic contribution accounts for 30% of overall volume. If a line uses P2P protocols, they usually also account for most of the line’s traffic: 29%BitTorrent and 17% eDonkey. However, HTTP is still popular andis responsible for 23% of transferred bytes. We also note that thefraction of unclassified traffic is higher at 23%, corresponding toroughly 64% of all unclassified traffic. There is hardly any NNTPusage, only 0.6% of bytes.
h17h18h19h20h21h22h23h0h1h2h3h0Figure 7: Relative application mix hour-by-hour. Same legendas in Figure 6.ProtocolHTTPBitTorrenteDonkeySSLNNTPRTSPVPD /VD97.5%4.8%36.6%75.2%66.7%92.6%VPD /VP98.1%66.1%55.9%86.1%95.3%99.1%Table 3: DPD vs. destination port. VD is the volume identifiedby DPD for a given protocol P, VP is the volume observed onthe P’s default port(s), and VDP is the intersection of the two(running on P’s default port and detected as P).Non-P2P lines predominantly use HTTP, for which it contributes72% of their traffic volume, followed by NNTP with 6.5%, withonly 5.2% of the traffic unclassified. Streaming services are alsomore dominant in this group (6.7%).4.3 Does port-based classification work?Very often in networking studies it is easier or more tenable toacquire TCP/IP transport information rather than relying on deeppacket inspection systems. A significant question concerning theaccuracy of such studies regards the degree to which one cansoundly infer application protocols based solely on the TCP/UDPport numbers that connections use. Certainly, in adversarial settings, classification based on port numbers has quite limited power,due to the ease by which end systems can vary the ports they use.However, for non-adversarial situations, one might hope to leverage a predominant tendency for applications to indeed stick withthe port assigned for their use.Our DPD-based analysis—which is highly accurate for those applications where we have a full protocol parser, and still potentiallyquite accurate when we employ only a partial parser—presents anopportunity to assess the accuracy of port-based classification usingfairly solid ground truth.Numerous previous studies have indicated that the advent of P2Phas rendered port-based approaches infeasible. Cho et al. [10]found that on Japanese Internet backbone links, 79% of traffic (bybytes) uses unknown ports, and that TCP port 80 contributes only14% of bytes. In 2004 Karagiannis et al. [26] found P2P trafficincreasingly moving away from well-known ports to dynamicallynegotiated ports. Kim et al. [23] found that port-based detectionquality is inversely proportional to the fraction of P2P traffic.We confirm that for current residential traffic a port-based approach works quite well. Table 3 shows how well a port-based approach would have performed for dominant application layer protocols. For each protocol P, column VPD /VD is the fraction of thetraffic volume observed on P’s default port(s) that DPD identifiesas P. Column VPD /VP shows the proportion of the traffic on P’sport that would be correctly identified by only inspecting the portnumber.We interpret the table as follows. Most of the HTTP traffic(97.5% of bytes) does indeed appear on port 80 (middle column),and when looking at
Figure 2: DSL (Radius) session termination causes distribution for sessions lasting longer than 5 minutes. time fraction of online DSL lines [%] 40 42 44 46 48 50 4h 8h 12h 16h 20h 0h 4h Figure 3: Relative number of concurrent DSL lines across time for one 24h weekday period of dataset TEN. Note the base-line.