Transcription
CONTRACT OVERSIGHT DESK REVIEWOur Kids of Miami-Dade/Monroe, Inc.Contract KJ114Desk Review Completed: June 2019As required by section 402.7305 FS, The Department of Children and Families performed a DeskReview for Our Kids of Miami-Dade/Monroe, Inc.
TABLE OF CONTENTSEXECUTIV E SUMMARY .1SECTION 1: PERFORMANCE AT A GLANCE .1SECTION 2: SERVICE AREA DESCRIPTION .3CHILD FATALITIES. 3SECTION 3: AGENCY SUMMARY.4NUMBER OF I NVESTIGATIONS, REMOVALS AND CHILDREN SERVED. 5FINANCIAL VIABILITY SUMMARY . 5SECTION 4: PERFORMANCE INDICATORS AND QUAL ITY ASSURANCE DATA .6CONTRACT AND CBC SCORECARD MEASURES . 7CHILD SAFETY .10PERMANENCY .14W ELL-BEING.19SECTION 5: PLACEMENT RELATED DATA.22SECTION 6: ACTIONS TAKEN IN RESPONSE TO PREV IOUS MON ITORIN G ACTIVITIES .24SECTION 7: DESK REVIEW FINDIN GS .26FY 18/19 Desk ReviewOur Kids of Miami-Dade/Monroe, Inc., KJ114June, 2019ii P a g e
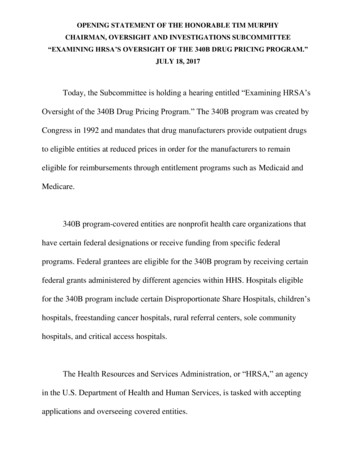
EXECUTIVE SUMMARYThe Department’s Community Based Care Monitoring Team performed a Desk Review for Our Kids ofMiami-Dade/Monroe, Inc. (Our Kids), Contract KJ114. Our Kids provides child welfare services forcircuits 11 and 16, which encompass Miami-Dade and Monroe counties in the Southern Region ofFlorida since 2009.The monitoring process included a review of Our Kids’ performance on both quantitative and qualitativeperformance measures, and information from the contract manager regarding previous CBC monitoringfindings. Supplementary information was provided by the Department’s Office of RevenueManagement, Office of Community-Based Care (CBC)/Managing Entity (ME) Financial Accountability,Office of Child Welfare and Southern Region contract manager, quarterly financial viability reports,system adoption initiative gap analysis and service array assessment.The CBC monitoring team involved in the review consisted of Department of Children and FamiliesCommunity Based Care Monitoring Unit staff- Kelly Welch, Megan Wiggins, Jessica Manfresca and AlissaCross.SECTION 1: PERFORMANCE AT A GLANCEThe graphs on the following page are provided by Casey Family Programs. Casey Family Programs worksin all 50 states, the District of Columbia, two US territories, and more than a dozen tribal nations. Theyactively work with Florida child welfare professionals to improve practice through use of evidence-basedprograms and data analytics. The most up-to-date Our Kids’ performance is depicted later in this report.FY 18/19 Desk ReviewOur Kids of Miami-Dade/Monroe, Inc., KJ114June, 20191 P age
FY 18/19 Desk ReviewOur Kids of Miami-Dade/Monroe, Inc., KJ114June, 20192 P age
SECTION 2: SERVICE AREA DESCRIPTIONThis section provides a snapshot of the community Our Kids serves, including US Census data,information on child welfare partners, Florida Department of Health birth and infant mortality rates andDCF investigations of child fatalities reported to the Florida Abuse Hotline. Additional information mayinclude data from the 2018 Florida Kids Count County Child Well-being Index attached to this report.Our Kids serves the childen and families in Miami-Dade and Monroe counties representing the 11th and16th Judicial Circuits in the Southern Region. The table below provides key US Census Facts for thesecounties as compared to the statewide percentages.The population in Monroe County is more affluent than Miami-Dade and the State. A higher percentageof the population in Monroe County has a high school and college degree as well. (See Table 1)CHILD FATALITIESBIRTH AND INFANT MORTALITY RATESIn 2017, there were more births in Miami-Dade County than Monroe County and the State and therewere fewer infant mortalities in both counties served by Our Kids as compared to the statewide rate.(See Table 2)FY 18/19 Desk ReviewOur Kids of Miami-Dade/Monroe, Inc., KJ114June, 20193 P age
CHILD FATALITY INVESTIGATIONSFrom 2009, until the time of this monitoring, 366 child fatalities were investigated in circuits 11 and 16.Of the 366 fatalities investigated during this time, 47 had previous or current case managementinvolvement. Since the last monitoring report, one death resulted in a special review. A one-year-old Miami-Dade child waspronounced deceased after hesustained severe burns while his 10year-old sibling was reportedly givinghim a bath. At the time of the incident,the family was receiving court-orderedprotective supervision following thereunification of the deceased child’ssiblings, who were removed for asecond time in June 2015. A SpecialReview was conducted. The full reportcan be viewed here: Special Report 18406614.SECTION 3: AGENCY SUMMARYOur Kids operates in the 11th and 16th circuits in the Southern Region serving Monroe and Miami-Dadecounties.In Miami-Dade County (Circuit 11), case management and adoption services are provided by Children’sHome Society of Florida, Inc. (CHS), Family Resource Center, Inc. (FRC) and Center for Family and ChildEnrichment, Inc. (CFCE). Our Kids also provides Adoption services. Training, placement, independentliving/EFC and recruitment and licensure services are provided by Our Kids’ staff. Recruitment andlicensure services are also provided by Camelot Community Care, Inc. and the National Youth AdvocateProgram (NYAP) in Mimi-Dade County. Family Support Services are provided by Citrus Health NetworkFamily Central, New Horizon’s Community Mental Health, The Village South, Inc. and Federation forFamilies (FFF). Safety Management Services are provided by FFF and the CFCE. Several foster parentassociations are active in Circuit 11 and 16 – Florida Keys Foster and Adoptive Parent Association,Miami-Dade Foster and Adoptive Parent Association, Miami-Dade/Monroe Counties Kinship Parent’sAssociation and the South Florida Foster and Adoptive Parent Association.In Monroe County (Circuit 16), case management, placement, training, FSS and SMS services areprovided by Wesley House Family Services. Adoption and recruitment and licensing are provided byWesley House Family Services and Our Kids. Independent living and extended foster care services areprovided by Our Kids. Miami Dade/Monroe Counties Kinship Parent’s Association is present in Circuit16.FY 18/19 Desk ReviewOur Kids of Miami-Dade/Monroe, Inc., KJ114June, 20194 P age
NUMBER OF INVESTIGATIONS, REMOVALS AND CHILDREN SERVEDIn FY 17/18, the number of reports accepted for investigation by the Department’s child protectiveinvestigations team, the number of children entering out of home care, the number of children receivingfamily support services, and the number of children receiving in and out of home care servicesdecreased. (See Table 3) During this time, the number of Young Adults Receiving Services increased. InMay 2019, 47 children entered out-of-home care in Miami-Dade and Monroe counties. This was thelowest number of entries in a single month in over ten years (source: DCF Children Entering Out-ofHome Care Dashboard, Data pull date: 6/10/19)FINANCIAL VIABILITY SUMMARYThe Office of CBC/ME Financial Accountability performed financial monitoring procedures, based on theDCF 2017-18 CBC-ME Financial Monitoring Tool for Desk Reviews, of Our Kids. The desk review periodwas for the period of July 1, 2017 – September 30, 2017. Three findings related to general ledger, nonpayroll related disbursement testing and FSFN Review were found. Two observations related to nonpayroll disbursement testing and additional financial requirements were noted. Technical assistancewas provided around general ledger.For further details, please see the complete fiscal report – FY1718 Financial Desk Review Our KidsOur Kids’ core services funding has remained relatively stable in the past four fiscal years. In FY 14/15, abudget amendment for 5.4M was approved by the Legislative Budget Commission to help Our KidsFY 18/19 Desk ReviewOur Kids of Miami-Dade/Monroe, Inc., KJ114June, 20195 P age
with a projected deficit. In FY 15/16, Our Kids received MAS from Back of the Bill. Our Kids has held apositive carry forward balance since receiving 5.4M in FY 14/15. (See Table 4)Comparison of Funding by Fiscal YearOur Kids of Miami-Dade and MonroeDCF Contract Funds Available(by Fiscal Year)Core Services FundingOther**Total Initial AppropriationRisk Pool AllocationCBC Operational Costs from Back of theBillBudget Amendment Approved byLegislative Budget CommissionMAS from Back of the BillCarry Fwd Balance from Previous YearsTotal Funds AvailableFY13-14 70,014,276 28,854,005 98,868,281FY14-15 70,053,264 28,375,641 98,428,905FY15-16FY16-17FY17-18FY18-19 73,062,669 28,766,706 101,829,375 73,366,913 31,055,250 104,422,163 73,648,328 30,736,917 104,385,245 73,695,431 29,843,615 103,539,046 349,052 223,014 102,401,441 2,925,326 107,347,489 4,011,050 108,396,295 2,075,771 105,614,817 5,410,094 2,813,708 101,681,989 906,032 104,745,031** Includes as applicable Maintenance Adoption Subsidy (MAS), Independent Living (IL and Extended Foster Care), Children's Mental Health Services(Cat 100800/100806), PI Training, Casey Foundation or other non-core servicesSource: Comprehensive Review of Revenues, Expenditures, and Financial Position of All CBC Lead Agencies (11/1/18)Table 4SECTION 4: PERFORMANCE INDICATORS AND QUALITY ASSURANCE DATAThis section provides a picture of Our Kids’ performance as captured by data indicators that are used toassess how well Our Kids is performing on contract measures and within the larger program areas ofsafety, permanency and well-being. The information in the following graphs and tables representsperformance as measured through information entered into the Florida Safe Families Network (FSFN)and performance ratings based on the Department’s CQI case reviews.The performance measures outlined in this report are accessible through the Child Welfare Dashboardand include both federal and state measures used to evaluate the lead agencies on 12 key measures todetermine how well they are meeting the most critical needs of at-risk children and families.Federal regulations require Title IV-E agencies to monitor and conduct periodic evaluations of activitiesconducted under the Title IV-E program to ensure that children in foster care are provided qualityservices that protect the safety and health of such children (sections 471(a)(7) and 471(a) (22) of theSocial Security Act). The Department of Children and Families has developed additional methods toevaluate the quality of the services provided by the lead agency using Rapid Safety Feedback (RSF) andContinuous Quality Improvement (CQI) reviews. Rapid Safety Feedback (RSF) assesses open in-home service cases. The RSF Tool focuses onsafety and is used to review active cases that have specified high risk factors.CQI reviews are conducted on a random sample of cases that are both in home and out ofhome. The reviews are conducted by CBC staff and use the same review instrument as the Childand Family Services Review (CFSR).In addition to the state developed quality assurance reviews, section 1123A of the Social Security Actrequires the federal Department of Health and Human Services to periodically review state child andFY 18/19 Desk ReviewOur Kids of Miami-Dade/Monroe, Inc., KJ114June, 20196 P age
family services programs to ensure substantial conformity with the state plan requirements in Titles IV-Band IV-E of the Act. This review is known as the CFSR. After receiving the results of the CFSR review,States must enter a Program Improvement Plan (PIP) to address areas that the Children’s Bureaudetermines require improvement (45 CFR 1355.34 and 1355.35). CFSR reviews are completed by CBC and DCF staff and consist of a case file review, interviewingcase participants, and completing the on-line review instrument. In addition, these casesreceive 2nd level reviews by the Office of Child Welfare and at times, 3rd level reviews by theAdministration for Children and Families to ensure each case was accurately rated.The results of the CFSR are considered baseline performance and the PIP goal is the level ofimprovement needed to avoid financial penalties. Therefore, the PIP goal may be lower than the overallfederal and state expectation of 95%. The Department expects CBC agencies to strive toward 95%performance expectation on all CQI measures with focused activity around the federal PIP goals.The quality ratings used throughout this report are based on the Department’s CQI case reviews,including CQI/CFSR reviews and Rapid Safety Feedback reviews. The CFSR On Site Review Instrumentand Instructions and the Rapid Safety Feedback Case Review Instrument are both available on theCenter for Child Welfare website and provide details on how ratings are determined.CONTRACT AND CBC SCORECARD MEASURESDuring FY 17/18, Our Kids has met or exceeded their established contract target, federal standards andstatewide performance in nine of the thirteen measures including: M01: Rate of abuse per 100,000 days in foster careM02: % of children who are not neglected or abused during in-home servicesM03: % of children who are not neglected or abused after receiving servicesM04: % of children under supervision who are seen every 30 daysM06: % of children exiting to a permanent home within 12 months for those in care 12 to 23monthsM09: % of children in out-of-home care who received medical service in the last 12 monthsM10: % of children in out-of-home care who received dental services within the last sevenmonthsM11: % of young adults in foster care at age 18 that have completed or are enrolled insecondary educationAdoption Measure: Number of children with finalized adoptionsThese measures were successfully met in FY 16/17. (See Table 5) M02: % of children who are not neglected or abused during in-home servicesM03: % of children who are not neglected or abused after receiving servicesM04: % of children under supervision who are seen every 30 daysFY 18/19 Desk ReviewOur Kids of Miami-Dade/Monroe, Inc., KJ114June, 20197 P age
M05: % of children exiting to a permanent home within 12 months of entering careM06: % of children exiting to a permanent home within 12 months for those in care 12 to 23monthsM09: % of children in out-of-home care who received medical service in the last 12 monthsM10: % of children in out-of-home care who received dental services within the last sevenmonthsM11: % of young adults in foster care at age 18 that have completed or are enrolled insecondary educationAdoption Measure: Number of children with finalized adoptionsIn the remaining four measures, Our Kids did not meet the established targets for FY 17/18. Thesemeasures are: M05:M07:M08:M12:% of children exiting to a permanent home within 12 months of entering care% of children who do not re-enter care w/in 12 months of moving to a permanent homePlacement moves per 1,000 days in foster care% of sibling groups where all siblings are placed togetherFY 18/19 Desk ReviewOur Kids of Miami-Dade/Monroe, Inc., KJ114June, 20198 P age
Performance MeasuresContract Targets Compared to Federal Standards and Statewide PerformanceFY 18/19 Desk ReviewOur Kids of Miami-Dade/Monroe, Inc., KJ114June, 20199 P age
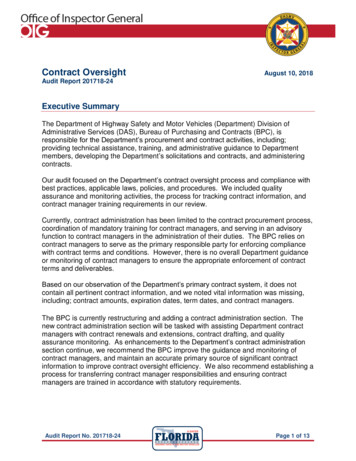
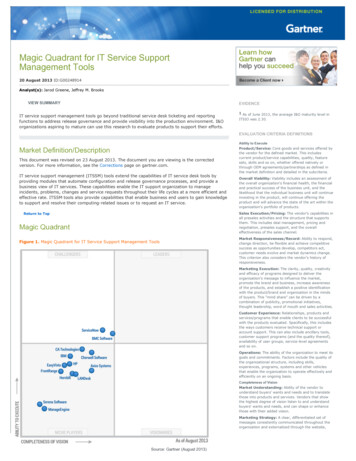
CHILD SAFETYThe figures and tables on the follow pages depict Our Kids‘ performance related to safety in thefollowing areas:1.2.3.4.5.6.Rate of Abuse in Foster CareNo maltreatment after Family Support ServicesNo maltreatment during in-home servicesNo maltreatment after receiving servicesChildren seen every 30 daysQualitative Case ReviewsOver FY 16/17 and FY 17/18, Our Kids has consistently shown positive performance on scorecardmeasures related to safety, however, quality reviews show a significant decrease in performance. Over75% of the cases reviewed had insufficient assessments and safety plans and only a third of casesreviewed showed sufficient quality in the contacts with the children.Analysis of the trends in performance for scorecard measures over the last 8 quarters, still show targetbeing consistently met, however there is recent negative trend related to abuse or neglect while infoster care. Despite the negative trend, this measure is still under target.RATE OF ABUSE IN FOSTER CARERate of abuse or neglect per day while in foster care (Scorecard Measure M01): This graph depictsthe rate at which children are the victimsof abuse or neglect while in foster care(per 100,000 bed days). This national dataindicator measures whether the state childwelfare agency ensures that children donot experience abuse or neglect while inthe state’s foster care system. It should benoted that this measure includes bothlicensed foster care and relative/nonrelative placements.Our Kids’ performance on this measure iscurrently below the performance targetand has been so in all the past eightquarters. Performance has been trendingnegatively in the past four quarters. (See Figure 2) Further, qualitative reviews show that despite anincrease from FY 16/17, Our Kids’ performance was below the federal performance improvement plan(PIP) goal in FY 17/18 for CQI Item 3, making concerted efforts to address risk and safety. (See Table 7)FY 18/19 Desk ReviewOur Kids of Miami-Dade/Monroe, Inc., KJ114June, 201910 P a g e
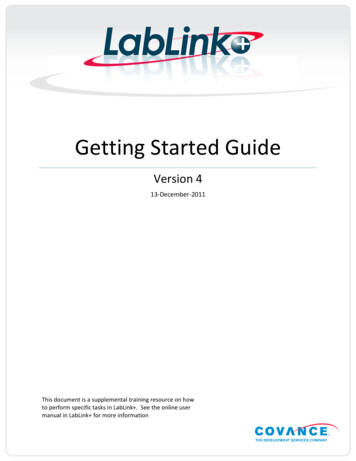
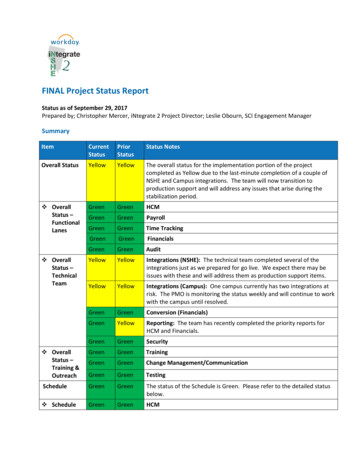
NO MALTREATMENT AFTER FAMILY SUPPORT SERVICESPercent of children not abused or neglected within six months of termination of family supportservices. This graph depicts thepercentage of children who did not have averified maltreatment during the reportperiod. This is a Florida indicator thatmeasures the CBC’s success in enhancingthe protective factors in a family to ensurethe children remain safe after familysupport services have ended. Our Kids’performance has exceeded the state in fiveof the past eight quarters. (See Figure 3)NO MALTREATMENT DURING IN-HOME SERVICESPercent of children not abused orneglected while receiving in-homeservices (Scorecard Measure M02): Thi sgraph depicts the percentage of childrenwho did not have a verified abuse orneglect maltreatment while receiving inhome services. This indicator measureswhether the CBC was successful inpreventing subsequent maltreatment of achild while a case is open, and the CBC isproviding in-home services to the family.Our Kids has shown consistently strongperformance on this measure. In all thepast eight quarters, Our Kids exceeded theperformance target and outperformed thestate. (See Figure 4) Further, qualityreviews show that Our Kids improved FY17/18 performance by 6.3% in making concerted efforts toassess and address the risk and safety concerns relating to the child(ren) in their own homes or while infoster care. However, Our Kids’ improvement on this measure did not meet the federal PIP goal andwas below the statewide performance. (See Table 7)FY 18/19 Desk ReviewOur Kids of Miami-Dade/Monroe, Inc., KJ114June, 201911 P a g e
CHILDREN WHO ARE NOT NEGLECTED/ABUSED AFTER RECEIVING SERVICESPercent of children not maltreated within six months of termination of supervision (ScorecardMeasure M03): This graph de pi cts thepercent of children who were not thevictims of abuse or neglect in the sixmonths immediately followingtermination of supervision.Our Kids also showed strong, consistentperformance on this measure,exceeding the performance target andstatewide performance in all the pasteight quarters. (See Figure 5) Qualityreviews show a 10.8% improvement inFY 17/18 in the agency makingconcerted efforts to provide services tothe family to prevent children’s entryinto foster care or re-entry afterreunification. (See Table 7)CHILDREN SEEN EVERY 30 DAYSChildren under supervision who are seen every 30 days (Scorecard Measure M04): This measurede picts the rate at which children are seen every 30 days while in foster care or receiving in-homeservices during the report period. Data for this measure was temporarily unavailable at the time of thisreport.FY 18/19 Desk ReviewOur Kids of Miami-Dade/Monroe, Inc., KJ114June, 201912 P a g e
QA CASE REVIEW DATAThe tables in this section provide the current performance in items related to child safety that are basedon qualitative case reviews. In FY 17/18, qualitative RSF reviews showed a decline in performancerelated to sufficiency of familyassessments and safety plans and inquality visits between the casemanager and child(ren). (See Table6). Although, Our Kids improvedperformance in FY17/18 CQIreviews related to child safety, casereview data indicates that Our Kidscase managers were makingconcerted efforts to assess andaddress the risk and safety concernsrelated to the children in their ownhomes or while in foster care (CQIItem 3) in only 56.3% of sampledcases which is below both thestatewide performance and theFederal PIP Goal. (See Table 7)FY 18/19 Desk ReviewOur Kids of Miami-Dade/Monroe, Inc., KJ114June, 201913 P a g e
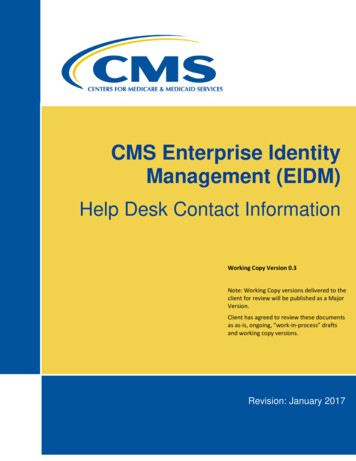
PERMANENCYThe graphs and tables on the follow pages depict Our Kids’ performance related to permanency in thefollowing areas:1.2.3.4.5.6.7.Permanency in 12 monthsPermanency in 12-23 monthsPermanency after 24 monthsPlacement stabilityPercent not re-entering careSiblings placed togetherQualitative case reviewsIn FY 17/18, Our Kids’ performance on measures related to permanency declined overall. Scorecardmeasures related to permanency show a decline in three of the five measures, remained steady inplacement moves and slightly improved in re-entry within 12 months. Our Kids’ FY17/18 performanceon qualitative measures declined in eight of the eleven measures and underperformed the State in tenof the eleven measures. Two qualitative measures have a federal PIP goal (CQI Item 4 and CQI Item 6).Our Kids failed to meet the federal PIP goal in both measures.PERMANENCY IN 12 MONTHSPercent of children exiting foster care to a permanent home within 12 months of entering care(Scorecard Measure M05): This graph depicts the percentage of children who entered foster careduring the report period where the childachieved permanency within 12 monthsof entering foster care.Our Kids has seen an overall negativetrend in performance for this measureover the last eight quarters, withperformance falling well below target.(See Figure 7) This correlates with the16.1% decline in performance onquality reviews on concerted efforts toestablish a permanency goal. (SeeTable 9)FY 18/19 Desk ReviewOur Kids of Miami-Dade/Monroe, Inc., KJ114June, 201914 P a g e
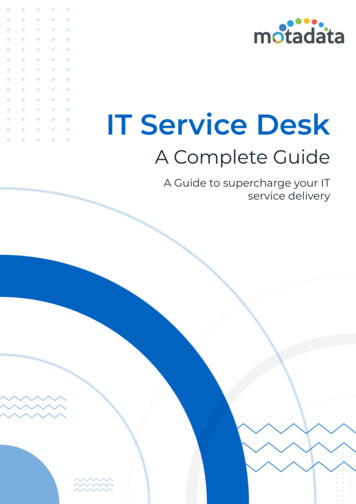
PERMANENCY IN 12 – 23 MONTHSPercent of children exiting foster care to a permanent home in 12 months for children in foster care12 to 23 months (Scorecard Measure M06): This graph provides the percentage of children in fostercare whose length of stay is betweentwelve 12 and 23 months as of thebeginning of the report period whoachieved permanency within twelvemonths of the beginning of the reportperiod.Our Kids has consistanlty met and oftensignificantly exceeded the target for thismeasure which is aligned with theirdecrease in performance for permanencyin 12 months. (See Figure 8) In addition toa decline in qualitative performancementioned above, Our Kids’ performancedeclined 4.5% in making concerted effortsto achieve reunification, guardianship,adoption, or other planned permanent living arrangement for the child. (See Table 9)PERMANENCY AFTER 24 MONTHSPercent of children in foster care for 24 or more months exiting to a permanent home: This graphdepicts the percentage of children whowere in foster care for 24 or moremonths and achieved permanency uponexiting foster care.The graph shows that Our Kids hasconsistently performed under thestatewide rate but in recent monthsperformance is trending upward overall.(See Figure 9) CQI Item 6 shows a 4.5%reduction in FY 17/18 in makingconcerted efforts to achievereunification, guardianship, adoption orother planned permanent livingarrangement for the child. (See Table 9)FY 18/19 Desk ReviewOur Kids of Miami-Dade/Monroe, Inc., KJ114June, 201915 P a g e
PERCENT NOT RE-ENTERING INTO CAREPercent of children who do not re-enter foster care within 12 months of moving to a permanenthome (Scorecard Measure M07): Thisgraph de pi cts the percentage of exitsfrom foster care to permanency for acohort of children who entered fostercare during the report period andexited within 12 months of enteringand subsequently do not re-enterfoster care within 12 months of theirpermanency date.Our Kids’ has consistently met thetarget and performed better that thestate for the past eight quarters.Quality reviews also show positiveresults in concerted efforts to preventremoval and re-entry afterreunification. (See Figure 10)PLACEMENT STABILITYPlacement moves per 1,000 days in foster care (Scorecard Measure M08): This graph de pi cts the rateat which children change placements while in foster care during the report period.Our Kids has seen an overall negativetrend in performance and have failedto meet the performance target inthe past eight quarters. (See Figure11) Additionally, quality reviewsshowed a decline in performance,falling below the federal PIP goal, inFY17/18. (See Table 9).FY 18/19 Desk ReviewOur Kids of Miami-Dade/Monroe, Inc., KJ114June, 201916 P a g e
SIBLINGS PLACED TOGETHERPercent of sibling groups where all siblings are placed together (Scorecard Measure M12): Thisgraph depicts the percentage of sibling groups with two or more children in foster care as of the endof the report period where allsiblings are placed together.Our Kids has failed to meet theperformance target and hasunderperformed the state in all thepast eight quarters. (See Figure 12)Our Kids’ qualitative performancedeclined 8.7% in FY 17/18 in ensuringshared sibling placement unlessseparation was necessary to meetthe needs of one of the siblings. (SeeTable 9).QA CASE REVIEW DATAThe table below provides the current performance in items related to permanency that are based onqualitative case reviews. In FY17/18, qualitative RSFreviews showed a decline in performance related toquality visits between the case manager and parentsand child(ren). (See Table 8). Our Kids improvedperformance in FY17/18 in three of eight CQI reviewsrelated to permanency. And, Our Kids failed to meetthe federal PIP goal in either of the two measures thatcurrently have a PIP goal. (See Table 9)FY 18/19 Desk ReviewOur Kids of Miami-Dade/Monroe, Inc., KJ114June, 201917 P a g e
FY 18/19 Desk ReviewOur Kids of Miami-Dade/Monroe, Inc., KJ114June, 201918 P a g e
WELL-BEINGThe graphs and tables on the follow pages depict Our Kids’ performance related to well-being in thefollowing areas:1. Children receiving medical care2. Children receiving dental care3. Young adults enrolled in secondary education4. Qualitative case reviewsOur Kids is performing well on all quantitative and qualitative measures related to child well-being.Despite an increase in performance, Our Kids did not meet the PIP goal for making concerted effortsinvolving children and parents in the case planning process (CQI Item 13).CHILDREN RECEIVING MEDICAL CAREPercent of children in foster care who received medical care in the previous 12 months (ScorecardMeasure M09):This graph depicts the percentage ofchildren in foster care as of the end ofthe report period who have received amedical service in the last 12 months.Our Kids exceeded the performancetarget in all the past eight quartersand exceeded the state in seven of thepast eight quarters. (See Figure 13)Further, FY 17/18 qualitative reviewsshow a 27.9 % improvement inensuring the physical health needs ofthe children are met and a 29.0%improvement in addressing themental/behavioral health needs of thechildren. (See Table 10)FY 18/19 Desk ReviewOur Kids of Miami-Dade/Monroe, Inc., KJ114June, 201919 P a g e
CHILDREN RECEIVING DENTAL CAREPercent of children in foster care who received a dental service in the last 7 months (ScorecardMeasure M10): This graph depicts thepercentage of children in foster care asof the end of the report period whohave received a dental service in the last7 months.Our Kids exceeded the statewideperformance in all of the past eightquarters
FY 18/19 Desk Review 1 Page Our Kids of Miami -Dade/Monroe, Inc., KJ114 June, 2019 EXECUTIVE SUMMARY The Department's Community Based Care Monitoring Team performed a Desk Review for Our Kids of Miami-Dade/Monroe, Inc. ( Our Kids ), Contract KJ114. Our Kids provides child weflare servcies for