Transcription
FINTECHSECTOR REPORTApril 2019
CASE STUDY: SALE OF ZIPLOGIX TO LONE WOLF TECHNOLOGIESGCA acted as exclusive financial advisor to zipLogix, a leading provider of real estate transactionmanagement software, on its sale to Lone Wolf Technologies, a portfolio company of Vista Equity Partners.TRANSACTION DETAILSClosedApril 2019SECTORResidential Real EstateTechnologyDEAL TYPEM&ATransaction SummaryStrategic Rationale On April 22, 2019, Lone Wolf Technologies (“Lone Wolf”)announced that it had completed the acquisition ofzipLogix LLC (“zipLogix” or the “Company”) zipLogix will immediately establish Lone Wolf as theleader in real estate transaction forms Financial terms of the transaction were notdisclosed Headquartered in Fraser, Michigan, zipLogix is the leadingprovider of real estate transaction forms and transactiondocumentation management software for the residentialreal estate sector Lone Wolf, a portfolio company of Vista Equity Partners,provides real estate software solutions, such as backoffice management, marketing and e-signature platforms,to more than 20,000 real estate offices across NorthAmerica zipLogix management has advanced marketpenetration in the Company’s forms business havingsuccessfully developed strong upsell opportunitiesincluding e-signature, CRM and database linkingsolutions Lone Wolf will support zipLogix’s continued operationsand leverage the combined Company’s cross-sellingopportunities The combined company will service over 1.4 millionagents, 20,000 offices, and 1,000 MLSs and Associationsin the U.S. and Canada GCA acted as exclusive financial advisor to zipLogix inconnection with the transaction2
BROAD AND DEEP FINTECH PRACTICEGCA has created an interdisciplinary team of senior bankers across FinTech, Software, Private Capital and M&A to serve virtually allsub-sectors and business models across the FinTech ecosystemSELECTED BLUE CHIP STRATEGIC& FINANCIAL CONTACTSKEY GCA STATSSECTOR COVERAGE400 Bankers globallyPayments / Billing / Money TransferStrategic AcquirersReal Estate & Mortgage Technology21Insurance TechnologyOffices globallyOnline / Alternative LendingBanking Technology3Continents – America,Asia and EuropeInvestment & Wealth TechnologyBlockchain / Crypto375 Transactions in the lastthree yearsPrivate Equity / VCRegulatory TechnologyTrading & Capital Markets TechnologyBUSINESS MODEL COVERAGECross-border33% transactionsSaaS andEnterpriseSoftwareInformationServices /Data 3
GCA FINTECH TEAMStrong sector and product expertise across FinTech and related sub-sectorsChris GoughPaul DiNardoRob FreimanManaging DirectorSoftware / FinTech M&AManaging DirectorHead of SoftwareDirectorFinTechPhone: (415) 318 - 3658Mobile: (415) 385 - 9427cgough@gcaglobal.comPhone: (212) 999 - 7097Mobile: (650) 483 - 7246pdinardo@gcaglobal.comPhone: (212) 999 - 7075Mobile: (973) 229 - 0436rfreiman@gcaglobal.comSelected Recent FinTech ExperienceAcquired byAcquiredPreferred FinancingAcquired byPreferred FinancingfromWe advised zipLogixWe advised Bowmark CapitalWe advised LoanbooxWe advised AttomWe advised GOQiiWe Advised SilverInvestment PartnersWe Advised QuoteWizardReal Estate TechFinancial SaaSBanking & Lending TechReal Estate TechInsurance TechnologyPaymentsInsurance TechnologyReceived aninvestment fromAcquired bySold majority stake toAcquiredAcquired byAcquired byAcquired byWe Advised Liqid’sshareholder HQ TrustWe Advised BexioWe Advised Risk InternationalWe Advised PrincipalWe Advised CHXFairness Opinion to ClearentWe Advised FieldEdgeInvestment TechnologyInsurance TechnologyInsurance TechnologyInvestment TechnologyLiquidity VenuesPaymentsFinancial SaaSSoldTender Offer forFinancing fromMajority sale toAcquiredAcquired bya portfolio company ofToSale ofSold stake inAcquired byToAsahi Fire & MarineInsurance Co.ToWe Advised BlackFinWe Advised AsahiWe Advised WorkMarketWe Advised RGI ShareholdersWe Advised RadiusWe Advised SkyslopeFinancial AdvisorInsurance TechnologyInsurance TechnologyFinancial SaaSInsurance TechnologyPaymentsReal Estate TechBanking & Lending Tech4
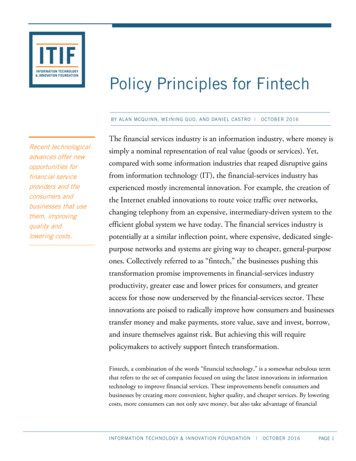
FINTECH DEAL DASHBOARDBoth financing volume and M&A volume thus far in Q2 ‘19 lagged behind Q2 ’18 45 Bn 1,529 DealsLTM Financing Volume 156 Bn 767 DealsLTM M&A VolumeSelect April Financing TransactionsDateCompanySelect April M&A TransactionsSelected InvestorsAmountDateTarget4/30/19 2004/25/19 3254/30/19 5684/18/19 1134/11/19 3004/17/19NA4/8/19 504/15/19 824/3/19 3004/10/19 1704/2/19 884/9/19 850Quarterly Financing Activity ( Bn)Quarterly M&A Activity ( Bn)388378378216 19 5225223212192308 7Value428397397Buyer177155 10 8 10 10130Q3-17Q4-17Q1-18Q2-18Q3-18Q4-18Q1-19Q2-19 (1) 12.7 17.9 19.4 61.7 26.5 25.5 22.5 23.9Average Deal Size ( MM)Notes:Source: Pitchbook. CapIq. GCA Deal Database.Market data as of 4/30/19.(1)Q2-19 data represents April only.50 46 32 17 3 92 28 26 17 2Q3-17Q4-17Q1-18Q2-18Q3-18Q4-18Q1-19 147 77.1 240 182 124 96.9 409Q2-19 (1) 32.0Average Deal Size ( MM)5
FINTECH PUBLIC COMPANY LANDSCAPEFinTech sub-sectors and key operating stats ( Bn)1Banking & Lending Technology2Combined Market Cap: 23119/18 Rev. Growth: 8%19 EBITDA Margin: 29%4Benefits Administration/PayrollCombined Market Cap: 12419/18 Rev. Growth: 13%19 EBITDA Margin: 28%Information ServicesCombined Market Cap: 37919/18 Rev. Growth: 6%19 EBITDA Margin: 34%Notes:Source: CapIq.Revenue growth and EBITDA margins shown are median values for comp group.Market data as of 4/30/19.5Financial SaaS3Combined Market Cap: 17819/18 Rev. Growth: 20%19 EBITDA Margin: 21%Insurance TechnologyCombined Market Cap: 4319/18 Rev. Growth: 10%19 EBITDA Margin: 17%6
FINTECH PUBLIC COMPANY LANDSCAPEFinTech sub-sectors and key operating stats ( Bn)6Investment TechnologyCombined Market Cap: 24519/18 Rev. Growth: 8%19 EBITDA Margin: 28%9Liquidity Venues7Combined Market Cap: 28619/18 Rev. Growth: 5%19 EBITDA Margin: 57%Real Estate & Mortgage Tech.Combined Market Cap: 21719/18 Rev. Growth: 10%19 EBITDA Margin: 16%Notes:Source: CapIq.Revenue growth and EBITDA margins shown are median values for comp group.Market data as of 4/30/19.10Payments8Combined Market Cap: 1,16219/18 Rev. Growth: 10%19 EBITDA Margin: 27%Trading TechnologyCombined Market Cap: 10419/18 Rev. Growth: 5%19 EBITDA Margin: 52%7
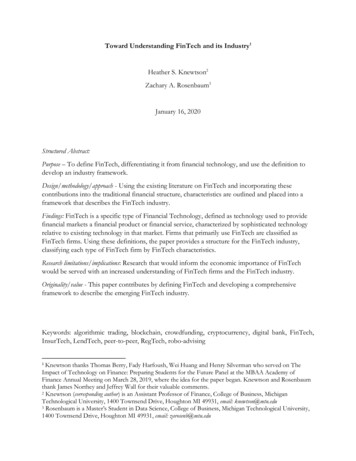
FINTECH STOCK PRICE PERFORMANCEFinancial SaaS leads the FinTech pack on an LTM basisLTM Share Price 4.4%0%-1.1%-10.5%(15%)-16.0%(30%)Apr-181) Banking & LendingTechnology30.6%Jun-182) -183) Financial SaaS4) InformationServices5) InsuranceTechnology6) rce: CapIq.Market data as of 4/30/19.7) Liquidity Venues4.4%Feb-19Apr-198) Payments9) Real Estate &Mortgage Technology10) TradingTechnology32.0%-1.1%-16.0%8
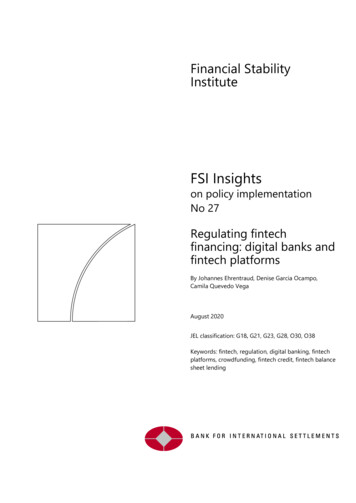
FINTECH PUBLIC COMPANY VALUATIONFinancial SaaS outperforms the FinTech market on a revenue growth and EV / ’19E Revenue basisEV / RevenueEV / ‘19E x0.0x2016201720180.0xApr-182019ERevenue GrowthJun-18Aug-18Oct-18Dec-18Feb-19Apr-19Median 18A/19E Revenue Growth to EV/’19E Revenue .7%10.0%9.5%9.1%70%0.0%15A / 16A18A / 19E Rev.Growth4105%58116A / 17A1) Banking & Lending2) 7A / 18E18A / 19E0.0x2.0x4.0x6.0x8.0x10.0x3) Financial SaaS4) InformationServices5) InsuranceTechnology6) InvestmentTechnology7) Liquidity Venues8) Payments9) Real Estate &Mortgage Technology10) %Notes:Source: CapIq.Market data as of 4/30/19.Lines display median multiples across comp groups for given year.9
FINTECH PUBLIC COMPANY VALUATION (CONT’D)Financial SaaS outperforms the FinTech market on an EBITDA growth and EV / ‘19E EBITDA basisEV / EBITDAEV / ‘19E .0xApr-182019EEBITDA -19Apr-19326 81010%15.0%Aug-18Median 18A/19E EBITDA Growth to EV/’19E EBITDA Multiple75.0%14.0%11.9%95175%9.8%40%0.0%15A / 16A18A / 19EEBITDA GrowthJun-1816A / 17A1) Banking & Lending2) 7A / 18E18A / 19E0.0x6.0x12.0x18.0x24.0x30.0x3) Financial SaaS4) InformationServices5) InsuranceTechnology6) InvestmentTechnology7) Liquidity Venues8) Payments9) Real Estate &Mortgage Technology10) 10.7%Notes:Source: CapIq.Market data as of 4/30/19.Lines display median multiples across comp groups for given year.10
FINTECH PUBLIC COMPANY VALUATION (CONT’D)Long-term growth is not necessarily correlated with FinTech public company P/E multiples or PEG ratios2019 P/E RatioPEG RatioLong-Term EPSGrowth2Benefits Admin/Payroll28.4x2.119%Financial 1.412%1.114%3426.3xInformation Services1Banking & Lending Tech24.0x5Insurance Technology22.9x721.3xLiquidity Venues821.1xPayments919.4xReal Estate & Mort. Tech617.2xInvestment Technology10Trading Technology14.5x0.0x5.0xNotes:Figures represent medians of sub-sectors.Market data as of 4/30/19.Long-term EPS growth covers last 5 years.10.0x15.0x20.0x25.0x30.0x11
SELECTED RECENT GROWTH EQUITY & VC ACTIVITYDateAnnouncedInvestorsTypeAmount ( MM)Sub-Sector4/30/19Arclight Securities, Castle Island Ventures, Cboe, CMT Digital, ConsenSysVentures, Dragonfly Capital Partners, DRW Venture Capital, ED&F Man CapitalSeries B - II 20Liquidity Venues4/30/19Group 11, Signia Venture Partners, Zeev VenturesSeries B - II 30Real Estate & Mortgage Tech.4/30/19MMC Ventures, Smedvig CapitalSeries E 20Financial SaaS4/30/19Insight Partners, New Enterprise Associates, Pelion Venture PartnersSeries C 200Financial SaaSSeries D 568Financial SaaSSeries D 100Financial SaaSSeries B 32Financial SaaS4/30/194/25/194/24/19TargetAccel, capitalG, Coatue Management, Dragoneer Investment Group,Institutional Venture Partners, Madrona Venture Group, Sands Capital, SequoiaChina Everbright Limited, China Merchants Capital, GGV Capital, Guotai Fund,Xinda Hanshi83North, Avigdor Willenz, David Strohm, Dell Technologies Capital, GGVCapital, MS&AD Ventures, NTT DoCoMo, WRVI Capital4/23/19Atlant Fonder, Dunross, Vostok Emerging Finance, Webrock VenturesSeries B 11Banking & Lending Technology4/23/19Omidyar Network, PayU, Quona Capital, Reinventure, Ribbit CapitalSeries B 20Banking & Lending Technology4/22/19Loyal Valley Innovation Capital, Qicheng CapitalSeries C - III 26Investment Technology4/19/19Allianz Life Ventures, Piton Investment Management, William BlairSeries A 11Banking & Lending Technology4/18/19Ally VenturesSeries C - III 20Real Estate & Mortgage Tech.4/18/19Alta Ventures Mexico, Dalus Capital, Endeavor Catalyst, Kaszek Ventures, OriaCapital, Riverwood Capital, Undisclosed InvestorsSeries C 50Financial SaaS4/18/19Groupe CasinoSeries B 23Financial SaaS4/17/19CI Financial, FirePower Capital, Glenn Murphy, INFOR Financial, WD Capital,Windsor Private CapitalSeries A 11Banking & Lending Technology4/17/19Index Ventures, StripeSeries B 40Financial SaaS4/17/19Broadridge Financial Solutions, Goldman Sachs Principal Strategic InvestmentsSeries A 22Financial SaaSAffirm, Craft Ventures, TheVentureCity, Undisclosed InvestorsSeries B 19Financial SaaSSeries B 33Insurance TechnologySeries G 24Payments4/17/194/17/194/17/19Cambridge Innovation Capital, EQT Ventures, Parkwalk Advisors, UndisclosedAngel InvestorsMassMutual, MassMutual Ventures, Synchrony Financial, TransUnion,Wellington Management4/16/19Blenheim Chalcot, Legal & GeneralSeries C 33Benefits Administration/Payroll4/15/19Allstate Strategic Ventures, Intel Capital, Starr Companies, State of MindVenturesSeries B 18Information ServicesNotes:Source: CapIq. Pitchbook.Selected deals from last calendar month.12
SELECTED RECENT GROWTH EQUITY & VC ACTIVITY (CONT’D)DateAnnouncedInvestorsTypeAmount ( MM)Sub-Sector4/12/19Undisclosed InvestorsSeries A 28Investment Technology4/11/19Carrick Capital Partners, Goldman SachsSeries E 48Financial SaaS4/11/19Infield Capital, Luminari Capital, Vision Ridge PartnersSeries D 17Financial SaaS4/11/19ING, Prevision Sanitaria NacionalSeries C 21Banking & Lending Technology4/11/19Allianz X, General Catalyst, Google Ventures, OurCrowd, SoftBank Group,Thrive CapitalSeries D 300Insurance Technology4/10/19East Ventures, EDBI, Rakuten Ventures, Softbank Ventures AsiaSeries B 45PaymentsCity National Bank, FinTech Collective, Point72 Ventures, Reciprocal VenturesSeries A 11Banking & Lending TechnologySeries B 28Insurance TechnologySeries C 170Banking & Lending Technology4/10/194/9/194/8/19TargetBee Partners, Canaan Partners, Manulife Financial, Nyca Partners, Tola Capital,XL InnovateAndreessen Horowitz, B Capital Group, CreditEase Fintech Investment Fund,Formation 8, Foundation Capital, Foxhaven Asset Management, GreenSpring4/8/19First National Bank of Omaha, HOOPP, Progressive Investment CompanySeries E 50Banking & Lending Technology4/8/19Back in Black Capital, BESTSELLER, Brightfolk, Filip Engelbert, H&M Group,Harvest Growth Capital, JFT Holdings, Jonas Nordlander, Justin Drees, KoolUnattributed VC 108Payments4/4/19Franklin Templeton InvestmentsSeries B - II 30Banking & Lending Technology4/3/19Baillie Gifford & Co., Fidelity Investments, Founders Fund, GIC, LightspeedVenture Partners, Moore Asset Backed Fund, Ribbit Capital, Sound Ventures,Series F 300Banking & Lending Technology4/3/19Accel, CME Ventures, Cristobal Conde, Dawn CapitalSeries E 10Information Services4/3/19Creandum, Redalpine Venture Partners, Valar VenturesSeries B 30Financial SaaS4/3/19FinVC, M12, Salesforce Ventures, SBI GroupSeries D 50Financial SaaS4/3/19Clal Insurance Enterprises Holdings, Digital Ventures, GF Investments, HarveyGolub, Oak HC/FT Partners, Viola VenturesSeries C 25Investment Technology4/2/19Andreessen Horowitz, Polychain CapitalSeries A 30Payments4/2/19Accomplice, FirstMark Capital, JuxtaposeSeries B 20Real Estate & Mortgage Tech.Series H 88PaymentsSeries B 30Financial SaaS4/2/194/2/19Cross Creek Advisors, Fidelity Investments Canada, FleetCor Technologies,Franklin Templeton Investments, Kayne Anderson Rudnick, MasterCardAllianz Life Ventures, BNY Mellon, Commerce Ventures, F-Prime Capital,FinTech Collective, Franklin Resources, Goldman Sachs Principal StrategicNotes:Source: CapIq. Pitchbook.Selected deals from last calendar month.13
SELECTED RECENT M&A ACTIVITYDateEnterpriseEV / RevenueEV / EBITDAValue ( MM)LTMLTMSub-Sector4/25/2019 325NANABenefits Administration/Payroll4/24/2019NANANAInformation Services4/20/2019NANANAFinancial SaaS4/18/2019 ANAPayments4/15/2019 82NANAInformation Services4/15/2019NANANAFinancial SaaS4/10/2019NANANAInsurance Technology4/10/2019 170NANABanking & Lending Technology4/9/2019 8508.5xNAInvestment ing e: CapIq. Pitchbook. 451 Group.Selected deals from last calendar month.Target14
PUBLIC COMPANY VALUATIONS( MM, except per share data)StockPriceEquityEnterpriseEPSLong A20E/19E19E19E20E19E20E19E20EIntuit Inc. 251.06 65,043 .7xFidelity National Information Services, Inc. 115.93 37,518 xFirst Data Corporation 25.86 24,405 xFiserv, Inc. 87.24 34,206 xWolters Kluwer N.V. 69.67 18,911 xTemenos AG 166.08 11,519 8x41.1xJack Henry & Associates, Inc. 149.06 11,504 5.5xBlack Knight, Inc. 56.42 8,458 0xCoupa Software Incorporated 103.33 6,337 6,19030%NM36%21%NA17%8%24.4x20.1xNMNMNMNMACI Worldwide, Inc. 35.52 4,139 8xQ2 Holdings, Inc. 75.42 3,327 e Technologies (de), Inc. 50.57 2,060 4xEnova International, Inc. 27.43 924 ndingClub Corporation 3.18 1,381 mpanyRevenue GrowthOperating MetricsEBITDA GrowthEBITDA MarginEV / RevenueTrading MetricsEV / EBITDAPrice / EPSBanking & Lending TechnologyBanking & Lending TechnologyOn Deck Capital, Inc. 5.46 414 x 15.98 985 5xElevate Credit, Inc. 4.48 194 rmant Financial Corporation 1.99 106 %12%29%4.7x4.3x14.8x13.8x24.0x22.6xGreenSky, Inc.MedianBenefits Admin/PayrollBenefits Administration/PayrollAutomatic Data Processing, Inc. 164.39 71,613 .5xPaychex, Inc. 84.31 30,300 1xPaylocity Holding Corporation 96.55 5,109 53.9xInsperity, Inc. 119.56 4,932 .7xTriNet Group, Inc. 62.34 4,363 HealthEquity, Inc. 67.75 4,232 43.6xBenefitfocus, Inc. 40.73 1,325 eWorks, Inc. 48.79 1,944 1,16515%1.43%3%7%6%31%2.3x2.2x7.3x6.9x20.9x19.4x 3.73 537 5%28%4.8x4.5x19.3x17.6x28.4x25.5xCastlight Health, Inc.MedianNotes:Source: CapIq. Pitchbook.Multiples based on CapIq Consensus Estimates. Multiples 0 and 85 considered NM.15
PUBLIC COMPANY VALUATIONS (CONT’D)( MM, except per share data)StockPriceEquityEnterpriseEPSLong Term4/30/19ValueValueGrowthPEGIntuit Inc. 251.06 65,043 64,12316%Workday, Inc. 205.63 46,347 45,77434%SS&C Technologies Holdings, Inc. 67.66 17,096 25,406Paycom Software, Inc. 202.53 11,427 9.45 10,266Coupa Software Incorporated 103.33Xero LimitedCompanyRevenue Growth19E/18A20E/19E2.47%NM26%13%1.4 11,39529% 11,1134% 6,337 6,190 38.32 5,365Paylocity Holding Corporation 96.55Envestnet, Inc.Q2 Holdings, Inc.Operating MetricsEBITDA GrowthEBITDA A 5,609NANM31%27% 5,109 4,97023%3.120% 70.99 3,461 3,63216%2.1 75.42 3,327 3,38220%NMBlucora, Inc. 35.00 1,689 1,80820%0.9Benefitfocus, Inc. 40.73 1,325 1,45620% 1.79 536 479NAEV / Revenue19ETrading MetricsEV / EBITDAPrice / Financial SaaSFinancial SaaSThe Sage Group plcAlfa Financial Software Holdings PLCMedianInformation ServicesInformation ServicesS&P Global Inc. 220.66 54,300 xRELX PLC 22.91 44,627 Moody's Corporation 196.62 37,279 xThomson Reuters Corporation 61.60 30,819 0xExperian plc 28.98 26,115 .2xIHS Markit Ltd. 57.26 22,890 .9xVerisk Analytics, Inc. 141.14 23,100 .7xWolters Kluwer N.V. 69.67 18,911 xMSCI Inc. 225.38 19,082 1.9xNielsen Holdings plc 25.53 9,050 xEquifax Inc. 125.95 15,286 Gartner, Inc. 158.97 14,299 .2xTransUnion 69.65 13,043 3.0xInforma plc 10.15 12,697 4xFactSet Research Systems Inc. 275.87 10,549 5xFair Isaac Corporation 279.75 8,133 xNews Corporation 12.42 7,269 2xCoreLogic, Inc. 40.61 3,277 4.4xLiveRamp Holdings, Inc. 58.33 4,018 omoney Institutional Investor PLC 16.00 1,720 ational Research Corporation 39.58 984 987NANM8%NANANA34%7.6xNM22.3xNM34.1xNMcomScore, Inc. 12.55 760 ter Research, Inc. 50.86 937 nNotes:Source: CapIq. Pitchbook.Multiples based on CapIq Consensus Estimates. Multiples 0 and 85 considered NM.16
PUBLIC COMPANY VALUATIONS (CONT’D)( MM, except per share data)StockPriceEquityEnterpriseEPSLong Term4/30/19ValueValueGrowthPEGVerisk Analytics, Inc. 141.14 23,100 25,81210%3.27%Guidewire Software, Inc. 106.50 8,671 7,90819%NM27%HealthEquity, Inc. 67.75 4,232 3,87124%2.218%Ebix, Inc. 50.48 1,542 2,09915%0.8Benefitfocus, Inc. 40.73 1,325 1,45620%eHealth, Inc. 60.74 1,376 1,268CorVel Corporation 71.80 1,338Sapiens International Corporation N.V. 15.37Crawford & CompanyMajescoCompanyRevenue Growth19E/18A20E/19EOperating MetricsEBITDA GrowthEBITDA MarginEV / 6%15%20%22%22%21%NM9%12%NANM31% 1,242NANM 768 80810% 8.82 473 752 7.80 335 295Trading MetricsEV / EBITDAPrice / %19%17%5.6x5.0x17.5x21.6x22.9x23.9x11.2xInsurance TechnologyInsurance TechnologyMedianInvestment TechnologyInvestment TechnologyThe Bank of New York Mellon Corporation 49.66 47,550 70,61610%1.26%3%NANANA4.3x4.2xNMNM11.7xState Street Corporation 67.66 25,489 32,68812%0.78%5%NANANA2.7x2.6xNMNM9.0x8.3xThe Charles Schwab Corporation 45.78 61,081 SS&C Technologies Holdings, Inc. 67.66 17,096 .1xTD Ameritrade Holding Corporation 52.58 29,093 xNorthern Trust Corporation 98.55 21,452 dridge Financial Solutions, Inc. 118.13 13,665 4xComputershare Limited 12.55 6,813 SEI Investments Company 54.45 8,305 xSimCorp A/S 97.92 3,887 xEnvestnet, Inc. 70.99 3,461 .7xIRESS Limited 10.08 1,736 xBlucora, Inc. 35.00 1,689 xEquiniti Group plc 2.80 1,002 ne Group plc 8.15 1,168 4x 41.29 1,083 8x 1.68 111 1.48%6%14%9%28%4.0x3.6x13.8x12.7x17.2x15.4xFirst Derivatives plcStatPro Group plcMedianNotes:Source: CapIq. Pitchbook.Multiples based on CapIq Consensus Estimates. Multiples 0 and 85 considered NM.17
PUBLIC COMPANY VALUATIONS (CONT’D)( MM, except per share data)StockPriceEquityEnterpriseEPSLong A20E/19E19E19E20E19E20E19E20ECME Group Inc. 178.90 64,017 3.5xIntercontinental Exchange, Inc. 81.35 46,022 xDeutsche Börse Aktiengesellschaft 133.22 24,426 xHong Kong Exchanges and Clearing Limited 34.67 43,510 x28.2xLondon Stock Exchange Group plc 65.31 22,770 .8xNasdaq, Inc. 92.20 15,251 x 8.74 17,865 6x20.6xCboe Global Markets, Inc. 101.61 11,350 .3x21.0xMarketAxess Holdings Inc. 278.33 10,492 x47.4xASX Limited 52.43 10,149 x 5.42 5,798 uronext N.V. 69.41 4,832 MX Group Limited 63.59 3,556 lsas y Mercados Españoles, Sociedad Holding de Mercados 28.32 y Sistemas 2,351Financieros, 5.8x15.4xBursa Malaysia Berhad 1.63 1,317 .1xBolsa Mexicana de Valores, S.A.B. de C.V. 2.06 1,219 JSE Limited 9.68 827 649NANM4%9%7%10%49%4.1x3.8x8.4x7.6x12.9x11.6x 10.87 456 354NANM(7%)1%(14%)2%54%4.1x4.1x7.6x7.5x14.3x14.6x 5.02 303 Revenue GrowthOperating MetricsEBITDA GrowthEBITDA MarginEV / RevenueTrading MetricsEV / EBITDAPrice / EPSLiquidity VenuesLiquidity VenuesB3 S.A. - Brasil, Bolsa, BalcãoSingapore Exchange LimitedGielda Papierów Wartosciowych w Warszawie S.A.Hellenic Exchanges - Athens Stock Exchange SAMedianNotes:Source: CapIq. Pitchbook.Multiples based on CapIq Consensus Estimates. Multiples 0 and 85 considered NM.18
PUBLIC COMPANY VALUATIONS (CONT’D)( MM, except per share data)StockPriceEquityEnterpriseEPSLong A20E/19E19E19E20E19E20E19E20EVisa Inc. 164.43 359,343 .6x25.4xMastercard Incorporated 254.24 259,715 .4x28.4xPayPal Holdings, Inc. 112.77 132,497 x32.1xAmerican Express Company 117.23 97,896 ver Financial Services 81.49 26,484 37,6479%1.07%5%NANANA3.3x3.1xNMNM9.3x8.5xWorldpay, Inc. 117.21 36,449 5x25.3xFirst Data Corporation 25.86 24,405 xSquare, Inc. 72.82 30,797 .5xGlobal Payments Inc. 146.07 23,057 0.8xAdyen N.V. 813.00 24,061 .2xTotal System Services, Inc. 102.24 18,137 xWirecard AG 149.80 18,511 24.2x 1.95 5,286 .3x8.4xGMO Payment Gateway, Inc. 78.75 5,793 2xEVERTEC, Inc. 31.31 2,199 VO Payments, Inc. 29.71 1,944 x 4.36 664 4x 24.14 222 anyRevenue GrowthOperating MetricsEBITDA GrowthEBITDA MarginEV / RevenueTrading MetricsEV / EBITDAPrice / EPSPaymentsNetworksMerchant ProcessingCielo S.A.PaymentsSafeCharge International Group Limitedi3 Verticals, Inc.Prepaid / Closed LoopAlliance Data Systems Corporation 160.10 8,386 2x6.7xFleetCor Technologies, Inc. 260.95 22,405 5xEdenred SA 47.07 11,204 7.5xWEX Inc. 210.30 9,095 20.0xGreen Dot Corporation 63.77 3,389 3xPaySign, Inc. 8.13 380 xNet 1 UEPS Technologies, Inc. 3.57 203 21.5xOther Payments TechnologyThe Sage Group plc 9.45 10,266 e Western Union Company 19.44 8,478 onet Worldwide, Inc. 149.89 7,785 8.4xIngenico Group - GCS 84.21 5,203 6xNCR Corporation 28.95 3,478 dtronics plc 35.76 1,656 4xEveri Holdings Inc. 10.29 731 am International, Inc. 3.31 187 s Information Sys
FINTECH PUBLIC COMPANY VALUATION Financial SaaS outperforms the FinTech market on a revenue growth and EV / ’19E Revenue basis Notes: Source: CapIq. Market data as of 4/30/19. Lines display median multiples across comp groups for given year. EV / Revenue EV / ‘19E Revenue Revenue Gr