Transcription
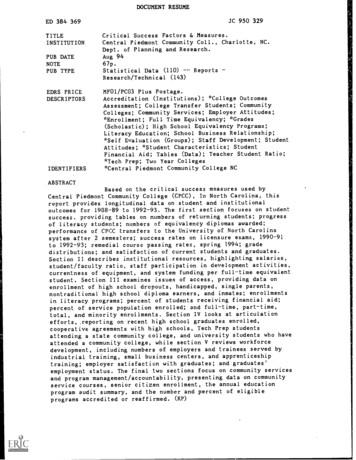
DOCUMENT RESUMEJC 950 329ED 384 369TITLEINSTITUTIONPUB DATENOTEPUB TYPEEDRS PRICEDESCRIPTORSIDENTIFIERSCritical Success Factors & Measures.Central Piedmont Community Coll., Charlotte, NC.Dept. of Planning and Research.Aug 9467p.Statistical Data (110)Research /Technical (143)ReportsMF01/PC03 Plus Postage.Accreditation (Institutions); *College OutcomesAssessment; College Transfer Students; CommunityColleges; Community Services; Employer Attitudes;*Enrollment; Full Time Equivalency; *Grades(Scholastic); High School Equivalency Programs;Literacy Education; School Business Relationship;*Self Evaluation (Groups); Staff Development; StudentAttitudes; *Student Characteristics; StudentFinancial Aid; Tables (Data); Teacher Student Ratio;*Tech Prep; Two Year Colleges*Central Piedmont Community College NCABSTRACTBased on the critical success measures used byCentral Piedmont Community College (CPCC), In North Carolina, thisreport provides longitudinal data on student and institutionaloutcomes for 1938-89 to 1992-93. The first section focuses on studentsuccess, providing tables on numbers of returning students; progressof literacy students; numbers of equivalency diplomas awarded;performance of CPCC transfers to the University of North Carolinasystem after 2 semesters; success rates on licensure exams, 1990-91to 1992-93; remedial course passing rates, spring 1994; gradedistributions; and satisfaction of current students and graduates.Section Il describes institutional resources, highlighting salaries,student/faculty ratio. staff participation in development activities,currentness of equipment, and system funding per full-time equivalentstudent. Section III examines issues of access, providing data onenrollment of high school dropouts, handicapped, single parents,nontraditional high school diploma earners, and inmates; enrollmentsin literacy programs; percent of students receiving financial aid;percent of service population enrolled; and full-time, part-time,total, and minority enrollments. Section IV looks at articulationefforts, .reporting on recent high school graduates enrolled,cooperative agreements with high schools, Tech Prep studentsattending a state community college, and university students who haveattended a community college, while section V reviews workforcedevelopment, including numbers of employers and trainees served byindustrial training, small business centers, and apprenticeshiptraining; employer satisfaction with graduates; and graduates'employment status. The final two sections focus on community servicesand program management/accountability, presenting data on communityservice courses, senior citizen enrollment, the annual educationprogram audit summary, and the number and percent of eligibleprograms accredited or reaffirmed. (KP)
Central PiedmontCommunity CollegeCRITICAL SUCCESSFACTORS MEASURESU.S. DEPARTMENT OF EDUCATIONOffice of Educational Resnarch and ImprovementECUCATIONAL RESOURCES INFORMATIONCENTER (ERIC)'PERMISSION TO REPRODUCE THISMATERIAL HAS BEEN GRANTED BYThis document has been reproduced aseiyed from the person or organization wit-wing )1J. QuinleyC M)nor changes have been made to improve',production qualityPchnts of new or opinions stated in this documerit do not necessarily represent officialOERI pcsibon or po).cyTO THE EDUCATIONAL RESOURCESINFORMATION CENTER (ERIC).'Planning & ResearchAugust 1994BEST COPY AVAILABLEsomenalwanatuor.
Central Piedmont Community CollegeCRITICAL SUCCESS FACTORS AND MEASURES1993-1994TABLE OF CONTENTSPageI:II:STUDENT SUCCESSA.Number of Students Returning from Previous QuartersB.Progress of Literacy Students2C.Number of GEDs and AHSDs Awarded Compared to the Number of DropoutsStatewide3D.Performance of Transfers After Two Semesters5E.Rate of Success on Licensure Exam7F.Program Completion Rates9G.Passing Rates for Remedial Courses9H.Passing Rates for "General Education" and "Related" Courses9I.Grade Distribution (percentage successfully completing)10J.Satisfaction of Current Students with Programs andServices12K.Satisfaction of Graduates with Programs and Services13L.Satisfaction of Graduates with Employment and Transfer Preparation14M.Current Student Opinions of Facilities and Services161RESOURCESA.3.Institutional Salaries as a Percent of the SoutheasternRegional Average18Student/Faculty Ratio20
TABLE OF CONTENTSPageC.Participation in Staff Development Programs: Tier A21D.Currentness of Equipment23E.Percent of Libraries Meeting American College and Research Library(ACRL) Standards for Community, Junior and Technical Colleges23System Funding/F 1h24Enrollment of High School Dropouts, Handicapped, Single Parents,Nontraditional High School Diploma Earners, and Inmates25Number Served by Type Through Literacy Programs and Percent ofTarget Population Served26System Level Enrollments in the Vocational Education Program Students Assisted with Carl Perkins Fund27F.III: ACCESSA.B.B 1.29C.Number of High School Dropouts Who Enrolled in a Literacy ProgramD.Percent of Students Receiving Financial Aid and Amount of Aid Comparedwith Cost of Attendance29E.Percent of Population in Service Area Enrolled30F.Total Unduplicated Enrollments31G.Full-Time and Part-Time Students By Curriculum Program33H.Minority Enrollment35. . .IV: EDUCATION CONTINUUMA.Number and Percent of Recent High School Graduates Enrolled inCommunity College Programs437
TABLE OF CONTENTSPage37B.Number of and Enrollment in Cooperative Agreements with High SchoolsC.Percent of Tech Prep Students Enrolling in a Community College38D.Number and Percent of Students in the UNC System Who Attended aCommunity College38. .V: WORKFORCE DEVELOPMENTNumber of Employers and Trainees Served by: New and Expanding Industry,Focused Industrial Training, Small Business Centers, andApprenticeship Programs40B.Number of Workplace Literacy Sites & Number of Students Being Served42C.Employer Satisfaction with Graduates42D.Employer Status of Graduates44A.VI: COMMUNITY SERVICESNumber of Courses Offered and Students Enrolled Through CommunityServices45B.Enrollment of Senior Citizens45C.Support of Community Services47A.VII: PROGRAM MANAGEMENT/ACCOUNTABILITYAnnual Educational Program Audit Summary - Number Audited and Percent ofSystem Instructional Budget Cited for Exception49B.Number and Percent of Programs Reviewed49C.Number and Percent of Eligible Programs Accredited or Reaffirmed51A.
aIPaII. .:0111soO.S.111 I .,011.00Oa.1O
2Progress of literacy studentsB.PERCENT OF LITERACY STUDENTS WHO PROGRESSTO ANOTHER LEVEL OF LITERACYYearExit NonCompletersProgressingSame LevelExitCompletersAdvancedNext 991-921992-93412425232611458In 1992/93 more students were served at CPCC particularly in LEP (Limited English Proficiency). Alsothere were more workplace literacy sites. 1993/94 numbers not available until mid-September.Source: Annual Literacy Report, DCC1994 Critical Success Factors for the North Carolina Community College SystemPERCENT OF LITERACY STUDENTS WHO PROGRESS TO ANOTHER LEVEL OF LITERACYEXIT NON-COMPLETERSPROGRESSING SAME LEVEL90%50%40%20%0%FMCPCCMSTATEEXIT COMPLETERS10%5%0%91-921 SCPCC EISTATESTDEADVANCED NEXT 3
3NUMBER OF STUDENTS WITH GED OR AHSD ENROLLED IN ACURRICULUM PROGRAM OR IN OCCUPATIONAL EXTENSIONOccupational ar18,2191994 Critical Success Factors for the North Carolina Community College SystemCPCC Annual Literacy Report, Jahn WickerNumber of GEDs and AHSDs awarded compared to the number of dropouts statewideNUMBER OF GEDs AND AHSDs AWARDED COMPARED TO THENUMBER OF DROPOUTS ,639GED/AHS 2Increase InDropout Pool6,5079,9077,9872,811(593)1,127NUMBER OF GEDs AND AHSDs AWARDED COMPARED TO THENUMBER OF DROPOUTS IN -911991-921992-93Source:Charlotte MeekDropout Pool1,5271,4231,8961,7: 91,6311,794GED/AHS DiplomasAwardedN/A657636917890724Increase InDropout PoolN/A7661,2608227411,0701994 Critical Success Factors for the North Carolina Community College SystemCharlotte Mecklenburg Schools, Research Dept.Director of Adult High School, CPCCN/A - - Figures not available
1.I111.Ira. .41LT.:Ps'4I tiaZIONFai e; gr.:0, 'm.1ZUsZZ: III. .7iggrA412 ?n'WONAMEIff:WEgg.VAMMOryWMgtgaia.;;;:111 1i i.1.I1II.s,1I. .--" r.waw ,,nmaxamm;IPAIW#MIPPNEMMMEMs a0 .E'R,?,,17,.Ral,a.Z.Uzi.ti'Sst a4;1" .". s1:is ::::
D.Performance of transfers after two semesters5CPCC TRANSFERS TO UNC 911991-921992-93Good Probation SuspendedStanding66.4%79.9%84.9%70.9%74.0%With L COMMUNITY COLLEGE TRANSFERS TO UNC 0.6%75.5%80.0%Probation SuspendedWith C TRANSFERS TO UNC SYSTEM vs. ALL COMMUNITY COLLEGE TRANSFERS TO UNCSYSTEMGOOD %30%40%1111 CPCC50%60%G STATE170%60%90%100%
6FALL AND END OF YEAR GPAEnd of Year GPAFall GPAYearCPCCAll Com .502.612.602.612.61All Com. Col.Transfers2.562.592.572.612.611994 Critical Success Factors for the Nczth Carolina Community College SystemCPCC Transfers to UNC Institutions, 1992-93FALL AND END OF YEAR GPAEND OF YEAR GPAFALL 921991-921992-931992-9301234CPCC CIALL COMMUNITY COLLEGE TRANSFERS012DI.ICPCC FALL COMMUNITY COLLEGE34TRANSFEll
7E.Rate of success on licensure examsNUMBER PASSING AND PASSING RATE IN LICENSURE EXAMS1990-91CPCCNumberPractical NursingDental AssistingMedical RecordsDental HygieneRegistered NursePhysical TherapyIns. Fire & Cas.Ins. Life, Acc., Elea.Real Estate SalesReal Estate BrokerSource:Passing STATERate 51976666862781992 Critical Success Factors for the North Carolina Community College SystemNUMBER PASSING AND PASSING RATE IN LICENSURE EXAMS1991-92CPCC Passing STATE PassingRateRate NumberNumberPractical NursingDental AssistingMedical RecordsDental HygieneRegistered NursePhysical Therapy1414Ins. Fir & Cas.7488259Ins. Life, Ace., Hea.Real Estate SalesReal Estate 1,511745364041,498251878010091949552676666CPCC Program DirectorsMedical Assisting takes American Association of Medical Assistingcertification exam National average passing is about 70%Source: 1993 Critical Success FactorsNUMBER PASSING AND PASSING RATE IN LICENSURE EXAMS1992-93CPCCNumberPractical NursingDental AssistingMedical RecordsDental HygieneRegistered NursePhysical TherapyIns. Fire & Cas.Ins. Life, Ace., Hea.Real Estate SalesReal Estate BrokerSource:Passing STATERate 1994 Critical Success Factors3741,2882276566
8NUMBER PASSING AND PASSINC RATE IN LICENSURE EXAMS1990-91PRACTICAL NURSINGDENTAL ASSISTINGMEDICAL RECORDSDENTAL HYGIENEREGISTERED NURSEPHYSICAL THERAPYINS. FIRE & CASw aINS. LIFE, ACC HEREAL ESTATE SALESREAL ESTATE %100%120%60%80%100%120%WPM799142PRACTICAL NURSINGDENTAL ASSISTINGMEDICAL RECORDSDENTAL HYGIENEREGISTERED NURSEPHYSICAL THERAP"INS. FIRE & CAS.INS. LIFE, ACC , HEAREAL ESTATE SALESREAL ESTATE BROKER0%20%40%C:SE1992-93PRACTICAL NURSINGDENTAL ASSISTINGMEDICAL RECORDSDENTAL. HYGIENEREGISTERED NURSEA100%PHYSICAL THERAPY100%INS. FIRE & CASINS. LIFE, ACC , HEAREAL ESTATE SALESREAL ESTATE BROKER0%20%40%COAX60%IRATE80%100%120%
9F.Program completion ratesMeasurement procedure definitions for this item have not been developed by the Departmentof Community Colleges.G.Passing rates for remedial classes Spring 1994Passing Rates for Remedial ClassesCPCCClassRDN 9502RDN 9505RDN 9510RDN 9312ENG 9500ENG 9505ENG 9510MAT 9500MAT 9501MAT 9502MAT 9510MAT 9511No. Sec. 30% Enroll. Completed % 392054726341141249.185.7BIO 950014250.0CHM 95006462758.71212Source: ST909545 (8/8/94).H.Passing rates for "General Education" and "Related" coursesCurrently this item definition to compute passing rates for General Educationand "related courses is being developed.
10I.Grade distribution (percentage successfully completing)CPCCGRADE 4796,86328.6 10,57420.7 allNo.29.5 10,55920.8 allNo.199330.8 11,29421.9 7,47225.116.64,58146310.21.02550.6310.166.9 72.234.5%0.8Total Successful20,56164.7 21,14263.9 *1,221ER64.3 22,70567.5 4563.34.11,0293.11,1979963.09928.5I1,021WDFTotal Unsuccessful11,23735.3 11,96636.112,80935.7 10,94832.5 11,90433.0 12,67835,88133,65336,03336,774Total Grades31,79833,108* Key: 1M - Incomplete, able to make upIR - Incomplete, need to repeatI - IncompleteW - WithdrawD - PoorF - FailingSource:CPCC report ST561010 Fall 1988-89/1993-94Grade Distribution by Responsibility Center
11CPCC GRADE COMPARISONTOTAL20,f61FALL 19883.4.'§;,,.2.geraiLakillatfl11,23721,142FALL 1989-.14.1t1Witirl CV11.96623,072FALL 1990.'.FALL 1991.,,FALL 1992A11.984FALL 19930/01AL SLAXESSFU.25.00020,00015,000101005.000IOTAL UNSUCCESSFU.PERCENT64.7%FALL 1988619%FALL 190964.3%gatt . .FALL MO.67.5%FALL 1991W5MWO4WW0200011;7106.9%FALL 199273 1/6635%FALL 199334 5%0%20%83%00%Ii TOTAL SLCCESSFUL Ci TOTAL UNSUCC.ESSFU I60l430.000
121.Satisfaction of current students with programs and servicesOVERALL or BelowAverageGroup895.7%292.3%Student Evaluation of Services, June 1991Instructional Lab Survey, Feb. 1992AboveAverage ExcellentTotal22714.5%45479329.0% 50.7%1,56317544358035.8% 46.9%1,23614.2%41-.SERVICE DETAIL BY DEPARTMENT AREA*.Departme.ntAcademic Student TutoringWelcome CenterSpecial.Ser./SituationCareer Experience CenterMulti-SkillsSpecial Ser./DisabilitiesFreedomMatthewsTalent SearchBookstoreFinancial ServicesSecurity/ParkingSource:Total Meani.IDepartmenf.4.831361860.Counseling4.6 ; .:,c .:Admiss:/Records4.5 :WeteratifrAffairs4.4.Testing & 4.1Career PlacementHuntersvilleLibrarySnack ShackPineville4.03.73.4Student LifeRegistration74Fininci# tudent Evaluation of Services, June 1991 .LAB DETAIL BY DEPARTMENT AREADepartmentEng. Adv. Tech. 1Behay. & Soc. ScienceHealth, PE, & 24.24.2Technical Careers 2Eng. & Foreign LangHuman ServicesAccounting27649784.14.1ComputerEng. Adv. Tech. 2611164Health TechnologyBusiness AdministrationTechnical Careers 1Source:* Note:Instructional Lab Survey, Feb 1992Means are based on 5 point scale1 poor to 5 excellent4.6
K.13Satisfaction of graduates with programs and servicesSATISFACTION OF GRADUATES WITH SERVICESNot or fiedCollege in General2.9%6.7%48.6%41.8%Quality of InstructionClassroom FacilitiesLab/Shop Fac. & Equip.Course .6%38.9%43.9%38.9%42.5%32.2%24.1%11.6%Course Content in MajorCourse Content in GeneralAdmissionsPlacement Testing &Testing unselingRegistrationAcademic Advising by 9%28.9%33.7%28.0%24.5%27.5%27.1%34.2%Services for Studentswith DisabilitiesFinancial AidAcademic TutoringCampus 7%34.7%31.3%35.3%21.2%19.9%15.0%Career Planning/PlacementBusiness Office/CashierParkingFood 41.5%43.5%BookstoreQuality of LibrarianAssistanceLibrary FacilitiesLibrary MaterialsSource:1.1%Graduate Follow Up Study, 1994Number responding 500
14LSatisfaction of graduates with employment and transfer preparationSATISFACTION WITH JOBItemNot/Little Satisfied Somewhat SatisfiedFreq.%Freq.%Job in generalWorldng conditionsAmt of responsibilityAdvancement PotentialSalarySatisfiedFreq.%Very N WITH PREPARATION FOR EMPLOYMENTItemNot/Little Smisfied Somewhat SatisfiedFreq.%Freq.%Total CollegeCareer StudentCollege Transfer28247.78.545.1684820SatisfiedFreq.Very 2732.331.83SATISFACTION WITH PREPARATION FOR TRANSFERItemNot/Little Satisfied Somewhat SatisfiedFreq.%%Freq.Total CollegeCareer StudentCollege TransferSource:157.9378i 3.31019.416.775.32720.6Graduate Follow-Up Study, 1994SatisfiedFreq.%77294840.348.336.6Very SatisfiedFreq.62134932.521.737.4
15SATISFACTION OF GRADUATES WITH EMPLOYMENT AND TRANSFER PREPARATIONSATISFACTION WITH JOB37.0%JOB IN GENERALri./.1Z.e.,({,(7/././4/ IL. 70.,WORKING CONDMONS\ .5ivasiymewer.665,smeNwmuce.65.3.55AMTJ RESPONSIBILITYADV. POTENTIALammilmowamomeSSALARY60%10%0%VERY SATISFIED ria SATISFIED 0 SOMEWHAT SATISFIED 0 NOT/LITTLE SATISFIEDSATISFACTION WITH PREPARATION FOR EMPLOYMENTTOTAL COLLEGECAREER STUDENTCOLLEGE TRANSFER.Av.50%40%30%20%10%0%SATISFIED 0 SOMEWHAT SATISFIED 0 NOT/UTTLE SATISFIEDVERY SATISFIEDISATISFACTION WITH PREPARATION FOR TRANSFER.,.,.:,.32.5%e.TOTAL COLLEGE.-.ft.i.,.x:.--;;Atezw:::.z.:.4140.3%19.4%. ,1 21 7%.CAREER STUDENT., .:., 1.:70 7.4.47c.' .7s7WNLIT.7.V,?.Y.,',W.1 41.3%{*:57 k4-I'irAI37.4%COLLEGE TRANSFER.;.,::-.11,.;,.47";',Wv,!:121 .4.AN.,i;.ZAI,.- : . ; . .::,., . . 120 6%36.6%5.3%0%VERY SATISFIED10%30%20%40%SATISFIED 0 SOMEWHAT SATISFIED El NOT/LITTLE SATISFIED2160%50%I
16M.Current student opinions of facilities and servicesSTUDENT RATINGS OF SERVICES*CURRENT STUDENT SURVEYCampus facilities and servicesLibraryQuality of instruction of full-time facultyAccessibility of resource materia13Quality of instruction by part-time facultyStudy and reading areasHelpfulness of staffReading, Writing, language skills programsMath skills improvement programsClassroom facilitiesLab facilitiesHelpfulness of administratorsAccuracy of information before enrollingCourse availabilityIndustrial arts/shop 3.613.563.503.443.31SELECTED SERVICESType of ServiceTalking with instructors about my performanceRegistrationBookstoreAdmissionsEarly performance. reportPlacement testing and testing centerWelcomermformation centerAcademic advising by facultyCounselingRecords/transcriptsBusiness office/CashierJob placement assistanceServices for students with disabilitiesFinancial aidCoop servicesDrop-in centerOrientation programVeterans 263.193.093.08.3.002.952.842.fz32.41
17SELECTED STUDENT ORIENTED AMENITY FACTORSMeanFactorsAttractiveness of campusOverall image of CPCCPersonal security/safetyStudent center, lounge areaCampus life (activities)College newspaper (The Spark)Eating facilitiesStudent governmentStudent parking facilitiesStudent parking 54SOCIAL ENVIRONMENTAL FACTORSSocial Environmental FactorsRace relations climatePresence of other people like meMinority presence(students,faculty,staff)Age of students in my classesSex of students in my classesSocial class of students in my classesAcademic ability of students in my classJobs held by the students in my classesSource: Current Student Survey, Spring 1993* Note: Means are based on 5 point scale1 poor to 5 excellentMean3.423.643.463.693.783.563.553.53
II'Ia.IIDI.II::,1I111.,:aIIve.ssee.,1 .4::iawaCwwaa,- V WA7.S. CC4.s- }V/;IM'.x.r,2D,W1Dw"*72."3,W, "''",xr.w.sza;,k2;l'eM SZS.W.N.4:4a.:,?&',aadSak:AZIIfWralar44.18 MMEM720.E.2 1:747 13,4,--,.Z -;01:,-45A WI,"S1 IIII 111mea:I1aAI
19NORTH CAROLINA COMMUNITY COLLEGE MEDIAN ADMINISTRATIVESALARIES COMPARED WITH NATIONAL MEDIANSEmployee CategoryExecutivePresidentExec. V. Pres.AcademicDean of InstructionDean of Cont. EducationInstitutional 811265% of% ofCUPA138AdministrativeChief Business OfficialComputer Systems Admin.Personnel Officer6659External AffairsInstitutional Dev. OfficerPublic Information Officer124Student ServicesDean of StudentsCounselorFinancial Aid OfficerRegistrar/Admissions10184Source: CUPA (College and University Personnel Association) in 1994 Critical Success Factors for the NorthCarolina Community College SystemCPCC Personnel OfficeN/A - - Figures not applicable
20RStudent/faculty ratioSTUDENT FTE/INSTRUCTIONAL FTE RATIOBY DEPARTMENT FALL -921992-931993-94Acct. & Pub. .80.421.40.6-0.1AdvancementStudies27.3Behay. & Soc. Sci.31.2Bus. Admin.Comp. & Info. Sys.28.31.026.522.835.01.5-0.2-1.6Engl. & For.Language19.7ns4., Phys. Ed.,& Rec.18.719.00.321.22.321.60.422.30.722.0-0.3Health 426.42.725.5-0.923.4-2.121.9-1.5Hospital Ed.14.71.1Human Services20.817.0-3.8Technical .12.230.40.327.4-3.025.6-1.8Eng. & .8Vis. & Perf o figures available from StateSource:Productivity Profiles from Fall Quarters 1988-1993
CParticipation in Staff Development programs: Tier A21STAFF DEVELOPMENT ACTIVITIESNo. ofReturn to IndustryFaculty 88-8989-9090-9191-9292-9393-946531,1851,108TLC Work Shops 50,022.8011 10,664.8742 25,390.2189 31,629.83110 37,513.0697 27,495.9971 AN/AN/ANo. ofNo. ofActivities participantsTotal Cost8 5,961.0788-8989-9090-9191-9292-9393-94Work ShopsTotal Cost55 37,905.9720 22,424.9826 17,887.62220 28,281.1036 4TLC Lab hrs.No. ofhrs. participantsYear81517 11,392.3010182121 16,999.531126 14,953.4348 3-9434485445 /AN/AN/AN/A429461CPCC Staff Development OfficeSource:PERCENT OF TIER A FUNDS EXPENDED FORFULL AND PART-TIME FACULTY & STAFFPercent of Funds ExpendedNT I AV;1\ 1 r. %82.94%94.58%93.88%N/ACPCCN/A1001001001002
02004006008001,0001,2001,400FOUNDATIONU 1991-92 0 1992-93TLC LAB HRS.1990-91RETURN TO INDUSTRY FACULTY UPGRADENUMBER OF PARTICIPANTSWORKSHOPS1993-94STAFF DEVELOPMENT ACTIVITIESTLCWORK SHOPSJ
23D.Currentness of equipment0-5 yrs.6-10 yrs.10 yrs.CPCCFY 91StateCPCCFY 92StateCPCCFY 93StateCPCCFY 5%25%37%38%49%28%23%24%35%41%The percentages for CPCC FY 94 have changed drastically, because the threshold forcapital equipment rose from two-hundred and fifty dollars to five-hundred dollars onJuly 1, 1993. Inventory Control was allowed to drop items below five-hundreddollars from their inventory. Many items were six or more years old, which accountsfor the changes reflected above.Source: Irene Hammond, Inventory Control CPCCSource: Equipment Data base, DCCNote:E.Percent of libraries meeting American College and Research Library (ACRL) standards forCommunity, Junior and Technical Colleges.COMPARISON OF ACRL STANDARDS AND CPCCLibraryPeriodicalsBookSubCollect scriptions Total AVMin. (FTE)Excel (FTE)CPCC (91/92)CPCC (92'93)CPCC 736,79927.62919038N/AEquip. perSq. Ft.87,000N/A75,08775,0871994 Critical Success Factors for the North Carolina Community College SystemDirector of Library Services - CPCCN/A - - Figures Not Available
24LEARNING RESOURCE CENTERS:COMPLIANCE WITH ACRL STANDARDSSTATE WIDE COMPARISONSMeasureBelowStandardNo.%if of Book TitlesSerial Sub.Expenditure perFTE, less Sal.Library StaffSquare el%No.1517ExcellentLevelNo. A262921712121200000000Planning and Research Unit, DCCIPEDS, Academic Libraries Survey, 1993System funding/FTEAVERAGE COST PER FTE FOR THE NORTH CAROLINACOMMUNITY COLLEGE SYSTEMAverage ,073.153,144.022,900.963,300.47N/AAnnual Financial Report in 1994 Critical Success Factors for the North Carolina CommunityCollege SystemCPCC Business & College ServicesN/A - - Figures not availableAVERAGE COST PER FTE FOR THE NORTH CAROLINA COMMUNITY COLLEGE SYSTEM1987-88. . .1988-89vi: .2,732.47. . . . . 00.472,657.661993-9401,0002,000CPCC n STATE3,000314,000
25III.ACCESSA.Enrollments of high school dropouts; handicapped; single parents; nontraditional high schooldiploma earners; inmates.ENROLLMENTS IN THE LITERACY PROGRAMYearCPCCSTATEHigh School ,48723,03519,14912,232Mentally Retard. 4454327,8058,3918,1479,3366,394Pub. Assistance 2612,585Annual Literacy Data Report (CPCC)1994 Annual Performance Report for Literacy Program (State)N/A - - Figures Not Available
26Number served by type through literary programs and percent of target population served.STATEADULT LITERACY PROGRAM ENROLLMENTS BY TYPE% ofABEYearAHSPTotalTarget Pop.87,03396,6808,731 109,4158,436 120,0438,137 1;Annual Statistical RePOrt, 1992-93 in the 1994 Critical Success Factors for the North CarolinaCommunity College SystemSource:CPCCADULT LITERACY PROGRAM ENROLLMENTSBY ,6443,2092,2862,2082,2942,1271,871,GEDTotalTarget 7.77.9.Source:% ofCED781361.CPCC Annual Literacy Report, in the 1994 Critical Success Factors for the North CarolinaCommunity College SystemADULT LITERACY PROGRAM ENROLLMENTS BY TYPECPCCSTATEABEABE ttsmmmmmmmmmmmmmmmmmmmmVM17/1" WM,M.fZAWLIVIMAAHSP. AMIggareiRIMAINS-.41g-Cr.if1XTSWW.i.CRX AAAOM.11 1; finiNMIGEDWWWW!GED%)/Z/Z/VIZA 100 000L11987- 8811988 -89 1989 -90 ER 1990-91 G 1991-92 Era 1992-9301,0002,0003,0001989-90 1 1990-91 0 1991-92 U 1 9 9 2 - 9 3
27BI.SYSTEM LEVEL ENROLLMENTS IN THE VOCATIONAL EDUCATIONPROGRAM - STUDENTS ASSISTED WITH CARL PERKINS 4,35642,29359,87648,77232,74539,710Limited English rrections.Note:Source:1,821CPCC data from State has been requested, but may not be available.1994 Critical Success Factors for the North Carolina Community College System
"'55, ,5555.555:555.%/"'4!XXVZ.ErKEZU En:K.1'MbI-'4''' 5 2.271.1142121223,7212M .5-.M5-! ;'"212111111I:, 55 '' ' ' c,5,5-' 5 ,,, , ,, ,,,,, ,,,,, ,,,,
29C.
Central Piedmont Community College. CRITICAL SUCCESS FACTORS AND MEASURES. 1993-1994. TABLE OF CONTENTS. I: STUDENT SUCCESS. Page A. Number of Students Returning from Previous Quarters. 1. B. Progress of Literacy Students 2 C. Number of GEDs and AHSDs Awarded Compared to the Number of Dropouts Statewide. 3. D. Performance of Transfers After Two .
