Transcription
CLP HoldingsInvestor PresentationIntroductory PackAugust 2021Information Classification: Confidential/Proprietary1
DisclaimerPotential investors, analysts and shareholders of CLP Holdings Limited (the Company) and other recipients of this document are remindedthat this document and any oral discussion made together with this document (the presentation) are provided for your informationpurposes only and you may not forward, publish, distribute, release or disseminate any part of the presentation directly or indirectly toany other person.It is important to note that the contents of the presentation have not been audited or independently verified. Maps included in thepresentation are indicative only. They are provided for the purpose of showing the approximate location of the Company's assets, and donot purport to show the official political borders between different countries. Some comments, including comments relating to futureevents and our expectations about the performance of CLP's business, are based on a number of factors that we cannot accuratelypredict or control. We do not make, and expressly disclaim, any representations and warranties in respect of any matters contained in thepresentation. We cannot provide any assurance that the information contained in the presentation is or will be accurate or complete andso they should not be relied on. We assume no liability whatsoever for any loss howsoever arising from use of, or in connection with, anyof the information and data contained in this presentation. From time to time as circumstances change we may update our website atwww.clpgroup.com and will update the Hong Kong Stock Exchange when relevant to comply with our continuous disclosure obligations.This presentation is not, and is not intended to be, for publication, distribution, release or dissemination, directly or indirectly, in or intoany other jurisdiction which to do so would be restricted, unlawful or a breach of a legal or regulatory requirement.This presentation does not constitute a public offer for the purposes of any applicable law or an offer to sell or solicitation of any offer topurchase any securities or other financial instruments or any recommendation in respect of such securities or instruments.By attending or reading this presentation, you will be deemed to have agreed to the terms, obligations and restrictions set out herein.2
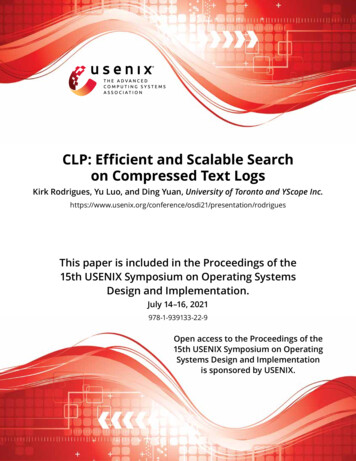
Building the Utility of the Future CLP provides sustainable energy solutions to create value for shareholders, customers, employees andthe wider community. We aim to be the leading responsible energy provider in the Asia-Pacific region,from one generation to the next. Climate Vision 2050 outlines our commitment to decarbonisation, digital transformation and pursuitof new business models as we address the energy transition. Together with customer centric solutionsand workforce transformation, this guides our journey to becoming the Utility of the Future.Dividend per share (HK )Q12.62Q22.70Q3Q42.802.913.02Non-carbon EmittingGeneration Capacity# (GW)Total Returns .21/12/20132014 2015 2016 2017 2018 2019 2/20181/12/20192014 2015 2016 2017 2018 2019 20201/12/20202007* Base : 31 December 2013 0%# As end of each year; Equity basis plus long-term capacity and energy purchase arrangements201320203
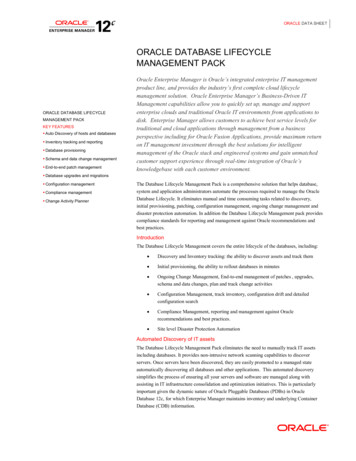
Assets diversified by geography, activities and technologyRevenue in 2020Market CapitalisationHK 80bnOver HK 181bn(about US 10bn)( US 23bn as at 31 Dec 20)Over 5.1 millioncustomer accountsMAINLANDCHINAP.312.7 million2.4 millionin Hong Kongin AustraliaOver 16,500 km transmission linesCoal 48%; 12,027 MWINDIAP.39HONG KONGP.23Hydro 2%; 489 MWRetailTransmission & DistributionSE ASIA &TAIWANP.41SolarWindHydroSolar 3%; 793 MWNatural GasCoalWaste to EnergyAUSTRALIAP.35Gas InfrastructureOthers e.g. oilFor moreinformation on thediversified assetsGas 23%; 5,817 MWmore than24,900 MW#NuclearEnergy StorageGeneration andStorage capacityNuclear 11%; 2,685 MWRenewables14%; 3,418 MWWind 9%; 2,125 MWFor more informationon CLP at a Glance# Equity basis plus long-term capacity and energy purchase arrangements.Includes battery discharge capacityOthers e.g. landfill, oil,energy storage 4%; 965 MWAs at 30 Jun 2021 4
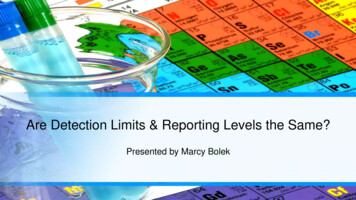
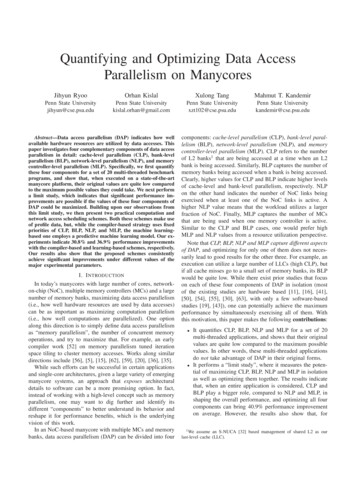
Business Units – Capabilities along the Value Chain2020Hong KongOperating earnings:Total Assets:HK 8,088mHK 138.5bnGTDRSOperating Earnings by Business UnitsHK m16,00014,00012,00010,0008,000HK 2,233mGHK 34.4bnTMainland ChinaDRS6,0004,000SEA & Taiwan2,000India--2,000HK 1,690mAustraliaG2014HK 40.6bnTDRS201520162017201820192020Mainland ChinaTotal Assets by Business UnitsHK bnHong Kong250Unallocated200HK 175mIndiaGAustraliaHK 14.5bnTDR150S100HK 386mSoutheast Asia& TaiwanGHK 2.3bnTD50RS2014Current operations2015Potential opportunities2016G: Generation2017T: Transmission20182019D: Distribution2020R: RetailS: Smart Energy Services5
Dividend# History and Shareholding by CategoryCLP’s Dividend Policy aims to provide reliable and consistent ordinary dividends with steady growth when supported by our earnings whilst ensuring that a solid financialposition can be maintained to fund our business growth. In line with our established practice, our ordinary dividends are paid four times a year in each of the quarters.CLP Dividend# 1990 – 1H 2021HK Shareholding by Category3.5033%3.0035%2.802.62 2.70As at 31 Dec 20202.912.501.00 1.0532%2.00Interests associated with Kadoorie FamilyInstitutional InvestorsRetail investors1.501.091.140.590.54 0.55 0.571.000.54 0.55 0.57 0.593.023.08 3.101.19 1.19 1.210.61 0.63 0.630.61 0.63 0.63 0.630.500.54 0.55 0.57 0.59 0.61 0.63 0.63 0.63-Q1Q2Q3Final/ Q4Special Source: BloombergFor more information:# Dividend adjusted for one bonus share issued for every five existing shares in 1993 and 2001 Special dividends include special cash dividends and one additional interim dividend due to change of accounting year in 19996
Capital investments and dividend supported by cash flowCash FlowHK bn2520Capital InvestmentsCash from divestmentFree Cash Flow21.51.4-4%20.60.215558.8002019Net DebtNet Debt/Total CapitalHK 00%31 Dec 201931 Dec 7.82019202002020Operating Return on Equity *60%5011.920192020HK ceAcquisitions2015ThousandsSoCOthersHK bn25Dividend paidCredit Ratings#S&PMoody’sCLP HoldingsAStableA2StableCLP PowerHong KongA BBB Stable 0.2%10.4%201910.6%2020* Operating Earnings/Average Shareholders’ fund# As at Jun 20217
Financial SummaryFree Cash Flows30HK bnDividend per shareDividend pay-out %Capital InvestmentCash from divestmentFree Cash Flow302525202015151010550-HK bnSoC capexGrowthAcquisitionsMaintenanceOthers02014 2015 2016 2017 2018 2019 20202014 2015 2016 2017 2018 2019 2020Net DebtNet Debt/Total Capital (%)HK bn806020%2010%0-0%2014 2015 2016 2017 2018 2019 %10%0%Credit Rating History(by S&P)830%40HK HK 4.03.53.02.52.01.51.00.50.02014 2015 2016 2017 2018 2019 2020Operating ReturnOn Equity (%)40%*7A /A16A/A2CAPCOCLP PowerCLP Holdings5A-/A34BBB /Baa1EnergyAustralia3BBB/Baa22BBB-/Baaa312014 2015 2016 2017 2018 2019 2020* Based on Operating 201620172018201920201H218
Accelerating the decarbonisation journey in Hong KongTowards Carbon Neutralby 2050Simulated D2Simulated D1SolarFeed-inTariffConstruction of D1 & D2 CCGTsOffshoreWindNewTransmissionClean Energy Transmission mulated photoConstruction of the Offshore LNG terminalPotential Offshore Wind Farm9
Australia – intense competition and volatile pricesChurn below Market AverageSupply & Demand Tightening5550210452054020035195Wind, Solar & Other (LHS)Hydro (LHS)Gas (LHS)Coal (LHS)Operational Demand (RHS)3025200190185AustraliaEnergy (Wholesale)Customer (Retail)Customer Account (million)Customer Churn21518002007 2008 2009 2010 2011 2012 2013 2014 2015 2016 2017 2018 2019 2020 2021Source: Data from AEMO’s Electricity Market Management System (EMMS)100%Improving EfficiencyPaper BillE-Bill120100SWAP Price /MWh80%60%40%VICDrought80Carbon scheme604020%200%01H2015 1H2016 1H2017 1H2018 1H2019 1H2020 1H2021Year Ahead Swap PricesNSWClosure of Hazelwood powerstation announced2007 2008 2009 2010 2011 2012 2013 2014 2015 2016 2017 2018 2019 2020 2021Source: Australian Securities ExchangeUpdate for 2021 Interim10
VisionCLP’s vision is to be the leading responsible energy provider inthe Asia-Pacific region, from one generation to the next.MissionMissionValues andCommitmentsAppendix 1:Environment,Social & GovernanceIn a changing world, CLP’s mission is to provide sustainableenergy solutions to create value for shareholders, customers,employees and the wider community.Our values guide us in fulfilling our mission and turning CLP’svision into reality. Our commitments are the promises that wemake to our stakeholders about the way in which we willuphold our values.CommitmentsPolicies and CodesCLP’s policies and codes aid in the articulation and incorporationof our values and commitments into our everyday operationsPolicies& Codesand practices.CLP’s Value FrameworkFor more information
CLP’s Sustainability Principles Sustainability has always been integral to CLP. Our Value Framework reflects the moral compass of CLP,articulating our values, vision, mission and commitments. In 2020, CLP’s Value Framework was updated to fullyintegrate the Sustainability Principles into its values andcommitments, and to underscore the integral role ofsustainability in CLP’s long-term development. CLP’s prioritised four of the 17 Sustainable DevelopmentGoals (SDGs) that we consider as the most relevant to ourbusiness and where we are expected to make the biggestimpact. They are aligned with our strategic priorities.For more information on:Standard ESG Disclosure12
Building a ‘Utility of the Future’13
Responding to climate change14
Harnessing the power of technology15
Reinforcing cyber resilience and data protection16
Building an agile, inclusive and sustainable workforce17
Our People – Senior Leadership Team*Nicolas Alain Marie TissotChief Financial Officer 1(From 1 April 2021)From the right:Geert Herman August PeetersExecutive Director & Chief Financial Officer 1(to 31 March 2021)Yuen So Siu Mai BettyGroup Director & Vice Chairman – CLP Power Hong KongDavid Christopher SmalesChief Operating OfficerChong Wai Yan QuinceChief Corporate Development OfficerDavid John SimmondsGroup General Counsel & Chief Administrative Officer, Company SecretaryEileen Burnett-KantChief Human Resources Officer* As per 2020 Annual ReportFrom the left:Richard Kendall LancasterChief Executive OfficerChiang Tung KeungManaging Director – CLP Power Hong KongCatherine Leigh TannaManaging Director – EnergyAustralia 2(to 30 June 2021)Mark Richard ColletteManaging Director –EnergyAustralia 2(From 1 July 2021)Chan Siu HungManaging Director – ChinaRajiv Ranjan Mishra1Appointment of Mr Tissot as Chief Financial Officer effective 1 April 2021Managing Director – India2Appointment of Mr Collette as Managing Director – EnergyAustraliaeffective 1 July 2021Full particulars of SeniorManagement are available on :18
Climate Vision 2050Our past and projected carbon intensity2020 Target achieved at 0.57kg CO2/kwh. Our projected carbon intensity isin line with our 2020 business plan & long-term decarbonisation strategyOur targets will be updated during 2021A review of our carbon intensity targets is being undertaken.Strengthened targets will be announced ahead of COP26kg CO2/kWh1.00201020100.800.90kg CO2/kWh0.80ACHIEVED2020 TARGET0.57kg CO2/kwh202020200.600.70kg CO2/kWh0.60Key Climate Vision 2050 commitments No additional coal-fired power generation Phase out remaining coal-fired assets by 2050 Strengthen our targets at least every 5 years203020300.50kg CO2/kWh0.5020402040Retire CastlePeak A0.400.34kg CO2/kWhActual carbon intensity0.3020502050Projected carbon intensity(with capacity & energy purchase)Science Based Target - well-below 2 C0.200.15RetireYallournkg CO2/kWh0.10Reduced use of Castle Peak BDecarbonisation targets0.00-20072010202020302040Phase out all coal-firedgeneration205019
Our Environment Financial Metrics and Generation by ActivityCLP’s integrated business includes energy retailing, transmission and distribution (T&D) and generationApproximately half of our earnings are contributed by our energy retailing and T&D businessesGeneration and Storage Capacity*Over 50% of our generation portfolio is zero emission or gas-fired100%4%11%90%11%Dec 202080%Coal70%13%14%50% 49%Gas60%Nuclear50%21%Others30%Energy Sent -out*T&D/Retail20%Dec 192020ACOI#20192020Fixed Assets & Interestsin JV/ Associates # Before unallocated expense Included fixed assets, right-of-use assets/ leasehold land and land use rights, investment properties and interest in andloan to JV and Associates* Equity basis plus long-term capacity and energy purchase arrangements. Includes battery discharge capacity20209%48%9%55%14%201920%20
Key Sustainability Ratings & Awards2020 RatingsClimate Change: BAwards & RecognitionsSustainability Report of the Year Gold Award for Sustainability ReportingCompany Score: 77(Electric utilities industry avg: 43)Overall Scores: 3.6Best ESG Materiality Reporting (Large Cap)Best Corporate Governance Awards 2020 Sustainability and Social Responsibility Reporting AwardHKQAA Rating : AABest Annual Reports Awards 2020 - Sustainability Reporting AwardOverall: AAESG Report of the Year, Best in ESG and Best in ReportingOverall rating: 29.9 (Medium Risk)*(Scale of severity 0 - 40 )Ranked 6th among the world’s 100 most sustainably managed companies*Updated on: 15 February 202121
Appendix 2:Business Units BackgroundYangjiang Nuclear Power Station, Guangdong, China
Hong KongGuangzhou PumpedStorage Power StationPetroChina gasfrom SecondWest-East GasPipelineHong KongDaya Bay NuclearPower StationShenzhen - ChinaThe electricity supply in Hong Kong is regulated throughthe Scheme of Control (SoC) Agreement which is acontract signed between CLP and the Government. Thecurrent SoC runs for over 15 years from 1 October 2018to 31 December 2033, with 8% return on average netfixed assets and more frequent Fuel Cost Adjustment.DaChanIslandShekouHong KongBranch LineWest NewTerritories Landfill New TerritoriesWe generate, distribute and provide a world-classelectricity supply with a reliability rate of over 99.999% to2.7 million customers, via over 16,300 km oftransmission and high voltage distribution lines. A multifuel generation portfolio of 8,243 MW in Hong Kongterritory provides power for our customers.Black PointPower StationCNOOCgas fromgas fieldsCastle Peakin the Power StationSouthChinaSeaLantau IslandPenny’s Bay KowloonPower StationVertically Integrated Business 61% of Group Assets 8,243 MW generationcapacity# in HK territoryAs at 30 Jun 2021 Hong Kong Offshore LNG TerminalCoal PowerGas Power132kV CircuitNuclear PowerPumped Storage132kV Submarine CableCLP has a vertically-integrated business in Hong Kong,which is the core of our operation.Diesel Oil400kV CircuitEnergy-from-wasteGas pipelineThe first 5-year Development Plan under the current SoCwas approved in July 2018 requiring expenditure ofHK 52.9 billion over 5.25 years, a 30% increase inannualised expenditure.FSRU/Gas Stationunder constructionFor more information on theScheme of Control Agreement:# includinglong-term capacity and energy purchase arrangements23* map shows indicative locations of assets only; does not purport to show exact locationsUpdate for 2021 Interim23
Generation Portfolio*Hong KongCastle Peak Power Station (4,108/4,108 MW)- Castle Peak A – 1,400 MW, Castle Peak B – 2,708 MW- Coal-fired with gas option- Coal is mainly imported from IndonesiaHong KongBlack Point Power Station (3,825/3,825 MW)- Natural gas-fired- Gas import from South China Sea and Central Asia- New D1 CCGT (550MW) in operation, D2 (600MW) under construction- Offshore LNG storage and offloading system under constructionPenny’s Bay Power Station (300/300 MW)- Diesel-fired- Back-up facilityFor more information onour presence in Hong Kongand other regions:West New Territories Landfill (WENT)(10MW/10MW)- Landfill gas-to-energyPowering over 80% of Hong Kong’s populationGuangdong Daya Bay Nuclear Power Station (1,968/1,577 MW)- Located in Guangdong- Proportion of supply to Hong Kong is 80%MainlandChinaGuangzhou Pumped Storage Power Station (1,200/600 MW)- Located in Guangdong- CLP wholly owns Hong Kong Pumped Storage Development Company (PSDC), which has contractual rights touse 600MW generation capacity* Including long-term capacity and energy purchaseAs at 30 Jun 202124
Annual ElectricitySales and CapexElectricity ,87813,5849,1719,586Infrastructure &Public Services2019Capital Expenditure (Accrual basis)ChangeHK M20202019Hong KongChangeCLP Power %)Total Capex8,8829,097(2.4%)* Including CAPCO’s 70% share in Hong Kong LNG Terminal LimitedManufacturingTotal Sales MixGWh35,0009,0007,000HK 437,576CAPCO - JV partner8177436891,0641,3531,3541,306CAPCO - CLP's share1,3681,7351,6072,4813,1583,1593,048CLP Power5,6155,1524,9964,5234,4114,5844,528Total of CLP2017201820192020Infrastructure & Public ServicesResidentialNote: Local sales compound annual growth rate 0.5%Total Capital Expenditure in line with Development Plan (DP)Capex incurred in 2018 DP from Oct 2018 to Dec 2020: HK 20.6 bnCapex approved under the 2018 DP from Oct 2018 to Dec 2023: HK 52.9bn25
Tariff, Energy Cost, Fuel Mix and Gas VolumeHK /kWhTariffs140Energy CostHong Kong25,000Average Net Tariff 121.8 1%120Basic Tariff 93.71008015,00060Nuclear10,000Gas11,03220Special Rebate0-20* As per rate announced in the annual tariff review. During the year, the Fuel Cost Adjustment isautomatically adjusted on a monthly basis to reflect changes in actual price of fuel used.8,1155,0003,6541,270201920200Fuel Mix15%CoalGas Volume(based on MWh generated/purchased)1%Others6,7146,787HK MFuel Cost Adjustment 28.1*4019,37235618,79323720,000CoalGas36% 35%36%NuclearOthers (e.g. Oil)202029%201948%2012201320142015Yacheng Gas20162017WEP II Gas201820192020CNOOC Gas26
Current Development Plan 2018-2023Allocation of capital investmentMaintainingReliability (38%)Lowering Carbon &Emissions (30%)Meeting Demand(24%)Smart City &Digitalisation (8%)DigitalizationTotal Investment of HK 52.9 billion (Oct 2018 – Dec 2023)Hong KongKey projects One additional CCGT D2 together with remaining cost of D1 (approved in 2016) Enhancement of existing gas generation facilities Offshore LNG Terminal Enhancement of Clean Energy Transmission System Installation of generation units at West New Territories Landfill Advanced Metering Infrastructure (AMI) Smart City and Digital DevelopmentsOriginal Development Plan ForecastsYear2018201920202021(HKȼ/kWh)Actual (Q4)ActualActualActual202120222023Development Plan Forecast announced in July 2018Basic Tariff91.092.2 ( 1.3%)93.7 ( 1.6%)96.5 ( 3.3%)99.1 ( 2.7%)101.9 ( 2.8%)Fuel Clause Charge27.830.8 ( 10.8%)28.1 (-8.8%)36.2 ( 11.7%)37.4 ( 3.3%)37.4 (-)Rent & Rates Special Rebate(1.1)-*(1.2)-*---Average Net Tariff117.7118.8121.8 ( 2.5%)121.8 (Freeze)132.7 ( 5.5%)136.5 ( 2.9%)139.3 (2.1%)Year-end balance ( m)ActualActualActualRevised est.Tariff Stabilisation Fund9411,4782,019728455438423Fuel Clause Account9011,13134635-614724Development Plan Forecast announced in July 2018* Special Rent & Rates Rebate discontinued when the refund received from Government in 2018 was used up27
Gas-fired Generation Capacity Expansion New generation unitsHong Kong 1st unit now in operation 2nd unit early civil works are progressing welland engineering, procurement, andconstruction contracting is under way200MW upgrade plan for existing units 25MW for each of the eight existing units 175MW completed to Jun 2021Offshore LNG Terminal to support diversificationand security of gas sourceUnit D1 now in operationUnit D2 commenced constructionUpgrade of 8 existing units600MW550MW Unit Unit D2D1 achieved Construction200MWcommercial in progressUpgrade in operationprogress2,500 MWbase capacitySimulated photoArtistic impression of D1 & D2 facilities Additional gas capacity will help facilitateretirement Castle Peak A Power StationUpdate for 2021 Interim28
Hong Kong Offshore LNG Terminal ProjectHong KongBlack Point PowerStation (BPPS)Proposed location for HKOffshore LNG TerminalLamma PowerStation (LPS)Simulated photo The Offshore LNG Terminal is a critical infrastructure project that will improve Hong Kong’s energy security and diversity of gas supply, andprovide access to the competitive international market. The Project was approved by the HKSAR Government on 4 July 2018 as part of itsapproval of the 2018 – 2023 Development Plan. The project consists of a floating storage and regasification unit (FSRU) vessel and an offshore jetty that is connected by subsea pipelinesto the Black Point and Lamma Power Stations. The FSRU vessel is a dedicated facility with specialised equipment that will be moored atthe jetty. Construction of the offshore LNG Terminal project started and installation of the first jacket structure at the jetty site was successfullycompleted. Laying of the subsea gas pipe is underway. The offshore LNG terminal is scheduled to commence commercial operation during 2022.Update for 2021 Interim29
Greater Bay AreaNational significanceHeight: 2020 GDP (US billion)Colour: 2020 Population (Pop.) (million) 33 - 5.96 - 8.9 9GuangzhouFoshanGDP: 363bnPop.: 19mGDP: 157bnPop.: 10mShenzhenDongguanGDP: 140bnPop.: 10mZhaoqingGDP: 347bnPop.: 7mGDP: 34bnPop.: 4mJiangmenZhongshanGDP: 46bnPop.: 5mGDP: 46bnPop.: 4mMacauKey element of China’s blueprint for innovation,development & economic reforms leveraging capabilities andconnecting GBA cities GDP US 1.7 trillion, population 86 million. Comparison ofBay Areas:2020GDP: 401bnPop.: 18mHong KongHuizhouGDP: 61bnPop.: 6mGDP(US bn)GBAZhuhai21GDP: 24bnPop.: 1mNew Infrastructure connecting Hong Kong in GBA1 HK-Zhuhai-Macao Bridge 2 HK Section of High Speed Rail Network, and 7th land boundary crossing1,6791Pop. (m)86995181New York1,8611191Tokyo1,992244San FranciscoGDP: 50bnPop.: 2mHong Kong 1: 2019 figure 2: 2018 figureSource: Government statistical departments in the relevant jurisdictions, HKTDC, 23 June 2021Source: Census and Statistics Department of Hong Kong, Statistics and Census Service of Macau, and the statistics bureaux ofthe relevant PRD cities, Hong Kong Trade Development Council (HKTDC), 23 June 2021Hong Kong’s Position Most open and international GBA city, with dual advantages of “one country, two systems”International financial, transportation, trade centre & professional servicesEnhances regional economic development of the GBA, particularly in those industries where Hong Kong demonstrates strengths Guangzhou-Shenzhen-Hong Kong Express Rail Link Liantang/Heung Yuen Wai Boundary Control Point Hong Kong-Shenzhen Innovation and Technology Parkin the Lok Ma Chau Loop Supporting Infrastructure HighlightsHong Kong-Zhuhai-Macao BridgeResearch infrastructure and facilities by Hong Kong Science and TechnologyParks Corporation to enhance support for its tenants and incubatesClean Energy Transmission System EnhancementUpdate for 2021 Interim30
Mainland China2020 ACOIGeneration Business, 15% of Group Assets9,066 MW generation capacity#As at 30 Jun 2021 HK m3,000 Non-carbon 90%Mainland ChinaCoal2,500JilinInner 00Hydro500Nuclear0ShandongJiangsuShanghaiGansuCoal PowerSichuanHydro PowerSolar PowerWind PowerDistribution ProjectYunnan2020Opex & DevexNon-carbon emitting portfolio# in Mainland ChinaMW5,000GuizhouNuclear Power2019-500GuangxiGuangdong4,0003,0002,000 CLP is one of Mainland China’s largest external independent power producers, 1,000diversified by geography & fuel type0 Over 90% of earnings from non-carbon generation Focus on decarbonization, digitalisation and energy infrastructure initiativesalong the value chain, particularly in the Greater Bay AreaNuclearRenewablesUnder construction - NuclearUnder construction - Renewables#Including long-term capacity and energy purchase arrangements* map shows indicative locations of assets only; does not purport to show exact locationsUpdate for 2021 Interim31
Generation Portfolio#Wholly-ownedMajority-ownedEqually/ Minority-owned(2,552/1,952 MW)(2,709/1,916 MW)(19,825/5,199 MW)Mainland ChinaWindCoalCoal Wind Projects (644/644 MW) Fangchenggang I (1,260/882 MW) Fangchenggang II (1,320/924 MW) Guohua (7,470/1,248 MW) SZPC (3,060/900 MW)HydroHydroNuclear Jiangbian (330/330 MW) Dali Yang er (50/50 MW) Guangzhou Pumped Storage PowerStation (1,200/600 MW) Huaiji (129/110 MW) Daya Bay (1,968/1,577 MW)– 25% equity; currently purchasing 80%of output Yangjiang (6,516/1,108 MW)– 17% equitySolarWind Jinchang (85/85MW) Xicun I & II (84/84 MW) Sihong (93/93 MW) Huai’an (13/13 MW) Lingyuan (17/17 MW) Meizhou (36/36 MW) Other wind projects (811/367 MW) CLP wholly owns Hong Kong Pumped Storage Development Company (PSDC), which has contractual rights to use600MW generation capacity# Including long-term capacity and energy purchase arrangementsFor moreinformation onour presence inMainlandChina andother regions:As at 30 Jun 202132
On-grid TariffsOn-grid tariffs in the electricity market in Mainland China are set by the National Development and Reform Commission (NDRC). Daya Bay: Tariff determined by a formula based on operating costs.Profits calculated with reference to capacity factors Yangjiang: Benchmark tariff RMB0.4153/kWh effective Jul 2019; 20%output subject to competitive discount process; 3% competitive salesNuclear Four-tier tariffs vary by region depending on wind resourceRMB 0.40 - 0.70/kWh for projects approved before 2019RMB 0.29 - 0.52/kWh guided tariff for projects 2019 New wind projects tariffs set by competitive bidding (grid-parity)Subsidy based on “lifetime utilisation hours caps” or 20 yearsWind Three-tier tariffs vary by region depending on solar resource RMB 0.55 - 1/kWh, incl. national subsidies, for projects approved and putinto operation on or before 30 Jun 2019 RMB 0.40 – 0.55/kWh guided tariff for projects after 1 Jul 2019 New solar project tariffs set by competitive bidding (grid-parity) Subsidy based on “lifetime utilisation hours caps” or 20 yearsSolarMainland China A wide range of tariffs may apply depending on the individualproject, seasonality and time of the dayHydro Tariff setting mechanism has been changing from a top-down benchmarktariff to a more market-oriented pricing system during the power sectorreform processCoal Additional subsidising tariffs will be provided to individual plants onreduction of NOx, SOx and dust emission during operationCoalCoalCLP Mainland China 2020Approximate % Allocation of Market Sales202048%49%52%51%2019Market SalesPlanned Sales Market sales in 2020 predominately related to Fangchenggangcoal-fired power station in GuangxiUpdate for 2021 Interim 33
Climate Policy and National Carbon MarketChina has set ambitious climate change targetsMainland China20602030 Reduce CO2 emissions per unit of GDP by over 65% compared to 2005 levelIncrease share of non-fossil fuel energy to around 25%Peak CO2 emissions Carbon NeutralityChina’s National Emission Trading Scheme (ETS) ETS Market officially launched on 16 July 2021 with an initial price at RMB 50/ton and only covers coal and gas-fired generatorsOver 2,000 fossil fuel power plants with total emissions of over 4 billion tons of CO₂ are covered under the schemeAllowance granted by the Government is the credit to be used for meeting compliance obligationsPre-allocated allowances (based on 70% of the plant’s power supply in 2018) already dispatched to the participants and can be traded, andfinal adjustments will be conducted by the end of September 2021A dedicated team manages our carbon portfolio to optimise trading and compliance for the coal-fired assetsWe are exploring carbon abatement technologies to reduce emission and seeking to expand our non-carbon generationGovernmentMandated entities(Fossil-fueled plants)Cash / AllowanceExchange34
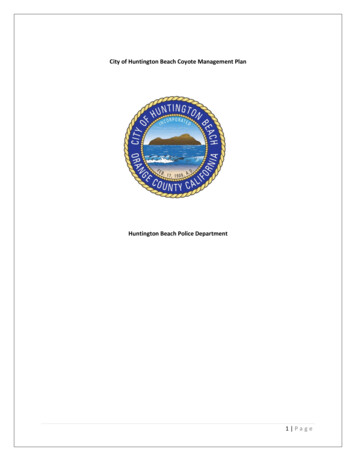
Australia Integrated energy business serving 2.4 million customer accounts across southeast Australia Asset portfolio includes coal, gas and wind generation with an extensive range of long-termrenewables and storage contractsGeneration & Retail Business17% of Group Assets# 5,419 MW generation capacityAs at 30 Jun 2021 Coal (2,910/2,910MW) Yallourn (1,480/1,480MW) Mount Piper (1,430/1,430MW)Ross RiverFor more information onour presence in Australiaand other regions:Kidston pumpedstorageWind (693/560MW)BrisbaneSA0.1MCoal PowerGas PowerWind PowerSolar PowerGas ReserveRetail AccountsBattery StoragePotentialProjectsWilga allyAdelaideCathedral GannawarraVicRocks0.8MMelbourneMortons LaneNarrabri Gas ProjectMount PiperSydneyTallawarra &Tallawarra BTaralgaBoco Rock Gullen Range IYallournJeeralangBallaratNewport#Wooreenbattery storageGas Resource Narrabri gas project (2C contingentresource of up to 1,200/240PJ)Gas Generation (1,617/1,599MW) Hallett (235/235MW) Newport (500/500MW) Jeeralang (440/440MW)Qld0.1MAustraliaAustralia Cathedral Rocks (64/32 MW)Mortons Lane (20/20MW) #Waterloo
5 Business Units -Capabilities along the Value Chain G: Generation T: Transmission D: Distribution R: Retail S: Smart Energy Services 2020 Operating earnings: Total Assets: HK 8,088m HK 138.5bn HK 2,233m HK 34.4bn HK 1,690m HK 40.6bn HK 175m HK 14.5bn HK 386m HK 2.3bn