Transcription
S.-Q. ZHENG et al.: Adsorption of Cu2 , Zn2 , and Ni2 Ions onto the Adsorbent Prepared from ., Kem. Ind. 68 (5-6) (2019) 201–208Adsorption of Cu , Zn , and Ni Ions ontothe Adsorbent Prepared from Fluid CatalyticCracking Spent Catalyst Fines and Diatomite2 2 2 9Professional paperReceived September 13, 2018Accepted December 3, 2018S.-Q. Zheng,a,b,* S.-C. Liu,a and P.-Q. Zhang,a C. Yang,a and T. Wang aThis work is licensed under aCreative Commons Attribution 4.0International LicenseDepartment of Chemistry and Chemical Engineering, Hunan Institute of Science and Technology,Yueyang 414 000, Hunan, P.R. ChinabHunan Province Key Laboratory of Speciality Petrochemicals Catalysis and Separation,Yueyang 414 000, Hunan, P.R. ChinaaAbstractAn adsorbent prepared from fluid catalytic cracking (FCC) spent catalyst fines and diatomite, and its adsorption of Cu2 , Zn2 ,and Ni2 ions were investigated. The adsorbent was characterized by XRD, SEM, and N2 adsorption-desorption techniques.The results showed that the specific surface area and pore volume of adsorbent increased with the increase in FCC spent catalyst fines. The influence factors on the adsorption of the adsorbents were studied. The suitable adsorption conditions were:pH value of 5.0, ratio of solid to liquid of 1 : 600 (g:ml), adsorption time of 4 h, room temperature. The adsorption of metalions varied with the type of metal cations. The adsorption isotherms suggested that the sequence of the adsorption efficiency was Cu2 Zn2 Ni2 . The amount of Cu2 , Zn2 , and Ni2 metal ion adsorbed onto the adsorbent was 49.17 mg g 1,46.83 mg g 1, and 35.72 mg g 1, respectively. The adsorption data of Cu2 , Zn2 , and Ni2 ions fitted well with the Freundlichadsorption isotherm model.KeywordsAdsorption, heavy metal ion, FCC spent catalyst fines, diatomite1 IntroductionIndustrial wastewater, especially that containing heavymetals, is becoming a serious environmental problem.In general, wastewater contains acid, as well as copper,zinc, nickel, chromium, and other metal ions, which areoften high in concentration and toxic. The removal of toxic heavy-metal contaminants from industrial wastewateris one of the most important environmental issues to besolved today. The search for new and innovative treatmenttechnologies has focused attention on the effect of heavymetal toxicity.1–6A fluid catalytic cracking (FCC) unit can produce about20 thousand tons of catalyst fines ( 20 μm) annually inChina.7–8 The amount of the fines is expected to increasewith the prospering development of FCC. The spent fineparticles are mainly composed of silica, alumina, zeolite,and trace heavy metals like V, Fe, and Ni. Although thesefines have lost the catalytic activity to meet application requirements, they are still an appropriate raw material ofhigh-value silicon/aluminum products, either from crystalphase composition or main chemical elements, and havehigher specific surface area and pore volume. N. S. Japtiwale has put forward that spent fluidized cracking catalyst can be utilized as an adsorbent for heavy metals fromwastewater.9Diatomite is a material of sedimentary origin consistingmainly of an accumulation of skeletons formed as a pro*Corresponding author: Shuqin Zheng, phone: 86-730-8640122Email: zhengshuqin37@163.comtective covering by diatoms. The skeletons are essentiallyamorphous hydrated or opaline silica, but occasionally arepartly composed of alumina. Diatomite usually containsother sediments, such as clay and fine sand, but its deposits sometimes consist of diatom shells only. On completecalcination, diatomite produces porous structure.There are many studies of the adsorption of heavy metalions onto the adsorbent prepared by clay and modifiedclay.10–13 For example, diatomite has been tested as a potential adsorbent for Pb(II) ions. The intrinsic exchangeproperties were further improved by modification withmanganese oxides. Mn-diatomite adsorbent showed ahigher tendency for adsorbing lead ions from solution atpH 4. A. Mellah et al. have studied the equilibrium isotherms of zinc adsorption onto natural bentonite. Theirresults show that the data correlate well with Freundlichand Langmuir models, and that the adsorption is physicalin nature. S.-H. Lin et al. have studied the removal of Cu2 and Zn2 from aqueous solutions by sorption on montmorillonite modified with sodium dodecylsulfate (SDS).In the present work, an adsorbent was prepared from FCCspent catalyst fines and diatomite. An XRD, SEM, and N2adsorption-desorption analysis of the FCC spent catalystfines and diatomite was also performed in order to explorethe properties of the adsorbent. The main interest in theproperties of the adsorbent is related to their high selectivity toward metals, such as Cu2 , Zn2 , and Ni2 ions. Theaim of our study was to determine the effect of differentoperating parameters, such as pH, initial concentration,ionic strength, and temperature on these adsorption pro-
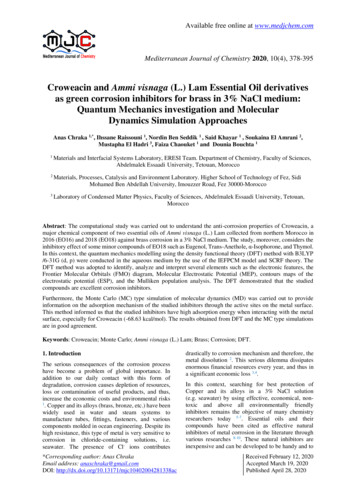
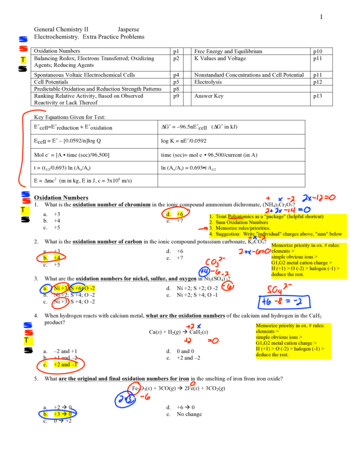
202S.-Q. ZHENG et al.: Adsorption of Cu2 , Zn2 , and Ni2 Ions onto the Adsorbent Prepared from ., Kem. Ind. 68 (5-6) (2019) 201–208Table 1 – Chemical composition of SCF and diatomiteSampleChemical composition �0.270.54cesses, as well as study the determination of adsorptionisotherms.2 ExperimentalMgOmetal concentration was determined by the difference between the initial concentration in the aqueous solution andthat found in the supernatant, using an atomic absorptionspectroscopy (AAS) apparatus.2.1 Materials2.4 Analysis and characterizationDiatomite (marked as D) was obtained from Jilin Changbai diatomite Co., Ltd. FCC spent catalyst fines (marked asSCF) were obtained from Hunan Zhonghe Chemical Co.,Ltd. The chemical composition of the SCF and D is listedin Table 1. Specific surface area and total pore volume ofSCF and D were 102 m2 g 1, 48 m2 g 1, and 0.15 ml g 1,0.42 ml g 1, respectively, and the particle median diameter was 18 μm and 7.2 μm, respectively. Copper nitrate,zinc nitrate, and nickel nitrate were obtained from TianjinFuchen Petrochemical Company. Hydrochloric acid wassupplied from the Beijing Chemical Industry Company.Solutions of all cations were prepared from reagent-gradenitrate salts.Contents of SiO2, Al2O3, Fe2O3, Re2O3, Na2O, CaO, andMgO in SCF, diatomite and adsorbents were determinedby chemical analysis. Contents of Ni, V, Cu in SCF, andadsorbents were determined by plasma optical emissionspectrometry.2.2 Preparation of adsorbentSCF and D were dispersed in 100 cm3 of HCl (c 1 mol l 1)solution, and the suspension was stirred for 2 h at 65 C.After the reaction, the reactant slurry was separated fromthe mother liquor by vacuum filtration on Buchner funnels,washed with warm distilled water until Cl ion free, oven-dried at 120 C, powdered, and sieved. A fraction lessthan 60 μm was used in all the experiments. The additionof SCF and D was 9 : 1, 7 : 3, 5 : 5, and 2 : 8 (weight ratio),respectively. The samples were marked as A1–A4.Reference sample: With the same method, the referencesamples were prepared from the FCC spent catalyst finesand diatomite alone, respectively (marked as RA1, RA2).2.3 AdsorptionThe amount of Cu2 , Zn2 and Ni2 ions adsorbed on theadsorbents was determined: 0.050-g samples were respectively suspended in 25-ml aqueous solutions, containingeach cation of Cu2 , Zn2 , and Ni2 ions at several differentconcentrations, varying from 10 to 100 mg l 1. At roomtemperature, initial concentration, pH, and adsorptiontime were investigated. The pH of the solutions was adjusted with NaOH or HNO3 (c 1.0 mol l 1) solution. Thesolutions were mechanically stirred in an orbital shaker incubator. At the end of this process, the solid was separatedby centrifugation for 5 min at 5000 rpm. The adsorbedXRD: Phase of samples was recorded on a Rigaku UltimiIV diffractometer using Cu-kα radiation (λ 1.54056 Å)operating at a tube voltage of 40 kV and a tube current of30 mA. The samples were scanned in the 2θ angle rangefrom 3 to 50 , at a speed of 0.2 min 1. N2 adsorption-desorption methods: The specific surface areas and pore volumes were measured on an ASAP 2020 sorptometer using adsorption and desorption isotherm plots at 196 C,and the samples were out-gassed at 90 C for 1 h, and at350 C for 4 h prior to testing. SEM: The morphology andsize of the samples were determined using scanning electron microscopy (SEM) (JEOL JSM-6360) after coating withan Au evaporated film. Particle size distribution: A MalvernMicro-P particle size distribution analyser was used for determining the size distribution of the samples. Atomic absorption spectrometer: Concentrations of Cu2 , Zn2 , andNi2 in the aqueous solutions were measured on an AA6880 atomic absorption spectrometer. The amount of metal ion adsorption was obtained by the following equation:q (C0 C) · V/m(1)where, q is the amount of metal ion adsorbed on samples (mg g 1), C0 and C are the initial and equilibrium liquid-phase concentrations of metal ion solution (mg l 1),respectively, V is the volume of metal ion solution (ml), mis the mass of the adsorbent sample (g).3. Results and discussion3.1 Properties of the adsorbent3.1.1 XRD characterizationFigs. 1 and 2 show XRD patterns of the samples and theadsorbents, respectively. In Fig. 1, the curve revealed thatFCC spent catalyst fines were mainly composed of Al2O3and small amounts of zeolite Y and zeolite ZSM-5. From
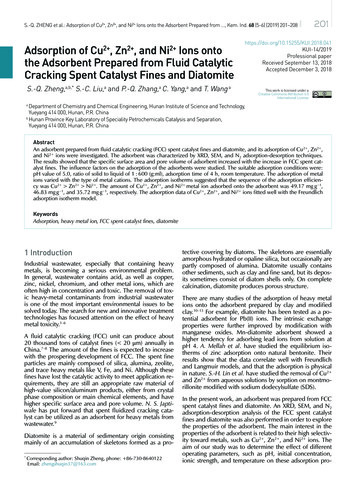
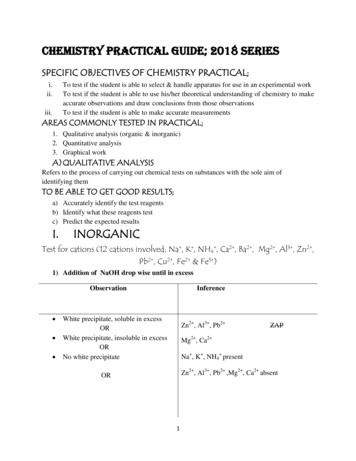
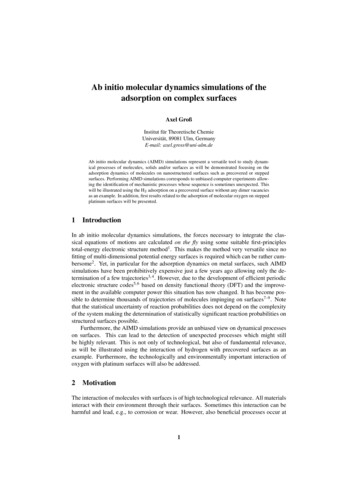
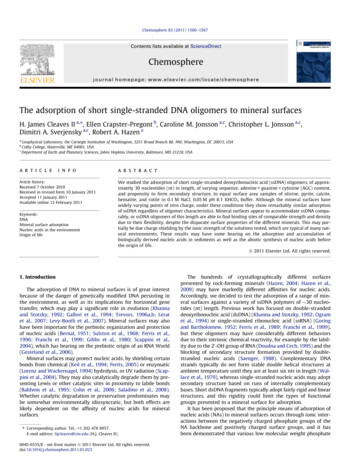
203S.-Q. ZHENG et al.: Adsorption of Cu2 , Zn2 , and Ni2 Ions onto the Adsorbent Prepared from ., Kem. Ind. 68 (5-6) (2019) 201–20801020ffeeddccbbaa30405060702θ Fig. 1 – XRD patterns of the samples (a) SCF; (b) D; (c) SCF : D 90 : 10; (d) SCF : D 70 : 30; (e) SCF : D 50 : 50;(f) SCF : D 20 : 80the curve b, diatomite had a very wide asymmetric diffraction peak between 18 and 28 degrees of 2θ, indicating that the internal structure in the diatomite was highlydisordered, which was basically consistent with the XRDpattern of opal-AG. Diatomite had a diffraction peak at dvalue of 4.255 and 3.343, indicating that diatomite mixedwith a minority amount of quartz.14 Curves c–f were themixing samples of FCC spent catalyst fines and diatomite indifferent proportions. It was found that the diffraction peakintensity of SCF decreased with its amount decreasing. Itwas the same for diatomite.Fig. 2 reveals that the patterns of RA1 and RA2 basicallyhad not changed compared to SCF and diatomite. A2–A4were basically the same as that of curves d–f in Fig. 1, indicating that these modification conditions had not causedchange in the phase.3.1.2 Specific surface area and pore volumeof the adsorbentTable 2 shows the specific surface area and pore volumeof the adsorbents. The results showed that the specific surface area of the adsorbent increased with the increase inthe amount of FCC spent catalyst fines in the adsorbent,while the pore volume of the adsorbent increased with theincrease in the diatomite amount in the adsorbent. Thiswas because the material itself had a larger surface areaand pore volume. After modification, the specific surfacearea and pore volume of FCC spent catalyst fines and diatomite all increased. These results showed that acid activation of FCC spent catalyst fines and diatomite lead toincreases in specific surface area, total pore volume, andmesopore volume.01020302θ 40506070Fig. 2 – XRD patterns of the adsorbents (a) RA1; (b) RA2; (c) A2;(d) A3; (e) A4Table 2 – Specific surface area and pore volume of the samplesSamplePore volume Mesopore volume Special surface areaml g 1 ml g 1 m2 g 3533.1.3 Chemical composition of the adsorbentTable 3 shows the chemical composition of the adsorbents.The results showed that the adsorbents mainly containedSiO2, Al2O3, Re2O3 and trace metals of Fe, V, Ni, Cu, CaO,and Na2O. The acid treatment reduced or eliminated allother oxides relative to SiO2. With the increase in the content of diatomite in the adsorbents, the loss of alumina inthe adsorbents reduced, indicating that the presence of diatomite effectively reduced the aluminum from the FCCwaste catalyst fines in the acid system.3.1.4 SEM characterizationFig. 3 shows SEM of the SCF and diatomite. Fig. 3(a) displays that FCC spent catalyst fines possessed lamellar structure with rough surface. The particle size was over 10 μmand non-uniform. The diatomite morphology is shown in
204S.-Q. ZHENG et al.: Adsorption of Cu2 , Zn2 , and Ni2 Ions onto the Adsorbent Prepared from ., Kem. Ind. 68 (5-6) (2019) 201–208Table 3 – Chemical composition of the adsorbentsSampleChemical composition 10.01––––0.060.08Fig. 3(b). The diatomite was mainly dominated by disc algae, and the micropores on the surface of algae were clearly visible and evenly distributed.of Ni2 ions onto the FCC spent catalyst fines was greaterthan that of Cu2 and Zn2 ions, and the adsorption ofCu2 ions onto the diatomite was greater than that of Zn2 and Ni2 ions. Overall, the adsorption value of A3 was thebest. Therefore, the A3 adsorbent was used as the adsorbent in the following experiment. The adsorption capacityof Cu2 , Zn2 , and Ni2 metal ions by FCC spent catalystfines and diatomite alone is much lower than that of otheradsorbents. To adsorption performance, diatomite has synergistic effect with FCC spent catalyst fines.3.2.2 Effect of solid-liquid ratio on adsorption3.2 Metal ion adsorption3.2.1 Adsorption properties of different adsorbents0.050 g of samples were suspended in 25 ml aqueous solution, respectively. The concentration of Cu2 , Zn2 , andNi2 metal ions in this aqueous solution was 100 mg l 1,respectively. The conditions were room temperature,pH 5.0, ratio of solid-liquid 1 : 600 (g:ml), and adsorption time 6 h. The results are shown in Table 4. It wasfound that the adsorption of Ni2 ions onto A1 was greaterthan that onto A2–A4. The adsorption of Cu2 ions was justthe opposite, and A3 had the best effect on the adsorption of Zn2 ions. This demonstrated that the adsorptionTable 4 – Adsorption of Cu2 , Zn2 , and Ni2 ions onto the adsorbentsSampleAdsorption value mg g 12 CuZn2 Ni2 .436.1SCF18.819.310.7D11.510.18.90.050 g of A3 was suspended in 25 ml aqueous solution.The concentration of Cu2 , Zn2 , and Ni2 metal ions inthis aqueous solution was 100 mg l 1, respectively. At roomtemperature, pH 4.0, effect of solid-liquid ratio (g ml 1)on adsorption was tested. The results are shown in Fig. 4.It was found that the amount of Cu2 , Zn2 , and Ni2 ionsadsorbed onto A3 increased with the increase in solid-liquid ratio . When solid-liquid ratio was 1 : 700, the amountof Cu2 , Zn2 , and Ni2 metal ions adsorbed onto the adsorbent became more balanced. Based on the results, theoptimum ratio of solid-liquid was 1 : 600 (g:ml).60Cu2 adsorption value mg g 1Fig. 3 – XRD patterns of the samples (a) SCF; (b) D50Zn2 40Ni2 30201:100 1:200 1:300 1:400 1:500 1:600 1:700solid-liquid ratioFig. 4 – Effects of solid-liquid ratio on adsorption of Cu2 , Zn2 ,and Ni2
205S.-Q. ZHENG et al.: Adsorption of Cu2 , Zn2 , and Ni2 Ions onto the Adsorbent Prepared from ., Kem. Ind. 68 (5-6) (2019) 201–208The pH is one of the most important factors in controllingthe adsorption of these cations at the surface. 0.050 g ofA3 was suspended in 25 ml aqueous solution. The concentration of Cu2 , Zn2 , and Ni2 metal ions in this aqueoussolution was 100 mg l 1, respectively. At room temperature, ratio of solid-liquid 1 : 600 (g:ml), and adsorptiontime 2 h. The effect of pH on the adsorption of metal ionsonto the adsorbent is given in Fig. 5. It was found that theeffect of pH on the adsorption of Cu2 , Zn2 , and Ni2 ionsonto the adsorbent had two aspects: (1) the competitiveadsorption between Cu2 , Zn2 , and Ni2 ions and H ,and (2) changes in surface hydroxyl groups indicated thatthe numbers of adsorbed metal ions increased with the increase in pH. With increased pH, H concentration in thesolution decreased, the competitive adsorption of H ionsdecreased, the heavy metal ions had more opportunities toclose to active site in surface.60Ni2 ions onto the adsorbent also increased. With adsorption time longer than 6 h, the rate of adsorption changedslowly, and the adsorption content of Cu2 , Zn2 , and Ni2 ions onto the adsorbent slightly increased as adsorptiontime increased further. When adsorption time was longerthan 8 h, the change in the adsorption content of Cu2 ,Zn2 , and Ni2 ions onto the adsorbent was not obvious.Therefore, the moderate adsorption time was 6 h.adsorption value mg g 13.2.3 Effect of pH on adsorption50Zn2 40Zn2 Ni2 4030201001234567adsorption time h891011Fig. 6 – Effects of adsorption time on adsorption of Cu2 , Zn2 ,and Ni2 Ni2 3.2.5 Effect of concentration of metal ion on adsorption302050001234pH5678Fig. 5 – Effects of pH value on the adsorption of Cu2 , Zn2 , andNi2 From Fig. 5, pH significantly affected the adsorption ofCu2 , Zn2 , and Ni2 ions. When pH was less than 4.0,the adsorption content of Cu2 , Zn2 , and Ni2 ions ontothe adsorbent was low. With pH above 4.0, the adsorptioncontent of Cu2 , Zn2 , and Ni2 ions onto the adsorbentcontinuously increased. When pH value above 6.0, theprecipitation began to appear. Therefore, the moderatepH value was 5.0.3.2.4 Effect of conditioning time on adsorption0.050 g of A3 was suspended in 25 ml aqueous solution.The concentration of Cu2 , Zn2 , and Ni2 metal ions inthis aqueous solution was 100 mg l 1, respectively. Conditions were: room temperature, pH 5.0, and ratio ofsolid-liquid 1 : 600 (g:ml). The effect of adsorption time onthe adsorption of metal ions onto the adsorbent is given inFig. 6. From Fig. 6, it may be seen that, with the increase inadsorption time, the adsorption content of Cu2 , Zn2 , andTwenty-five ml of the solution containing Cu2 , Zn2 , andNi2 ions at 10, 20, 30, 40, 50, 60, 80, and 100 mg l 1 wasprepared, respectively. 0.050 g of A3 was added, respectively, at room temperature, pH 5.0, adsorption time6 h, and ratio of solid-liquid 1 : 600 (g:ml). The effect ofconcentration of Cu2 , Zn2 , and Ni2 ion on adsorptionwas studied. The results are shown in Fig. 7.40equilibrium adsorption value mg g 1adsorption value mg g 1Cu2 Cu2 Cu2 30Zn2 Ni2 20100010 20 30 40 50 60 70 80 90 100 110concentration of each ion mg l 1Fig. 7 – Relationship between the concentration of heavy-metalions and adsorption value
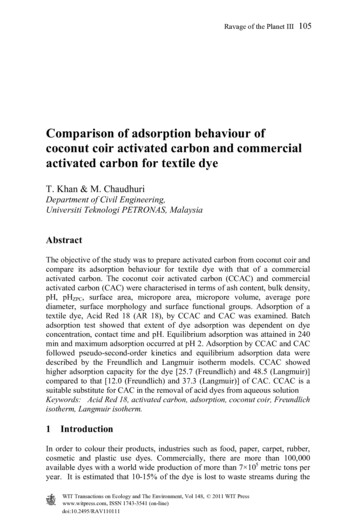
206S.-Q. ZHENG et al.: Adsorption of Cu2 , Zn2 , and Ni2 Ions onto the Adsorbent Prepared from ., Kem. Ind. 68 (5-6) (2019) 201–2083.2.6 Comparison of the adsorption capabilityFrom Fig. 7, the adsorption of Cu2 , Zn2 , and Ni2 ionsonto the adsorbent surface can be interpreted with the Freundlich equation curve:lg q (1/n) lg C lg KFThe adsorption ability of the different adsorbents was tested. Under the optimized conditions mentioned previously,1.0 g adsorbent and reference samples were suspended inaqueous solution, respectively. The concentration of Cu2 ,Zn2 , and Ni2 metal ions in this aqueous solution was1000 mg l 1, respectively. The solution was mechanicallystirred for 6 h. The concentration of Cu2 , Zn2 , and Ni2 in solution was determined, and the results are shown inTable 5. From Table 5, it may be seen that the capabilityof A3 adsorbent surface to adsorb cations from aqueoussolution was significantly better than the reference samplesprepared from the FCC spent catalyst fines and diatomitealone. The adsorption capability of A3 adsorbent onto thecations gave an order of Cu2 Zn2 Ni2 .(2)where, C is equilibrium concentration (mg l 1), q is theequilibrium adsorption capacity (mg g 1), n and KF are constants.By mapping of lg q to lg C, after regression analysis, threelinear equations were obtained:lg q 0.9423 lg C 0.3537(3)lg q 1.0856 lg C 0.7125(4)lg q 1.1749 lg C 1.0245(5)Computer simulation was used to fit the Freundlich equation to the adsorption data. The accuracy of these fits wasestimated in terms of the computed correlation coefficient.Equations (3)–(5) are linear equations of the adsorptionof Cu2 , Zn2 , and Ni2 ions onto the adsorbent surface,respectively. The correlation coefficients were 0.9967,0.9959, 0.9957, respectively (see Fig. 8(1)–(3)). The experiment data of adsorption onto the adsorbent were inaccordance with Freundlich adsorption model.1.6Table 5 – Adsorption ability of the adsorbentZn2 Ni2 )1.41.21.01.0lg qlg q1.20.80.80.60.60.40.40.20.20.0Cu2 1.6(1)1.4Adsorption value mg g 1Sample1.01.21.41.6lg C1.80.02.01.21.01.41.6lg C1.82.01.61.4(3)1.2lg q1.00.80.60.40.20.01.01.21.41.6lg C1.82.0Fig. 8 – Linear fitting of the adsorption vs. initial concentration of heavy-metal ions: (1) Cu2 ; (2)Zn2 ; (3) Ni2
S.-Q. ZHENG et al.: Adsorption of Cu2 , Zn2 , and Ni2 Ions onto the Adsorbent Prepared from ., Kem. Ind. 68 (5-6) (2019) 201–2084. ConclusionsIn this paper, the properties of the adsorbent preparedfrom FCC spent catalyst fines and diatomite, and its adsorption were investigated. We studied the effect of different operating parameters on these adsorption processes, such as initial concentration, pH, ionic strength, andadsorption time. The results showed that the adsorbentpossessed larger specific surface area, pore volume, andmesopore volume. This confirmed that the adsorbents hadstrong ability to adsorb the metal cations. When the adsorbent contained more FCC spent catalyst fines, it showedhigher adsorption capacity of Ni2 ions than other metalions. When the adsorbent contained more diatomite, theadsorbent had greater adsorption capacity of Cu2 ionsthan other metal ions. The amount of Cu2 , Zn2 , and Ni2 metal ion adsorbed onto the adsorbent was 49.17 mg g 1,46.83 mg g 1, and 35.72 mg g 1, respectively. The adsorption of Cu2 , Zn2 , and Ni2 ions onto the adsorbentsurface can be interpreted with the Freundlich adsorptionmodel.ACKNOWLEDGEMENTSThis work was financially supported by the National Natural Science Foundation of China (No. 21371055), HunanProvincial Colleges and Universities Innovation PlatformOpen Fund Project (No. 15K049).List of abbreviationsAAS– atomic absorption spectroscopyFCC– fluid catalytic crackingSDS– sodium dodecylsulphateSEM– scanning electron microscopyReferencesLiteratura1. S. Lazarević, I. Janković-Častvana, D. Jovanović, S. Milonjić,Dj. Janaćković, R. Petrović, Adsorption of Pb2 , Cd2 andSr2 ions onto natural and acid-activated sepiolites, Appl.Clay Sci. 37 (2006) 47–57, doi: https://doi.org/10.1016/j.clay.2006.11.008.2. A. J. Aznar, E. Gutierrez, P. Diaz, A. Alvarez, G. Poncelet, Silicafrom sepiolite: preparation, textual properties, and use assupport to catalysts, Microporous Mater. 6 (1996) 105–114,207doi: https://doi.org/10.1016/0927-6513(95)00096-8.3. C. Hu, P. F. Zhu, M. Cai, H. Q. Hu, Q. L. Fu, Comparativeadsorption of Pb(II), Cu(II) and Cd(II) on chitosan saturatedmontmorillonite: Kinetic, thermodynamic and equilibriumstudies, Appl. Clay Sci. 143 (2017) 320–326, doi: https://doi.org/10.1016/j.clay.2017.04.005.4. A. Kumar, H. M. Jena, Adsorption of Cr(VI) from aqueous phase by high surface area activated carbon prepared by chemical activation with ZnCl2, Process Saf. Environ. 109 (2017) 63–71, doi: https://doi.org/10.1016/j.psep.2017.03.032.5. A. G. S. Prado, L. N. H. Arakaki, C. Airoldi, Adsorption andseparation of cations on silica gel chemically modified byhomogeneous and heterogeneous routes with the ethylenimine anchored on thiol modified silica gel, Green Chem. 4(2002) 42–46, doi: https://doi.org/10.1039/b108749e.6. Z. Aksu, U. Acikel, T. Kutsal, Application of multicomponent adsorption isotherms to simultaneous biosorption ofiron (III) and chromium (VI) on Chlorella vulgaris, J. Chem.Tech. Biotechnol. 70 (1997) 368–378, doi: 4 368::AIDJCTB772 3.0.CO;2-Z.7. X. M. Liu, H. N. Liang, L. Li, T. T. Yang, Z. F. Yan, Preparationof Ultrafine Y Zeolite from Spent Fluid Catalytic CrackingCatalyst Powders, Chin. J. Catal. 31 (2010) 833–838, . X. M. Liu, L. Li, T. T. Yang, Z. F. Yan, Zeolite Y synthesizedwith FCC spent catalyst fines: particle size effect on catalyticreactions, J. Porous Mater. 19 (2012) 133–139, doi: https://doi.org/10.1007/s10934-011-9534-1.9. N. S. Japtiwale, Spent fluidized cracking catalyst (FCC) – Apotential adsorbent for heavy metals, Dissertations & Theses – Gradworks, 2013, url: rid 4c58f4dcac077c5eabc9a81b1857a817&site xueshu se.10. Y. Al-Degs, M. A. M. Khraisheh, M. F. Tutunji, Sorption oflead ions on diatomite and manganese oxides modified diatomite, Wat. Res. 35 (2001) 3724–3728, doi: https://doi.org/10.1016/S0043-1354(01)00071-9.11. A. Mellah, H. Chegrouche, The removal of zinc from aqueous solutions by natural bentonite, Wat. Res. 31 (1997) 621–629, doi: https://doi.org/10.1016/S0043-1354(96)00294-1.12. S.-H. Lin, R.-S. Juang, Heavy metal removal from waterby sorption using surfactant-modified montmorillonite,J. Hazard. Mater. B92 (2002) 315–326, doi: https://doi.org/10.1016/s0304-3894(02)00026-2.13. Y. Turhan, P. Turan, M. Dogan, M. Alkan, H. Nammli, Ö.Demirbas, Characterization and adsorption properties ofchemically modified sepiolite, Ind. Eng. Chem. Res. 47(2008) 1883–1895, doi: https://doi.org/10.1021/ie070506r.14. A. J. Adams, G. E. Hawkes, E. H. Curzon, A solid state 29Sinuclear magnetic resonance study of opal and other hydroussilica, Am. Minerals 75 (1991) 1863–1987.
208S.-Q. ZHENG et al.: Adsorption of Cu2 , Zn2 , and Ni2 Ions onto the Adsorbent Prepared from ., Kem. Ind. 68 (5-6) (2019) 201–208SAŽETAKAdsorpcija Cu2 , Zn2 i Ni2 iona na adsorbenspripremljen iz potrošenog FCC katalizatora i kremenih diatomitaShu-Qin Zheng,a,b,* Si-Cheng Liu,a Pei-Qing Zhang,a Cheng Yang a i Ting Wang aIspitivan je adsorbens pripremljen iz katalizatora za katalitičko krekiranje u vrtložnom sloju (FCC) idiatomita, te njegova adsorpcija iona Cu2 , Zn2 i Ni2 . Adsorbens je karakteriziran XRD, SEM i N2adsorpcijsko-desorpcijskim tehnikama. Rezultati su pokazali da se specifična površina i volumenpora adsorbensa povećavaju s povećanjem količine potrošenog katalizatora FCC. Proučavani sučimbenici utjecaja na adsorpciju adsorbensa. Prikladni uvjeti adsorpcije bili su: pH vrijednost 5,0,omjer čvrste tvari i kapljevine 1 : 600 (g:ml), vrijeme adsorpcije 4 h i sobna temperatura. Adsorpcija metalnih iona varira s tipom metalnih kationa. Adsorpcijske izoterme pokazale su da je slijedučinkovitosti adsorpcije Cu2 Zn2 Ni2 . Količina metalnih iona Cu2 , Zn2 i Ni2 adsorbiranihna adsorbensu iznosila je 49,17 mg g 1, 46,83 mg g 1, odnosno 35,72 mg g 1. Podatci o adsorpcijiiona Cu2 , Zn2 i Ni2 slijede model Freundlichove adsorpcijske izoterme.Ključne riječiAdsorpcija, ion teških metala, potrošeni FCC katalizator, diatomitDepartment of Chemistry and ChemicalEngineering, Hunan Institute of Science andTechnology, Yueyang 414 000, Hunan, KinabHunan Province Key Laboratory of SpecialityPetrochemicals Catalysis and Separation,Yueyang 414 000, Hunan, KinaaStručni radPrispjelo 13. rujna 2018.Prihvaćeno 3. prosinca 2018.
umes were measured on an ASAP 2020 sorptometer us-ing adsorption and desorption isotherm plots at 196 C, and the samples were out-gassed at 90 C for 1 h, and at . fraction peak between 18 and 28 degrees of 2θ, indicat-ing that the internal structure in the diatomite was highly disordered, which was basically consistent with the XRD .

![[CLASS XII CHEMISTRY PRACTICALS]](/img/23/xii-chemistry-practical.jpg)