Transcription
FAQ’s How much TV do Canadians watch?Canadians watch 23.7 hours of TV per week? I’ve heard young people don’t watch TV – is that true?No. Adults 18-34 watch 10 hours of TV per week (most of it live) What is TV’s reach?TV reaches 89% of Canadian adults every week. How much TV is watched live?87% of linear TV viewing is live (also 87% for A18-34) How does time spent watching TV compare to time spent withYouTube?TV far exceeds time spent on YouTube: A18 watch 5x more TVthan YouTube, and A18-34 watch 50% more TV than YouTube*(*YouTube time spent includes listening to music) How does time spent watching TV compare to Social Media?TV dwarfs time spent with social media: A18 spend 8x more andA18-34 spend twice as much time watching TV than they spendon social media* (*Facebook Snapchat Instagram Twitter TikTok) How many impressions does a TV campaign deliver?The average TV campaign delivers an astounding 337 millionimpressions.How many people have TV subscriptions?Over 10.5 Million HHs have TV subscriptions (down only 1% from PY)Everyone multitasks these days – are people even payingattention to TV ads?Yes – more than any other type of advertisingDo TV Digital work together?TV and digital make a great combo – in fact TV will improve theperformance of your digital media by an average 19%Does TV have a good ROI?TV has the best sales ROI of any medium, delivering a 14.34return on each media dollar spent (and 23.40 if you extend theperiod from 1 to 4 years)These numbers don’t ring true to me - what sources do you use?We use accredited, third-party sources, including Numeris,Comscore, and many others. No walled gardens, just the facts.1
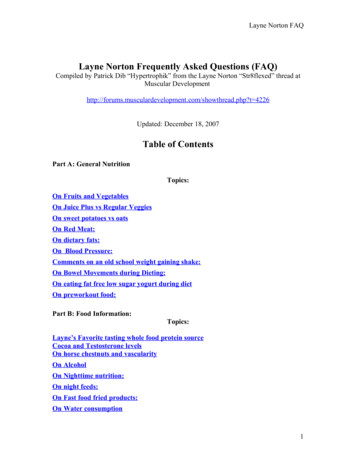
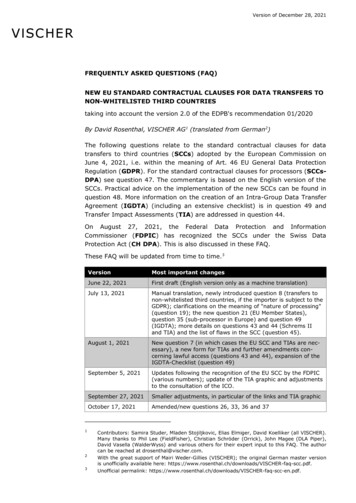
Canadians watch a lot ofAV E R A G E W E E K LY H O U R SADULTS 18 ADULTS 18-3423.7 **10.1 *6.84.81.70.50.1Total TV YouTube Facebook Instagram Snapchat* 87% of A18 TV viewing is LIVETotal Canada Fall 20200.50.1TikTokTwitter1.61.30.4Total TV YouTube Facebook Instagram Snapchat1.1TikTok0.2Twitter* 87% of A18-34 TV viewing is LIVE2
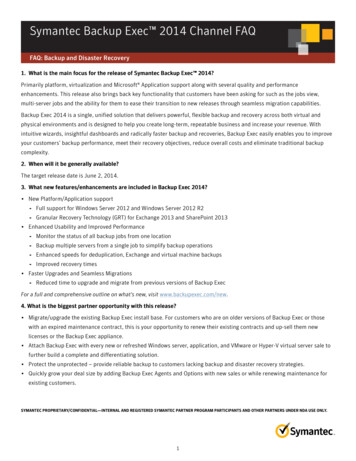
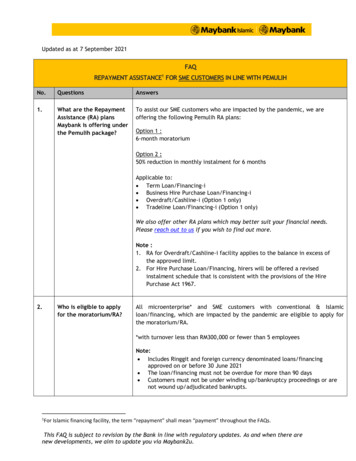
tv reaches27,221,000Canadians every dayweekly reach89%adults (18 )Total Canada Fall 202078%adults (18-34)80%kids (2-11)3
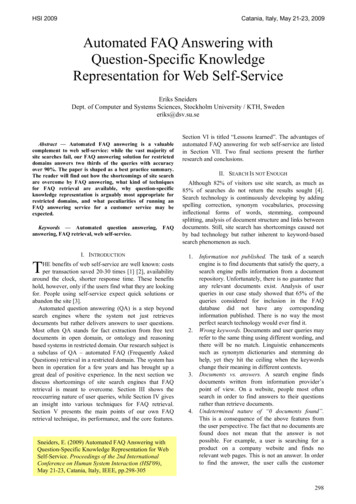
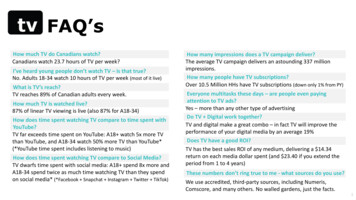
87% of linear tv viewing is liveeven among young adults, 87% of TV viewing is live; 93% is live same day playbackLive TV vs PlaybackT O TA L C A N A D A(% of Total TV Viewing)Live87Individuals 2 PB Same Day633PB 1 DayPB 2-7 DaysSource: Numeris PPM, Total Canada, Total TV, All Locations, M-Su 2a-2a, Sept 14 to Dec 20, 2020, PB Playback87A18-346434
time spentwith tv yesterdayaveragecampaign delivers115 million 337 millionhoursTotal Canada Fall 2020impressions5
10.5 million Canadian HH’s have a paid TV subscriptionCord cutting has been far overstated: total subs are down less than 1%.The notion that “no millennials subscribe to TV” is also false: 57% of 18-34 year olds subscribe to TV, and they’re alsoaccessing linear TV out-of-home and via streaming (which is how TV is able to reach 78% of A18-34 on a weekly basis).Jan ‘20Total SubscribersBasic/Digital Cable10,548,341 10,483,4365,634,299IndexTV 23,95399.4OtherTotal CanadaJan ‘212021Basic/Digital Cable30%53%DTHTelco/IPTV17%6
Canadians pay most attention to ads onQ. Which one of the following media carries video advertising that best captures your attention?51%24%20%*Don’t know 4%Total Canada Feb 2020, Adults 18 , TV TV in all its forms; Live, On Demand, OnlineTVOnline VideoSocial Media
TV improves digital’s performanceTV has a significant halo effect on digital media, increasingits sales ROI by 19%Standalone Digital ROI-19%Source: Canadian Media Attribution StudyWithout TV’shalo effect, digitaladvertising’saverage ROI woulddecline by 19%.TV’s Adjusted ROI 23%
TV delivers the best ROITV’s ROI is 14.34 for every dollar spentATTRIBUTED SALES ROI BY MEDIA CHANNEL OVER A ONE YEAR PERIOD 14.34 13.52 12.71 11.79 11.45 9.99 6.95Overall% of MediaSpending:Source: Canadian Media Attribution StudyTVDisplay & Other42%18%Paid Search14%Paid SocialSFVCOther Media6%2%18%9
TV delivers the best ROIIn the long term, TV’s ROI grows to 23.40 23.40ATTRIBUTED SALES ROI BY MEDIA CHANNEL (OVER 4 YEARS) 20.21 15.20 13.10 14.32 9.49MULTIPLATFORM TV% of MediaSpending:42%Display & OtherSearchSocialSFVCOther Media18%14%6%2%18%Source: Peak Performance: Driving Advertising Effectiveness That Lasts
digital companies knowworks!TV spend by internet-related products & services* is up over 2.7x since 2015YEAR-OVER-YEAR % INCREASETV SPEND BY INTERNET BUSINESSES 28% 37% 17%20152016 30%201720182019Companieslike:*full list available here:Source: Total Canada/Annual/Numerator Canada11
trusted sourcesNumeris is an audited, transparent, tripartite, not-for-profit Canadian Broadcastindustry measurement organization, whose voting members include Advertisers,Agencies and Broadcasters. How it works: All Canadian television signals (and many USborder stations) are encoded with a distinct audio tone. Viewing data is collectedthrough a personal portable passive meter on a minute by minute basis, 24 hours perday, 365 days per year. The PPM device captures Live and Playback viewing (when thesound is on) both In and Out of the home, as well as live streamed content on PC’s andmobile devices. Data is downloaded and verified on a daily basis. The data collection ispanel-based and includes 11,000 Canadians (4,560 households). The panel isstatistically significant and balanced to the population through StatsCan censusdata. Homes included in the panel include those with paid subscriptions (cable,satellite, IPTV) as well as internet only homes.Supplementing the 2 main audience measurement services, we alsoaccess information from a number of other research studies andmeasurement sources, including:AccentureNlogicARF (Advertising ResearchFoundation), memberMedia StatsBrainsightsCRTCEbiquityIPA (Institute of Practitioners inAdvertising)Comscore is a global third party Digital measurement organization that measuressecond by second data interactions across Desktop and Mobile devices (regardless ofwhether the sound is on or off). Data is captured continuously, collected from a censusbased panel of 40,000 Canadians, and reported on a monthly basis.IpsosMRC (Media Ratings Council)NielsenNumeratorRTSStatistics CanadaWARC12
in case you missed itcheck out these additional research reportsthe 10 key factors driving advertisingeffectivenessad nationIpsos CanadaPeak Performance: AdvertisingEffectiveness that LastsWhat has Mark Ritson, the outspoken marketingconsultant and industry pundit, learned from his reviewof 50 years of Effie winners? In this highly engaging andinformative talk, Mark outlines the 10 key factors thatdrive advertising effectiveness.This new research, conducted by Ipsos andcommissioned by thinktv, identifies how the mediahabits of the advertising and media communities differfrom the rest of Canada, and how those differencesimpact our assumptions of general media usage.Accenture assessed 700M of media spend in Canada,covering 105 brands across four verticals. The researchclearly outlines the ways different advertising channelsimpact sales, what that impact is in the short and longterm, and how TV and digital work together.learn more »learn more »learn more »effectiveness in contexttarget the (whole) marketonline businesses on tvPeter Field’s latest report explores the damage beingdone as companies increasingly cut long-term brandinvestment in favour of short-term sales activation, andhighlights how the “60/40 rule” changes depending onthe context.Byron Sharp famously challenged a number oftraditionally held beliefs in his ground-breaking book'How Brands Grow'. We commissioned MediaComBusiness Science to examine Sharp's best practices andhow they apply in Canada.Digital companies continue to invest heavily in TVadvertising. TV spend by internet-related companies isup 30% from last year.learn more »learn more »learn more »learn more »13
reach us @info@thinktv.ca@thinktvcathinktv.ca
SourcesSlide 2:Total TV, Live TV, PVR: Numeris PPM, Total Canada, All Locations, Mo-Su 2a-2a, Sept 14, 2020-Dec 20, 2020 (Weeks 3-16) Facebook.com, Instagram.com,Twitter.com, TikTok.com, Snapchat, Inc.: comScore Media Metrix Multi-Platform, Canada, Sept to Nov 2020 YouTube: comScore Video Metrix MultiPlatform, Canada, Total Video, Sept to Nov 2020 (Note: Numeris population estimates used to calculate average weekly hours per capita for digitalmedia)Slide 3:Numeris, PPM, Total Canada, Consolidated, All Locations, , Sept 14, 2020-Dec 20, 2020 (Weeks 3-16)Slide 4:Numeris, PPM, Total Canada, Total TV, All Locations, M-Su 2a-2a, Fall 2020, Sept 14, 2020-Dec 20, 2020 (Weeks 3-16)Slide 5:Numeris, PPM, Total Canada, Consolidated, All Locations, Mo-Su 2a-2a, Sept 14, 2020-Dec 20, 2020 TV campaign based on a 900 GRP campaign (6 weeksx150 GRPs), Sept 14, 2020-Dec 20, 2020, Total Canada, Ind. 2 , Numeris 2020-21 population estimates.Slide 6:Mediastats, Total Canada, Jan. 2020, Jan. 2021, BDU Profile Report, CTAM 2020, Numeris, PPM, Total Canada, Total TV, All Locations, M-Su 2a-2a, Fall 2020,Sept 14, 2020-Dec 20, 2020 (Weeks 3-16)Slide 7:thinktv, nlogic, omniVu National survey Attention in Advertising, Feb 2020 (Don’t Know/Refuse not included).Slides 8-10:Accenture, Peak Performance: Driving Advertising Effectiveness That Lasts, 2020; Accenture Strategy attribution study, The Moneyball Moment forMarketing in Canada; January 2019Slide 11:Numerator, Canada, Internet related sites & services category; for full list of companies contact thinktvFor more TV and advertising related experience, check out The Power of TV in an Attention Economy
Canadians watch 23.7 hours of TV per week? No. Adults 18-34 watch 10 hours of TV per week (most of it live) TV reaches 89% of Canadian adults every week. 87% of linear TV viewing is live (also 87% for A18-34) TV far exceeds time spent on YouTube: A18 watch 5x more TV than YouTube, and A18-34 watch 50% more TV than YouTube*