Transcription
A Handbook ofStatisticalAnalysesusingStataThird Edition 2004 by CRC Press LLC
A Handbook ofStatisticalAnalysesusingStataThird EditionSophia Rabe-HeskethBrian EverittCHAPMAN & HALL/CRCA CRC Press CompanyBoca Raton London New York Washington, D.C. 2004 by CRC Press LLC
Library of Congress Cataloging-in-Publication DataRabe-Hesketh, S.A handbook of statistical analyses using Stata / Sophia Rabe-Hesketh, Brian S. Everitt.—[3rd ed.].p. cm.Includes bibliographical references and index.ISBN 1-58488-404-5 (alk. paper)1. Stata. 2. Mathematical statistics—Data processing. I. Everitt, Brian. II. Title.QA276.4.R33 2003519.5′0285′5369—dc222003065361This book contains information obtained from authentic and highly regarded sources. Reprinted materialis quoted with permission, and sources are indicated. A wide variety of references are listed. Reasonableefforts have been made to publish reliable data and information, but the author and the publisher cannotassume responsibility for the validity of all materials or for the consequences of their use.Neither this book nor any part may be reproduced or transmitted in any form or by any means, electronicor mechanical, including photocopying, microfilming, and recording, or by any information storage orretrieval system, without prior permission in writing from the publisher.The consent of CRC Press LLC does not extend to copying for general distribution, for promotion, forcreating new works, or for resale. Specific permission must be obtained in writing from CRC Press LLCfor such copying.Direct all inquiries to CRC Press LLC, 2000 N.W. Corporate Blvd., Boca Raton, Florida 33431.Trademark Notice: Product or corporate names may be trademarks or registered trademarks, and areused only for identification and explanation, without intent to infringe.Visit the CRC Press Web site at www.crcpress.com 2004 by CRC Press LLCNo claim to original U.S. Government worksInternational Standard Book Number 1-58488-404-5Library of Congress Card Number 2003065361Printed in the United States of America 1 2 3 4 5 6 7 8 9 0Printed on acid-free paper 2004 by CRC Press LLC
PrefaceStata is an exciting statistical package that offers all standard andmany non-standard methods of data analysis. In addition to generalmethods such as linear, logistic and Poisson regression and generalizedlinear models, Stata provides many more specialized analyses, such asgeneralized estimating equations from biostatistics and the Heckmanselection model from econometrics. Stata has extensive capabilities forthe analysis of survival data, time series, panel (or longitudinal) data,and complex survey data. For all estimation problems, inferences canbe made more robust to model misspecification using bootstrapping orrobust standard errors based on the sandwich estimator. In each newrelease of Stata, its capabilities are significantly enhanced by a team ofexcellent statisticians and developers at Stata Corporation.Although extremely powerful, Stata is easy to use, either by pointand-click or through its intuitive command syntax. Applied researchers,students, and methodologists therefore all find Stata a rewarding environment for manipulating data, carrying out statistical analyses, andproducing publication quality graphics.Stata also provides a powerful programming language making it easyto implement a ‘tailor-made’ analysis for a particular application or towrite more general commands for use by the wider Stata community.In fact we consider Stata an ideal environment for developing and disseminating new methodology. First, the elegance and consistency ofthe programming language appeals to the esthetic sense of methodologists. Second, it is simple to make new commands behave in everyway like Stata’s own commands, making them accessible to applied researchers and students. Third, Stata’s emailing list Statalist, The StataJournal, the Stata Users’ Group Meetings, and the Statistical SoftwareComponents (SSC) archive on the internet all make exchange and discussion of new commands extremely easy. For these reasons Stata is 2004 by CRC Press LLC
constantly kept up-to-date with recent developments, not just by itsown developers, but also by a very active Stata community.This handbook follows the format of its two predecessors, A Handbook of Statistical Analysis using S-PLUS and A Handbook of StatisticalAnalysis using SAS. Each chapter deals with the analysis appropriatefor a particular application. A brief account of the statistical background is included in each chapter including references to the literature, but the primary focus is on how to use Stata, and how to interpretresults. Our hope is that this approach will provide a useful complement to the excellent but very extensive Stata manuals. The majorityof the examples are drawn from areas in which the authors have mostexperience, but we hope that current and potential Stata users fromoutside these areas will have little trouble in identifying the relevanceof the analyses described for their own data.This third edition contains new chapters on random effects models, generalized estimating equations, and cluster analysis. We havealso thoroughly revised all chapters and updated them to make use ofnew features introduced in Stata 8, in particular the much improvedgraphics.Particular thanks are due to Nick Cox who provided us with extensive general comments for the second and third editions of our book,and also gave us clear guidance as to how best to use a number of Statacommands. We are also grateful to Anders Skrondal for commentingon several drafts of the current edition. Various people at Stata Corporation have been very helpful in preparing both the second and thirdeditions of this book. We would also like to acknowledge the usefulnessof the Stata Netcourses in the preparation of the first edition of thisbook.All the datasets can be accessed on the internet at the followingWeb sites: http://www.stata.com/texts/stas3 tataBook.shtmlS. Rabe-HeskethB. S. EverittLondon 2004 by CRC Press LLC
DedicationTo my parents, Birgit and Georg RabeSophia Rabe-HeskethTo my wife, Mary ElizabethBrian S. Everitt 2004 by CRC Press LLC
Contents1A Brief Introduction to Stata1.11.21.31.41.51.61.71.81.91.101.111.122Data Description and Simple Inference: FemalePsychiatric Patients2.12.22.32.43Description of dataGroup comparison and correlationsAnalysis using StataExercisesMultiple Regression: Determinants of Pollution inU.S. Cities3.13.23.33.44Getting help and informationRunning StataConventions used in this bookDatasets in StataStata commandsData managementEstimationGraphicsStata as a calculatorBrief introduction to programmingKeeping Stata up to dateExercisesDescription of dataThe multiple regression modelAnalysis using StataExercisesAnalysis of Variance I: Treating Hypertension 2004 by CRC Press LLC
4.14.24.34.45Analysis of Variance II: Effectiveness of SlimmingClinics5.15.25.35.46Description of dataGeneralized linear modelsAnalysis using StataExercisesSummary Measure Analysis of Longitudinal Data:The Treatment of Post-Natal Depression8.18.28.38.49Description of dataThe logistic regression modelAnalysis using StataExercisesGeneralized Linear Models: Australian SchoolChildren7.17.27.37.48Description of dataAnalysis of variance modelAnalysis using StataExercisesLogistic Regression: Treatment of Lung Cancerand Diagnosis of Heart Attacks6.16.26.36.47Description of dataAnalysis of variance modelAnalysis using StataExercisesDescription of dataThe analysis of longitudinal dataAnalysis using StataExercisesRandom Effects Models: Thought disorder andschizophrenia9.19.29.39.49.5Description of dataRandom effects modelsAnalysis using StataThought disorder dataExercises10 Generalized Estimating Equations: EpilepticSeizures and Chemotherapy10.1 Introduction10.2 Generalized estimating equations 2004 by CRC Press LLC
10.3 Analysis using Stata10.4 Exercises11 Some Epidemiology11.111.211.311.4Description of dataIntroduction to epidemiologyAnalysis using StataExercises12 Survival Analysis: Retention of Heroin Addicts inMethadone Maintenance Treatment12.112.212.312.4Description of dataSurvival analysisAnalysis using StataExercises13 Maximum Likelihood Estimation: Age of Onset ofSchizophrenia13.113.213.313.4Description of dataFinite mixture distributionsAnalysis using StataExercises14 Principal Components Analysis: HearingMeasurement using an Audiometer14.114.214.314.4Description of dataPrincipal component analysisAnalysis using StataExercises15 Cluster Analysis: Tibetan Skulls and AirPollution in the USA15.115.215.315.4Description of dataCluster analysisAnalysis using StataExercisesAppendix: Answers to Selected ExercisesReferences 2004 by CRC Press LLC
Distributors for StataThe distributor for Stata in the United States is:Stata Corporation4905 Lakeway DriveCollege Station, TX 77845email: stata@stata.comWeb site: http://www.stata.comTelephone: 979-696-4600In the United Kingdom the distributor is:Timberlake ConsultantsUnit B3, Broomsleigh Business ParkWorsley Bridge RoadLondon SE26 5BNemail: info@timberlake.co.ukWeb site: http://www.timberlake.co.ukTelephone: 44(0)-20-8697-3377For a list of distributors in other countries, see the Stata Web page. 2004 by CRC Press LLC
Chapter 1A Brief Introduction toStata1.1Getting help and informationStata is a general purpose statistics package developed and maintainedby Stata Corporation. There are several forms or ‘flavors’ of Stata,‘Intercooled Stata’, the more limited ‘Small Stata’ and the extended‘Stata/SE’ (Special Edition), differing mostly in the maximum size ofdataset and processing speed. Each exists for Windows (98, 2000,XP, and NT), Unix platforms, and the Macintosh. In this book, wewill describe Intercooled Stata for Windows although most features areshared by the other flavors of Stata.The base documentation set for Stata consists of seven manuals:Stata Getting Started, Stata User’s Guide, Stata Base Reference Manuals (four volumes), and Stata Graphics Reference Manual. In additionthere are more specialized reference manuals such as the Stata Programming Reference Manual and the Stata Cross-Sectional Time-SeriesReference Manual (longitudinal data analysis). The reference manualsprovide extremely detailed information on each command while theUser’s Guide describes Stata more generally. Features that are specific to the operating system are described in the appropriate GettingStarted manual, e.g., Getting Started with Stata for Windows.Each Stata command has associated with it a help file that may beviewed within a Stata session using the help facility. Both the help-filesand the manuals refer to the Base Reference Manuals by [R] name ofentry, to the User’s Guide by [U] chapter or section number andname, the Graphics Manual by [G] name of entry, etc. (see Stata 2004 by CRC Press LLC
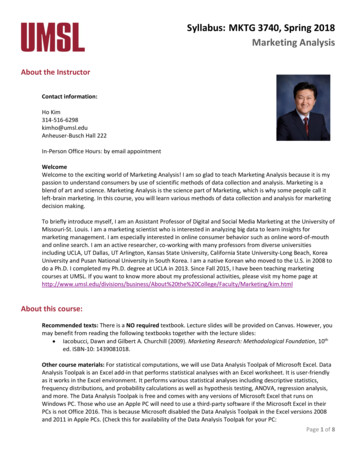
Getting Started manual, immediately after the table of contents, for acomplete list).There are an increasing number of books on Stata, including Hamilton (2004) and Kohler and Kreuter (2004), as well as books in German,French, and Spanish. Excellent books on Stata for particular typesof analysis include Hills and De Stavola (2002), A Short Introductionto Stata for Biostatistics, Long and Freese (2003), Regression Modelsfor Categorical Dependent Variables using Stata, Cleves, Gould andGutierrez (2004), An Introduction to Survival Analysis Using Stata,and Hardin and Hilbe (2001), Generalized Linear Models and Extensions. See http://www.stata.com/bookstore/statabooks.html forup-to-date information on these and other books.The Stata Web page at http://www.stata.com offers much useful information for learning Stata including an extensive series of ‘frequently asked questions’ (FAQs). Stata also offers internet courses,called netcourses. These courses take place via a temporary mailinglist for course organizers and ‘attenders’. Each week, the course organizers send out lecture notes and exercises which the attenders candiscuss with each other until the organizers send out the answers to theexercises and to the questions raised by attenders.The UCLA Academic Technology Services offer useful textbook andpaper examples at http://www.ats.ucla.edu/stat/stata/, showinghow analyses can be carried out using Stata. Also very helpful forlearning Stata are the regular columns From the helpdesk and SpeakingStata in The Stata Journal; see www.stata-journal.com.One of the exciting aspects of being a Stata user is being part ofa very active Stata community as reflected in the busy Statalist mailing list, Stata Users’ Group meetings taking place every year in theUK, USA and various other countries, and the large number of usercontributed programs; see also Section 1.11. Statalist also functions asa technical support service with Stata staff and expert users such asNick Cox offering very helpful responses to questions.1.2Running StataThis section gives an overview of what happens in a typical Stata session, referring to subsequent sections for more details.1.2.1Stata windowsWhen Stata is started, a screen opens as shown in Figure 1.1 containingfour windows labeled: 2004 by CRC Press LLC
Stata CommandStata ResultsReviewVariablesFigure 1.1: Stata windows.Each of the Stata windows can be resized and moved around in theusual way; the Variables and Review windows can also be moved outside the main window. To bring a window forward that may be obscured by other windows, make the appropriate selection in the Window menu. The fonts in a window can be changed by clicking on theon the top left of that window’s menu bar. All thesemenu buttonsettings are automatically saved when Stata is closed.1.2.2DatasetsStata datasets have the .dta extension and can be loaded into Stata inthe usual way through the File menu (for reading other data formats; 2004 by CRC Press LLC
see Section 1.4.1). As in other statistical packages, a dataset is a matrixwhere the columns represent variables (with names and labels) andthe rows represent observations. When a dataset is open, the variablenames and variable labels appear in the Variables window. The datasetmay be viewed as a spreadsheet by opening the Data Browser withbutton and edited by clickingto open the Data Editor.theBoth the Data Browser and the Data Editor can also be opened throughthe Window menu. Note however, that nothing else can be done inStata while the Data Browser or Data Editor are open (e.g. the StataCommand window disappears). See Section 1.4 for more informationon datasets.1.2.3Commands and outputUntil release 8.0, Stata was entirely command-driven and many usersstill prefer using commands as follows: a command is typed in the StataCommand window and executed by pressing the Return (or Enter) key.The command then appears next to a full stop (period) in the StataResults window, followed by the output.If the output produced is longer than the Stata Results window,--more-- appears at the bottom of the screen. Pressing any key scrollsthe output forward one screen. The scroll-bar may be used to move upand down previously displayed output. However, only a certain amountof past output is retained in this window. For this reason and to saveoutput for later, it is useful to open a log file; see Section 1.2.6.Stata is ready to accept a new command when the prompt (a period)appears at the bottom of the screen. If Stata is not ready to receivenew commands because it is still running or has not yet displayed allthe current output, it may be interrupted by holding down Ctrl and.pressing the Pause/Break key or by pressing the red Break buttonA previous command can be accessed using the PgUp and PgDnkeys or by selecting it from the Review window where all commandsfrom the current Stata session are listed (see Figure 1.1). The commandmay then be edited if required before pressing Return to execute thecommand.Most Stata commands refer to a list of variables, the basic syntaxbeing command varlist. For example, if the dataset contains variablesx, y, and z, thenlist x ylists the values of x and y. Other components may be added to thecommand; for example, adding if exp after varlist causes the com- 2004 by CRC Press LLC
mand to process only those observations satisfying the logical expression exp. Options are separated from the main command by a comma.The complete command structure and its components are described inSection 1.5.1.2.4GUI versus commandsSince release 8.0, Stata has a Graphical User Interface (GUI) that allows almost all commands to be accessed via point-and-click. Simplystart by clicking into the Data, Graphics, or Statistics menus, makethe relevant selections, fill in a dialog box, and click OK. Stata thenbehaves exactly as if the corresponding command had been typed withthe command appearing in the Stata Results and Review windows andbeing accessible via PgUp and PgDn.A great advantage of the menu system is that it is intuitive so thata complete novice to Stata could learn to run a linear regression ina few minutes. A disadvantage is that pointing and clicking can betime-consuming if a large number of analyses are required and cannotbe automated. Commands, on the other hand, can be saved in a file(called a do-file in Stata) and run again at a later time. In our opinion,the menu system is a great device for finding out which command isneeded and learning how it works, but serious statistical analysis is bestundertaken using commands. In this book we therefore say very littleabout the menus and dialogs (they are largely self-explanatory afterall), but see Section 1.8 for an example of creating a graph through thedialogs.1.2.5Do-filesIt is useful to build up a file containing the commands necessary tocarry out a particular data analysis. This may be done using Stata’sDo-file Editor or any other editor. The Do-file Editor may be openedor by selecting Do. from the File menu. Commandsby clickingincan then be typed in and run as a batch either by clicking intothe Do-file Editor or by using the commanddo dofileAlternatively, a subset of commands can be highlighted and executed. The do-file can be saved for use in a future Stataby clicking intosession. See Section 1.10 for more information on do-files. 2004 by CRC Press LLC
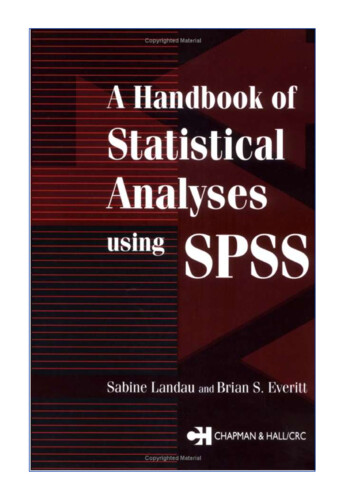
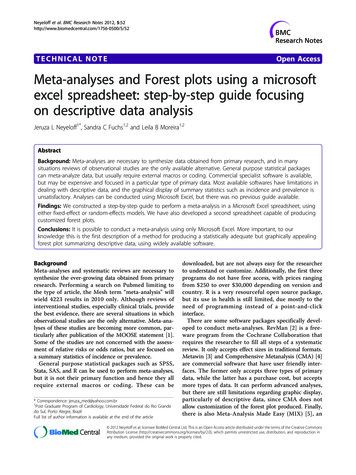
1.2.6Log filesIt is useful to open a log file at the beginning of a Stata session. Pressthe button, type a filename into the dialog box, and choose Save.By default, this produces a SMCL (Stata Markup and Control Language, pronounced ‘smicle’) file with extension .smcl, but an ordinaryASCII text file can be produced by selecting the .log extension. If thefile already exists, another dialog opens to allow you to decide whetherto overwrite the file with new output or to append new output to theexisting file.The log file can be viewed in the Stata Viewer during the Statasession (again through) and is automatically saved when it is closed.Log files can also be opened, viewed, and closed by selecting Log fromthe File menu, followed by Begin., View., or Close. The followingcommands can be used to open and close a log file mylog, replacing theold one if it already exists:log using mylog, replacelog closeTo view a log file produced in a previous Stata session, select File Log View. and specify the full path of the log file. The log maythen be printed by selecting Print Viewer. from the File menu.1.2.7Getting helpHelp may be obtained by clicking on Help which brings up the menushown in Figure 1.2. To get help on a Stata command, assuming thecommand name is known, select Stata Command. To find theappropriate Stata command first, select Search. which opens upthe dialog in Figure 1.3. For example, to find out how to fit a Coxregression, type ‘survival’ under Keywords and press OK. This opensthe Stata Viewer containing a list of relevant command names or topicsfor which help files or Frequently Asked Questions (FAQs) are available.Each entry in this list includes a blue keyword (a hyperlink) that maybe selected to view the appropriate help file or FAQ. Each help filecontains hyperlinks to other relevant help files. The search and helpfiles may also be accessed using the commandssearch survivalhelp stcoxHelp will then appear in the Stata Results window instead of the StataViewer, where words displayed in blue also represent hyperlinks to other 2004 by CRC Press LLC
Figure 1.2: Menu for help.Figure 1.3: Dialog for search. 2004 by CRC Press LLC
files.If the computer running Stata is connected to the internet, you canalso search through materials on the internet, to find for instance usercontributed programs by selecting ‘Search net resources’ in the searchdialog. The final selection, ‘Search all’ performs a search across the helpfiles, FAQs, and net materials. This is equivalent to using the finditkeyword command. More refined searches can be carried out using thesearch command (see help search). The other selections in the helpdialog, News, Official Updates, SJ and User-written Programs,and Stata Web Site all enable access to relevant information on theWeb (see Section 1.11 on keeping Stata up-to-date).1.2.8Closing StataStata can be closed in three ways: 1.3click on the Close buttonat the top right-hand corner ofthe Stata screenselect Exit from the File menutype exit, clear in the Stata Commands window, and pressReturn.Conventions used in this bookIn this book we will use typewriter font like this for anything thatcould be typed into the Stata Command window or a do-file, that is,command names, options, variable names, etc. In contrast, italicizedwords are not supposed to be typed; they should be substituted byanother word. For example, summarize varname means that varnameshould be substituted by a specific variable name, such as age, givingsummarize age. We will usually display sequences of commands asfollows:summarize agedrop ageIf a command continues over two lines, we use /* at the end of the firstline and */ at the beginning of the second line to make Stata ignorethe linebreak. An alternative would be to use /// at the end of theline. Note that these methods are for use in a do-file and do not workin the Stata Command window where they would result in an error. Inthe Stata Command window, commands can wrap over several lines. 2004 by CRC Press LLC
Output taking very little space is displayed immediately followingthe commands but without indentation and in a smaller font:display 11Output taking up more space is shown in a numbered display floatingin the text. Some commands produce little notes, for example, thegenerate command prints out how many missing values are generated.We will usually not show such notes.1.41.4.1Datasets in StataData input and outputStata has its own data format with default extension .dta. Readingand saving a Stata file are straightforward. If the filename is bank.dta,the commands areuse banksave bankIf the data are not stored in the current directory, then the completepath must be specified, as in the commanduse c:\user\data\bankHowever, the least error-prone way of keeping all the files for a particular project in one directory is to change to that directory and save andread all files without their pathname:cd c:\user\datause banksave bankData supplied with Stata can be read in using the sysuse command.For instance, the famous auto.dta data can be read usingsysuse autoBefore reading a file into Stata, all data already in memory needto be cleared, either by running clear before the use command or byusing the option clear as follows: 2004 by CRC Press LLC
use bank, clearIf we wish to save data under an existing filename, this results in anerror message unless we use the option replace as follows:save bank, replaceFor large datasets it is sometimes necessary to increase the amountof memory Stata allocates to its data areas from the default of 1megabyte. For example, when no dataset is loaded (e.g., after issuing the command clear), set the memory to 2 megabytes usingset memory 2mThe memory command without arguments gives information on howmuch memory is being used and how much is available.If the data are not available in Stata format, they may be convertedto Stata format using another package (e.g., Stat/Transfer) or saved asan ASCII file (although the latter option means losing all the labels).When saving data as ASCII, missing values should be replaced by somenumerical code.There are three commands available for reading different types ofASCII data: insheet is for files containing one observation (on allvariables) per line with variables separated by tabs or commas, wherethe first line may contain the variable names; infile with varlist (freeformat) allows line breaks to occur anywhere and variables to be separated by spaces as well as commas or tabs; infix is for files withfixed column format but a single observation can go over several lines;infile with a dictionary (fixed format) is the most flexible commandsince the dictionary can specify exactly what lines and columns containwhat information.Data can be saved as ASCII using outfile or outsheet. Finally,odbc can be used to load, write, or view data from Open Data BaseConnectivity (ODBC) sources. See help infiling or [U] 24 Commands to input data for an overview of commands for reading data.Only one dataset may be loaded at any given time but a datasetmay be combined with the currently loaded dataset using the commandmerge or append to add observations or variables; see also Section 1.6.2.1.4.2VariablesThere are essentially two kinds of variables in Stata: string and numeric. Each variable can be one of a number of storage types that 2004 by CRC Press LLC
require different numbers of bytes. The storage types are byte, int,long, float, and double for numeric variables and str1 to str80(str244 in Stata/SE) for string variables of different lengths. Besidesthe storage type, variables have associated with them a name, a label,and a format. The name of a variable y can be changed to x usingrename y xThe variable label can be defined usinglabel variable x "cost in pounds"and the format of a numeric variable can be set to ‘general numeric’with two decimal places usingformat x %7.2gNumeric variablesA missing values in a numeric variable is represented by a period ‘.’(system missing values), or by a period followed by a letter, such as .a,.b. etc. Missing values are interpreted as very large positive numberswith . .a .b, etc. Note that this can lead to mistakes in logicalexpressions; see also Section 1.5.2. Numerical missing value codes (suchas ‘ 99’) may be converted to missing values (and vice versa) using thecommand mvdecode. For example,mvdecode x, mv(-99)replaces all values of variable x equal to 99 by periods andmvencode x, mv(-99)changes the missing values back to 99.Numeric variables can be used to represent categorical or continuousvariables including dates. For categorical variables it is not always easyto remember which numerical code represents which category. Valuelabels can therefore be defined as follows:label define s 1 married 2 divorced 3 widowed 4 singlelabel values marital sThe categories can also be recoded, for example 2004 by CRC Press LLC
recode marital 2/3 2 4 3merges categories 2 and 3 into category 2 and changes category 4 to 3.Dates are defined as the number of days since 1/1/1960 and canbe displayed using a date format such as %d. For example, listing thevariable time in %7.0g format giveslist timetime1.2.14976200which is not as easy to interpret asformat time %dlist timetime1.2.01jan200119jul1960See help dfmt for other date formats.String variablesString variables are typically used for categorical variables or identifiers and in some cases for dates (e.g., if the file was saved as an ASCIIfile from SPSS). In Stata, it is generally advisable to represent thesevariables by numeric variables, and conversion from string to numericis straightforward. A categorical string variable (or identifier) can beconverted to a numeric variable using the command encode which replaces each unique string by an integer and uses that string as the labelfor the corresponding integer value. The command decode converts thelabeled numeric variable back to a string variable.A string variable string1 representing dates can be converted tonumeric using the function date(string1, string2 ) where string2 is apermutation of "dmy" to specify the order of the day, month, and yearin string1. For example, the commands 2004 by CRC Press LLC
display date("30/1/1930","dmy")anddisplay date("january 30, 1930", "mdy")both return the negative value 10928 because the date is 10928 daysbefore 1/1/1960.1.5Stata commandsTyping help language gives the following generic command structurefor most Stata commands:[by varlist:] command [varlist] [ exp] [if exp] [in range][weight] [using filename] [, options]The help file contains links to information on each of the components,and we will briefly describe them here:[by varlist:] instructs Stata to repeat the command for each combination of values in the list of variables varlist.command is the name of the command and can often be abbreviated;for example, the command display can be abbreviated as dis.[varlist] is the list of variables to which the command applies.[ exp] is an expression.[if exp] restricts the command to that subset of the observations thatsatisfies the logical expression exp.[in range] restricts the command to those observations whose indiceslie in a particular range range.[weight] allows weights to be associated with observations (see Section 1.7).[using filename] specifies the filename to be used.[,options] a comma is only needed if options are used; options arespecific to the command and can often be abbreviated.For any given command, some of these components may not beavailable; for example, list does not allow [using filename]. The 2004 by CRC Press LLC
help files for specific commands specify which components are available, using the same notation as above, with squa
constantly kept up-to-date with recent developments, not just by its own developers, but also by a very active Stata community. This handbook follows the format of its two predecessors, A Hand- book of Statistical Analysis using S-PLUS and A Handbook of Statistical Analysis using SAS.