Transcription
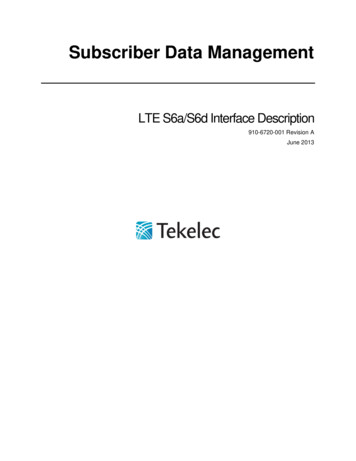
North American pay TV subscriber losses to slowThe number of pay TV subscribers in Canada and the US will fall by 43 millionfrom 116 million in the peak year of 2010 to 74 million in 2026. The US will lose41 million, with Canada down by nearly 2 million.North America pay TV subscribers by 0020,0000Pay ,317The number of pay TV subscribers plummeted by 27 million between 2010 and2020, down by 6 million in both 2019 and 2020. Pay TV penetration will drop from90.5% in 2010 to 53.6% by 2026.Simon Murray, Principal Analyst at Digital TV Research, said: “The worst of thecord-cutting is over. Declines will be lower from 2021, falling by 16 million in totalbetween 2020 and 2026. “Only” 5 million digital cable TV subscribers will be lost.Satellite TV will fall by 7.5 million and IPTV by 3.4 million subscribers.”Pay TV revenues peaked in 2015 at 111 billion. Revenues will fall by 49 billionto 62 billion in 2026.
North America Pay TV ForecastsTable of ContentsPublished in February 2021, this 66-page PDF, PowerPoint and excel report comesin three parts: Insight: Detailed country-by-country analysis in an 18-page PDF document.Outlook: Forecasts for Canada and the US in a 7-page PowerPointdocument full of charts, graphs and bullet points;Excel workbook covering each year from 2010 to 2026 for Canada and theUS by household penetration, by pay TV subscribers, by pay TV revenuesand by major operator. As well as summary tables by country and byplatform;For more information, please click here or contactlydia@digitaltvresearch.comForecasts for the following:CountryNo of opsPlatform forecastsCanada8USA8Rogers; Videotron; Cogeco; Shaw Communications; Shaw Direct; BellTV; Telus; Max TVComcast; Charter; Cox; Altice; U-Verse; DirecTV; Fios TV; DISHNetwork
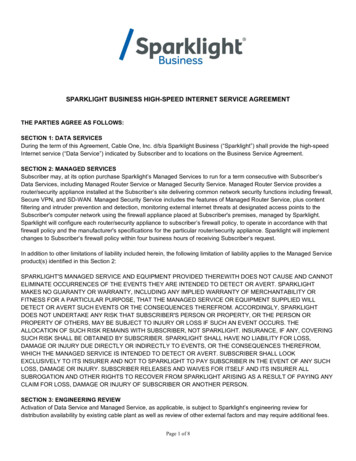
SAMPLE: Qatar pay TV insight Digital TV penetration reached 100% in 2015. About two-thirds of the 510,000TV households receive either free-to-air or pay satellite TV signals.Homes by platform (000)6005004003002001000A terresPay DTTFree DTTFree satellitePay SatelliteIPTVA CableD Revenues by platform ( m)80706050403020100Pay DTTPay SatelliteIPTVA CableD 0260373100Main assumptions behind the forecasts About 45% of homes receive FTA satellite TV signals and 21% pay to receive satellite TV signals.IPTV penetration is also high – at 30.9% by end-2020.Few homes rely on DTT signals.Source: Digital TV Research
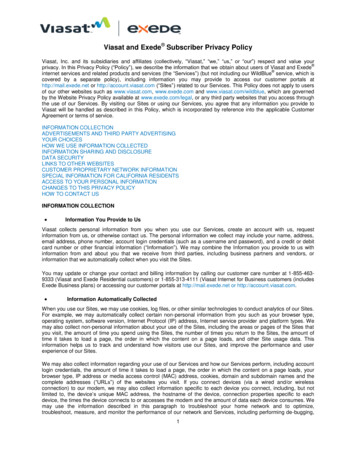
Pay TV subs by operator (000)300250200150100500OthersOoredooOSNbeIN 2601656344Pay TV penetration will remain at 52% of TV households. Pay TV revenueswill reach 68 million in 2026.Main operators by subscribers (000)OperatorbeINOoredooOSNVodafonePay TVsubs5215857-Fixed bbsubs-Mobilesubs2,97051,678Source: Digital TV ResearchSVOD platformsbeIN ConnectStarzPlay; OSN; beINOSN- The ongoing dispute between Saudi Arabia and Qatar hit beIN’s subscribernumbers across the region. beIN is reliant on subscriptions outside Qatar tothrive. Most governments have followed the Saudi ban on beIN – although notall of them have enforced the ban that effectively. The ban started in mid-2017 With 52,000 subs in Qatar by end-2020, beIN provides up to 67 channels. Weforecast that beIN will have 44,000 subscribers by 2026 - falling as fewer sportsrights are expected. We estimate 57,000 OSN subscribers by end-2020, with 63,000 by 2026. Aftera cost cutting drive and in preparation for an IPO in 2021, OSN is placing moreemphasis on its SVOD platform. OSN has exclusive deals with sevenHollywood studios, but wants to increase Arabic content to at least a quarter ofthe total. The Ooredoo TV IPTV platform (up to 190 channels, including bundles frombeIN, MBC and OSN) is offered as part of a triple-play package (up to 1Gbps).We estimated 158,000 subscribers at end-2020; climbing to 165,000 by 2026.In October 2015, Ooredoo has distribution deals with SVOD platforms OSN andStarzPlay (QAR30/month, 8,000 hours).
Ooredoo is investing QAR1 billion on an extensive fiber network (up to100Mbps). Ooredoo is responsible for constructing the government-ownedNational Broadband Network (QNBN). Ooredoo had 2.97 million mobilesubscribers by September 2020. Vodafone won the license for the second fixed line service in April 2010.Vodafone sold its stake to a local consortium in late 2018. Vodafone started itsGiga TV OTT platform in late 2019. Vodafone had 5,000 fixed broadband and1.68 million mobile subscribers by September 2020. State-owned Qatar Media Corporation, owner of Al Jazeera and FTA channelQatar TV, had upgraded the terrestrial network to DVB-T2 by December 2013.Full conversion took place in 2014.
Qatar pay TV forecastsPay Satellite TV/TV HHFree-to-air Satellite TV/TV HHAnalog terrestrial/TVHHPrimary FTA DTT/TV HHPrimary pay DTT/TV HHTVHH/Total HHDigital/TV HHAnalog/TV HHPay TV Subs/TV HHStand-alone digital cable subs(000)Dual-play digital cable subs(000)Triple-play digital cable subs(000)Stand-alone pay IPTV subs (000)Dual-play pay IPTV subs (000)Triple-play pay IPTV subs (000)Revenues (US million)Stand-alone digital cable revsDual-play digital cable TV revsTriple-play digital cable TV revsDigital cable TV subs revenuesDigital cable TV on-demand revsDigital cable TV revenuesAnalog cable TV subs revsCable TV revenues2026Pay IPTV subs/TV HH2025Analog cable subs/TV HH2024Digital cable subs/TV HH2023Pay TV subscribers (000)2022Analog homes (000)2021Digital homes (000)2020Primary Pay DTT hholds (000)2019Primary FTA DTT hholds (000)2018Analog terrestrial hholds (000)2017Free-to-air Satellite TV HH (000)2016Pay Satellite TV subs (000)2015Pay IPTV subscribers (000)2014Analog cable subs (000)2013Digital cable subs (000)2012TV households (000)20112010Total households (000)
Qatar pay TV forecastsStand-alone digital cable subsDual-play digital cable TV subsTriple-play digital cable TV subsAve digital cable (subs & VOD)Analog cable TV subsStand-alone IPTV subsDual-play IPTV subsTriple-play IPTV subsAverage IPTV (subs and VOD)Pay Satellite TV (subs)Pay Satellite TV (subs and PPV)Pay DTT (subs)Pay DTT (subs and PPV)Average monthly ARPUPay TV subscribers by operator (000)beIN (satellite)OSN (satellite)Ooredoo (IPTV)OthersShare of pay TV subs by operator %beIN (satellite)OSN (satellite)Ooredoo (IPTV)Others2026Average Revenue Per User (ARPU - US )2025Total revenues2024On-demand revenues2023Subscription revenues2022DTT revenues2021DTT on-demand revenues2020DTT subscription revs2019Satellite TV revenues2018Satellite TV on-demand revs2017Satellite TV subscription revs2016IPTV revenues2015IPTV on-demand revenues2014IPTV subscription revenues2013Triple-play IPTV revenues2012Dual-play IPTV revenues20112010Stand-alone IPTV revenues
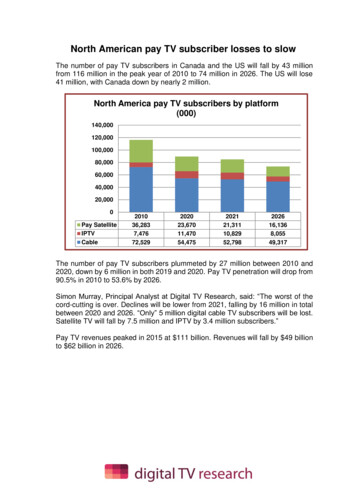
Qatar pay TV forecasts20262025Ooredoo (IPTV)2024OSN (satellite)2023beIN (satellite)2022Average Revenue Per User (ARPU - US )2021Others2020Ooredoo (IPTV)2019OSN (satellite)2018beIN (satellite)2017Share of pay TV revenues by operator %2016Others2015Ooredoo (IPTV)2014OSN (satellite)2013beIN (satellite)201220112010Subscription & VOD revenues (US million)
Digital TV Research publication schedule for 8293031TitleAfrica Pay TV ForecastsAfrica OTT TV and Video ForecastsMiddle East & North Africa Pay TV ForecastsMiddle East & North Africa OTT TV and VideoForecastsSVOD Platform Forecasts UpdateNorth America Pay TV ForecastsNorth America OTT TV and Video ForecastsLatin America Pay TV ForecastsLatin America OTT TV and Video ForecastsAsia Pacific Pay TV ForecastsAsia Pacific OTT TV and Video ForecastsEastern Europe Pay TV ForecastsEastern Europe OTT TV and Video ForecastsWestern Europe Pay TV ForecastsWestern Europe OTT TV and Video ForecastsGlobal OTT TV & Video ForecastsGlobal SVOD ForecastsGlobal Pay TV Subscriber ForecastsGlobal Pay TV Revenue ForecastsGlobal Pay TV Operator ForecastsGlobal AVOD ForecastsAfrica SVOD ForecastsMiddle East & North Africa SVOD ForecastsAsia Pacific SVOD ForecastsLatin America SVOD ForecastsNorth America SVOD ForecastsEastern Europe SVOD ForecastsWestern Europe SVOD ForecastsSVOD Forecasts UpdatePay TV Forecasts UpdateSVOD Platform Forecasts erDecember 800/ 880/ 960 1200/ 1320/ 1440 1200/ 1320/ 1440 1200/ 1320/ 1440 1200/ 1320/ 1440 600/ 660/ 720 600/ 660/ 720 1200/ 1320/ 1440 1200/ 1320/ 1440 1200/ 1320/ 1440 1200/ 1320/ 1440 1200/ 1320/ 1440 1200/ 1320/ 1440 1200/ 1320/ 1440 1200/ 1320/ 1440 1800/ 1980/ 2160 1600/ 1760/ 1920 1600/ 1760/ 1920 1600/ 1760/ 1920 1600/ 1760/ 1920 1600/ 1760/ 1920 1000/ 1200/ 1300 1000/ 1200/ 1300 1000/ 1200/ 1300 1000/ 1200/ 1300 500/ 600/ 650 1000/ 1200/ 1300 1000/ 1200/ 1300 1600/ 1760/ 1920 1600/ 1760/ 1920 800/ 880/ 960PLEASE CLICK HERE FOR MORE INFORMATION ON OUR LATESTPUBLICATIONSPLEASE CLICK HERE TO ACCESS OUR CORPORATE BROCHUREDiscounts are available for multiple report purchases and annualsubscriptions.Please contact lydia@digitaltvresearch.com
TV households receive either free-to-air or pay satellite TV signals. Main assumptions behind the forecasts About 45% of homes receive FTA satellite TV signals and 21% pay to receive satellite TV signals. IPTV penetration is also high - at 30.9% by end-2020. Few homes rely on DTT signals. Source: Digital TV Research