Transcription
WaterUtility AssetManagementA Guide forDevelopment Practitioners
2013 Asian Development BankAll rights reserved. Published in 2013.Printed in the Philippines.ISBN 978-92-9254-399-0 (Print), 978-92-9254-400-3 (PDF)Publication Stock No. TIM136104Cataloging-In-Publication DataAsian Development Bank.Water utility asset management: A guide for development practitioners.Mandaluyong City, Philippines: Asian Development Bank, 2013.1. Water management. 2. Water supply. I. Asian Development Bank.The views expressed in this publication are those of the authors and do not necessarily reflect the viewsand policies of the Asian Development Bank (ADB) or its Board of Governors or the governmentsthey represent.ADB does not guarantee the accuracy of the data included in this publication and accepts no responsibility forany consequence of their use.By making any designation of or reference to a particular territory or geographic area, or by using the term“country” in this document, ADB does not intend to make any judgments as to the legal or other status of anyterritory or area.ADB encourages printing or copying information exclusively for personal and noncommercial use withproper acknowledgment of ADB. Users are restricted from reselling, redistributing, or creating derivativeworks for commercial purposes without the express, written consent of ADB.Note:In this publication, “ ” refers to US dollars, unless otherwise stated.6 ADB Avenue, Mandaluyong City1550 Metro Manila, PhilippinesTel 63 2 632 4444Fax 63 2 636 2444www.adb.orgFor orders, please contact:Public Information CenterFax 63 2 636 2584adbpub@adb.orgPrinted on recycled paper
ContentsContentsiiiTables, Figures, and BoxesvAbbreviationsviBackground1Introduction to Asset Management3Chapter I: A Brief Overview of Asset ManagementA. Understand and Define Requirements1. Asset Policy2. Service Levels3. Demand Forecast4. Understanding Asset Base5. Asset Condition6. Identify Asset Risk55567789B. Develop Asset Management Life-Cycle Strategies1. Decision-Making Techniques2. Operational Strategies and Plans3. Maintenance Strategies and Plans4. Capital Works Strategies5. Financial and Funding Strategies111112131415C. Asset Management Enablers1. Teams2. Plans3. Systems4. Service Delivery Models5. Quality Management and Continuous Improvement151516161616D. Conclusion18iii
ivChapter II: Asset Management Case HistoriesA. Rawalpindi Water and Sanitation Agency, Rawalpindi, PakistanB. Davao City Water District, Davao, PhilippinesC. Barwon Water, State of Victoria, AustraliaD. National Water Supply and Drainage Board, Sri LankaE. Hai Phong Water Supply Company, Hai Phong, Viet Nam191920222325Chapter III: ADB Perspectives27Appendixes1. Computer-Based Asset Management Systems2. Asset Management Self-Diagnostic Guide3. Benchmarking323337
Tables, Figures, and BoxesTables123A2Cascading of Service-Level TargetsSimple Condition RankingExample of Risk RatingsAsset Management Self-Diagnostic Guide691033Figures12345678910111213Asset Management Explanation StructureIllustration of Asset Management System ModulesAsset Hierarchy for Classifying AssetsIllustration of Asset ConditionRisk Management ProcessComparative Life-Cycle Cumulative CostsIllustration of Life-Cycle Cost PatternMaintenance Management OverviewLaunching MaintenanceCapital Works OverviewSteps to Achieve ImprovementsAsset Management Problem AnalysisIndicative Design and Monitoring Framework5789101112131414172728Boxes123Asset Policy ExampleIndicative Terms of Reference for Consultants to Assistin an Asset Management Improvement ProjectAsset Management Issues and Proposed Solutions62930v
��——Davao City Water Districtgeographic information systemHai Phong Water Supply CompanyInternational Organization for StandardizationNational Water Supply and Drainage BoardRawalpindi Water and Sanitation Agency
BackgroundMany of today’s water utility managers face the challenge of cutting their unacceptably high levelsof nonrevenue water. Aside from decreasing revenue, money for investment, productivity, andservice delivery, nonrevenue water also increases the cost of the delivered water.In addition to reducing nonrevenue water, water utility managers must (i) raise their service levelscloser to 24 hours a day, 7 days a week, to meet the expectations of households, commerce, andindustry; (ii) expand distribution networks to cope with population growth; (iii) finance the timelyreplacement and maintenance of existing assets; and (iv) treat heavily polluted water.The way an organization manages its assets determines its success in addressing these challenges.A utility can improve and sustain the expected level of service, reduce water losses, cut unit costs,and fairly justify tariff rates if it knows what assets it has and needs, when and how to maintain orreplace those assets, and how the assets should be operated.This concept is easier stated than achieved. Policies, plans, practices, and systems need to be putin place and applied by skilled personnel who are committed to caring for assets and meetingservice standards.Better asset management is necessary because poor asset management leads to water losses that exceed industry good practice; less than 24/7 water supply service and frequent concerns over water quality; incomplete, inaccurate, and unreliable asset records; maintenance that mostly addresses breakdowns; minimal asset planning that is not based on sound analysis and records; and costs, and ultimately prices, that are higher than they should be.There is no single rapid solution to remedy poor asset management. Although some short-termactions can be taken to reduce nonrevenue water, tackling the underlying issue of poor assetmanagement requires a time frame of 3–7 years. It normally involves dealing with a considerablenumber of different assets, clearing a backlog of poor asset information, and effecting a changein system and attitudes.A sequence of steps is needed to address poor asset management. First, the utility’s commitmentto improve and its degree of decision-making autonomy must be assessed. This may be gauged byobserving evidence of other change activities and through discussions with management on theasset, staffing, or change decisions that require referral for approval to position holders outside theorganization. Second, the utility’s current asset management status needs to be established. Thereare a number of checklists and guidance manuals available to help undertake this step. Third,management buy-in for change must be obtained through workshops and senior managementmeetings to ensure that everyone shares the same way of thinking. Change plans will be developedat such workshops, based on the diagnosis, what is feasible within different time frames, andthe need to build more and more support. Fourth, the utility should form a change team, usually1
engaging an outside expert to help guide the implementation process, which will deal with(i) asset inventory and records, (ii) computer-based systems including geographic informationsystems (GIS), (iii) asset policies including acquisition and disposal, (iv) decision rules to addressasset criticality and risk, (v) asset planning, (iv) key performance indicators, and (v) operations andskills development.Good asset management involves most people in the organization. They need to carry on with theirdaily work while also tackling a substantial change program. Despite these significant barriers, thechange can and should be done to ensure utilities deliver promised services. Experience also showsthat a strong external regulator that monitors service delivery for the community can help sustaingood practices.This guide focuses on medium-sized and large operators. It discusses techniques that apply tosituations where asset types and conditions vary widely and in-house engineering and financialskills exist. The fundamentals, however, apply to all utilities. Asset management gives smallerutilities the opportunity to introduce good asset recording systems; ensure regular maintenance;identify critical assets; manage the risk of their breakdown; and measure asset performance,especially nonrevenue water, as an indicator of good asset management.The guide aims to provide a brief overview of the concept, processes, and systems of asset management, includingself-diagnosis to help utility managers and project designers identify change priorities(Chapter I); case studies about what utilities have done to manage their assets, including the resultsthey achieved or did not achieve (Chapter II); and extra project-relevant information to Asian Development Bank (ADB) staff about existingasset management projects, a sample design and monitoring framework, draft termsof reference for consultants, and a one-page handout to inform clients about assetmanagement (Chapter III).2
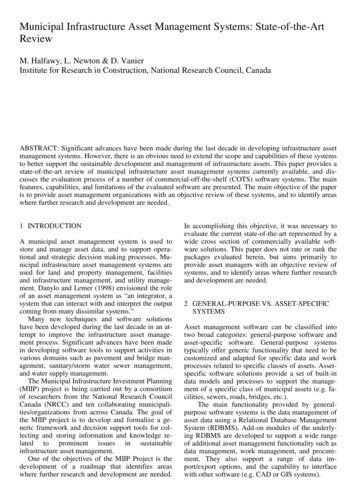
Introduction toAsset ManagementAsset management involves achieving the least cost and least risk of owning and operating assetsover their life cycle while meeting service standards for customers. Consequently, utility managersneed to put in place policies, plans, and strategies. They must also develop and implement a suiteof processes that cover asset acquisition, operation, maintenance, overhaul, and disposal. Assetmanagement also means applying tools that help make these processes effective, such as settingservice levels, computing life-cycle asset costs, maintaining an asset register, monitoring assetcondition and performance, and carrying out risk analysis of possible asset failure.Asset management for water utilities is more complex than for most other sectors because of thenumber, variety, age, condition, and location of assets; the magnitude of asset investment; andthe difficulty of inspecting and maintaining buried assets. This complexity is often compoundedby lack of finance, information, and skills that can impede acquiring, commissioning, maintaining,overhauling, and replacing assets at the optimum time.3
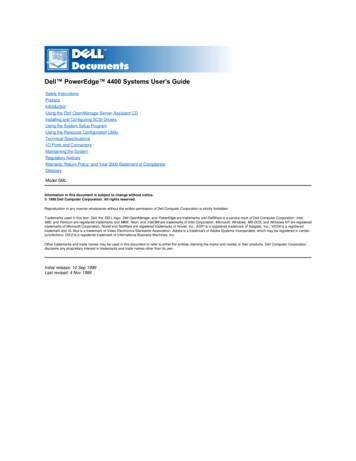
ChApTer IA Brief Overview ofAsset ManagementThis guide uses the International Infrastructure Management Manual structure to explain theessentials of asset management (Figure 1).Figure 1: Asset Management Explanation StructureUnderstand and DefineRequirements Develop policyDefine levels of serviceDefine indicatorsForecast demandUnderstand asset base(register) Assess asset condition Identify asset andbusiness riskDevelop Asset Life-CycleStrategies Financial and fundingstrategies Capital works strategies Maintenance strategiesand plans Operational strategiesand plans Decision-making techniquesAsset ManagementEnablers Asset management teamsAsset management plansInfo systemsAsset managementservice delivery Quality management Continuous improvementSource: The New Zealand Asset Management Support Group. 2011. International Infrastructure Management Manual.New Zealand. ture-management-manual-2011-edition.htmA. Understand and Define requirementsAs a basis for effective asset management, utility managers need to (i) put in place an assetmanagement policy, (ii) develop implementation and monitoring plans to achieve the targetedservice levels and demand forecast, and (iii) obtain a good understanding of the condition of alltheir assets and identify the potential risks and consequences if they fail. This section presents anoutline of these requirements.1. Asset policyUtilities need to raise their organizations’ awareness so everyone understands that asset managementis important in achieving their service, financial, and sustainability goals. It should be high priorityand considered by all while they go about everyday tasks. Crafting an asset management policy,later supported by plans and strategies, can raise this awareness (Box 1).5
6 Water Utility Asset Management: A Guide for Development PractitionersBox 1: Asset Policy ExampleThe organization will at all times practice the highest level of asset management including asset planning based on demand forecasts and targeted service levels; maintenance of reliable integrated asset records that facilitate good governance; maintenance, renewal, and replacement of assets based on life-cycle costing, condition monitoring,and risk assessment; and clear accountability for asset acquisition, security, operation, inspection, maintenance,and disposal.Source: Asian Development Bank.2. Service LevelsEstablishing targets and monitoring achievements at various service levels: (i) informs the public,politicians, and the regulator of the utility’s targeted and actual performance; (ii) enables managersdecide on asset acquisition and management; (iii) allows the utility to compare its performancewith that of others; and (iv) educates the staff on the links between top service-level indicators,strengthened asset performance indicators, and their own jobs.For water the customer service level may be described in terms of availability (24/7) which may bejudged by the number of interruptions or cumulative period of interruptions, quality (appearanceand smell), pressure, number of supply interruptions and response times to supply interruptions.Wastewater service levels are determined through (i) health and environmental conditions (such asfinal effluent discharges compliance with certain levels—Biochemical Oxygen Demand, suspendedsolids, and nitrogen); and (ii) system performance levels, such as the annual number of seweroverflows in the case of combined systems.Customer service-level targets are set through consultation. The targets are reviewed occasionallyor imposed through regulation. Cascading service levels throughout the organization requiresindicators based on the SMART (specific, measurable, achievable, relevant, and time bound) criteria.This ensures that results are linked through all levels of the organization. The number of indicatorsincreases as the organization level goes up (Table 1).Table 1: Cascading of Service-Level TargetsLevelService LevelIndicatorValue124/7 serviceNumber of interruptionsLess than X times per year2SystemLine breaks per100 kilometers per yearLess than 103Asset conditionCondition rating3 or better4Asset monitoringInspectionQuarter 15Maintenance crewInspections per crewNumber per crewSource: Asian Development Bank.
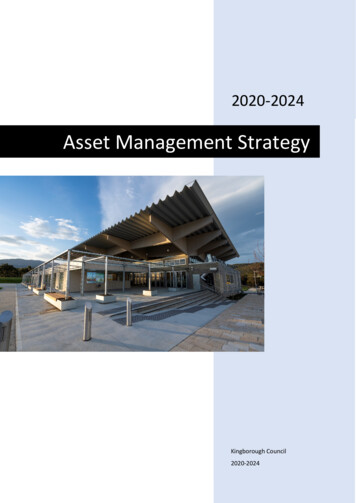
A Brief Overview of Asset Management3. Demand ForecastPredicting demand is of key importance for asset management. It enables managers to plan whatassets may be needed for system expansion or upgrades to sustain agreed levels of service.Utility managers should have one or more demand forecasts based on different assumptionsor scenarios. The challenge is to obtain reliable information on time and in sufficient detail forplanning. Information to consider includes government records of building approvals, landreleases that flag population growth, or repurposed buildings within an area that can lead tomore demand for water and/or sewerage services.Without accurate forecasts, new assets to replace current assets under stress will not be acquiredand commissioned on time or insufficient revenues will be generated to recoup the cost of theassets acquired.4. Understanding Asset BaseAsset management is impossible without the support of good asset records (usually known asan asset register or asset database). This requires (i) investing in robust processes for consistentlycollating and recording information; (ii) gathering past data; (iii) establishing an asset classificationmethod; and (iv) investing in a computer system that contains a number of key modules to allow,for example, planning and acquisition of assets, maintenance of records, and scheduling of assetreplacement (Figure 2).Asset record systems include card indexes, spreadsheets, customized software from major vendors,or computer applications developed in-house. Customized vendor systems may be the most costand time-efficient option. Vendors have invested considerable funds to develop their asset systems,which are integrated with other systems such as financial, customer services, maintenance, andGIS. Furthermore, vendor systems feature data security methods to maintain data quality. They alsoprovide a range of standard reports to help managers monitor assets and make decisions. Systemprocesses include acquisition, operation, inspection, maintenance, renewal, and disposal. Assetsystems in the more advanced utilities allow for inquiry and updating from portable computers orhandheld devices. An extract from an IBM system is in Appendix 1.Figure 2: Illustration of Asset Management System ModulesCustomer systemGIS mappingsystemFinance systemAsset registerMaintenancesystemAsset planning,Capital budgetAsset conditionOperations systemsFailure predictionmodelsSCADA systemsRisk assessmentGIS geographic information system, SCADA supervisory control and data acquisition.Source: Asian Development Bank.Procurement andInventory system7
8 Water Utility Asset Management: A Guide for Development PractitionersMany utilities may not know what assets they have or where they are located. Utilities can remedythis by introducing a program to progressively develop the quality and coverage of their assetrecords. Typical information needed to do this includes the date of asset acquisition, description,maintenance history, original cost, current valuation, type, expected life, inspection frequency, riskrating, location (possibly tied to GIS), performance information, and unique identifier.Asset records should be structured so they can be managed effectively. In Figure 3, the assets areclassified in the following order: major function or process, sub-function, type, and component.Classification may also be done by asset type (pipes, pumps, etc.) or by area. Classificationfacilitates data collection, reporting, and comparative analyses. The structure of the classificationand the level of detail should be agreed on by utility management. A utility’s needs—whether forenergy consumption management or asset maintenance, for example—will dictate the type ofinformation that should be captured. This, in turn, will influence the structure and level of detailthat utility management will agree on for classification.Figure 3: Asset Hierarchy for Classifying AssetsSanitation systemCollection systemGravity SewersManholesSiphon StructuresPipelinesPump StationsHouse connectionsForce MainsDrop structuresTreatment systemCover 1Cover 2Cover 3Cover 4Sewer VentilationDisposal systemSource: Adapted by consultant from GHD on Asset Management.5. Asset ConditionAsset condition ranges from brand new, to worn out and failing (Figure 4). Timely maintenancecan improve the condition of assets and prolong their useful life. If the condition is known orreasonably predictable, then maintenance, renewal, or replacement can be timed to minimizeservice delivery interruption and costs.Condition monitoring allows utilities to predict when an asset needs repair and replacement. Itcan also gauge how much longer the asset can be used. One way to approach this is to establishcondition classes (Table 2).The defining and setting of class rules is specific to each utility. The final set of conditions andaction rules is best decided by the utility’s engineers based on information from suppliers, their
A Brief Overview of Asset ManagementFigure 4: Illustration of Asset ConditionPipe sediment buildup progressivelyconstricts flow and reduces service.Cleaning and relining restore service andextend usefulness by about 50 years.Source: GHD Course on Asset Management.collective experience, and publishedindustry data; or analysis of the utility’smaintenance records.About 20% of assets cause about80% of problems. Some assets canbe easily identified as higher cost andhigher risk. These assets justify moresophisticated condition classificationtechniques. Some utilities use morecomplex rating systems and may varythe system according to asset type(i.e., underground pipes versus aboveground pumps).Table 2: Simple Condition RankingCondition ClassAction Required1Repair immediately2Repair within 1 year3Repair within 3 years4Repair within 7 years5Repair when convenient6No damage, repair unnecessarySource: Adapted by consultant from GHD Course on Asset Management.Condition monitoring can be carriedout through analogue, digital, or visual methods. For example, in assessing sewerage systems,possible methods include smoke testing, dye testing, lamping, video inspection using closedcircuit television, sonar, and ground-penetrating radar. However, these techniques are costly, andare therefore may not be available to small or developing utilities. Condition ratings can also beestablished by tracking causes of failures.6. Identify Asset riskThe delivery of water and wastewater services involves risks. Utilities of all sizes should identifyand manage asset risks to enable them to achieve and sustain their targeted service levels whileoperating within their budgets.Risk is the probability of failure multiplied by the consequence of failure. If both probability andconsequence are high, then the risk is too high and should be reduced to an acceptable level or9
10 Water Utility Asset Management: A Guide for Development Practitionerseliminated. If both probability and consequence are low, the situation can be accepted and noaction is necessary.Utilities need to apply a risk management process following the steps in Figure 5.Identification of risks is done through consultation among managers and recorded in a risk register.The risk is then rated to identify the degree of management needed to achieve an acceptable risklevel. The rating system can range from simple to complex.All assets can be rated. Assets with a very high consequence of failure and at least a moderateprobability for failure are termed “critical assets.” Critical assets would score within the shadedarea in Table 3.The management of critical assets requires a number of actions. For example, criticality may bemeasured for a water supply system through the number of customers and the length of timethey may be affected by a failure. Actions to mitigate the risk posed by critical assets includehaving backup systems (such as alternative power supplies) and units on standby, or holding keyspare parts. Managers should understand failure because it drives acquisition, maintenance, andrenewal decisions. Managers should know that assets fail in different ways, and have differentlikelihoods and consequences of failure.Figure 5: Risk Management ProcessEstablish Riskcontext andframeworkEvaluate Risks– Consequence– Probability– RankingIdentify Risks –categories, events,critical assetsManage Risks– Options– PlanMonitor andReviewSource: Adapted by Consultant from International Infrastructure Management Manual, 2011.Table 3: Example of Risk RatingsConsequence of FailureVery LowLowMediumHighVery HighProbability of 2162024285101520253035Very LowLowModerateQuite LikelyHighVery HighAlmost CertainSource: Asian Development Bank.
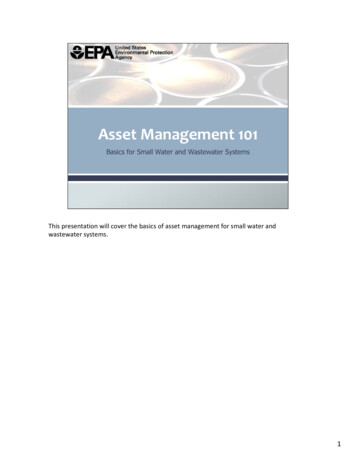
A Brief Overview of Asset ManagementThe application of risk-mitigation and management strategies can be simplified. For example, eachof the 35 cells in Table 3 may have its own group of actions, but grouping cells that have the samescore could reduce the number of categories from 35 to 22, making the task more manageable.Qualitative grouping can further simplify the task into 3 or 4 risk categories, e.g., high, medium,and low.B. Develop Asset Management Life-Cycle StrategiesEffective asset management requires tools to set service levels, compute whole-of-life asset costing,maintain an asset register, monitor asset condition and performance, and carry out risk analysis ofpossible asset failure. Useful tools or strategies include decision-making techniques, operationalstrategies and plans, maintenance strategies and plans, capital works strategies, and financial andfunding strategies.1. Decision-Making TechniquesAsset management requires a number of decisions such as what assets to acquire, when to renewor replace assets, and when to carry out maintenance. Decision making based on past experience,individual opinion, or faulty data can be avoided through life-cycle costing, a technique used toreduce the risk of making wrong decisions.Life-cycle costing means getting the maximum service from an asset or groups of assets for theleast cost during their lifetime. Initial acquisition costs, maintenance, refurbishment, and disposalcosts are all part of the calculation. In Figure 6, two life-cycle cost trends are shown. The solid lineis for an asset with initially low capital costs but higher operating costs over time. The dashed lineis for an asset with initially high capital costs but lower operating costs over time. The cumulativecost lines show that the higher initial cost does not mean an asset has the highest life-cycle cost.Figure 7 shows another way of illustrating life-cycle costs. Although operation and maintenancecosts rise over time, they flatten out after asset renewal has taken place and maintenance costsare reduced. While the concept is easy to understand, it is much harder in practice to compute thecosts accurately. Though the computations will not be exact, they are sufficient to help make aninformed decision.Figure 6: Comparative Life-Cycle Cumulative Costs300,000250,000Low initial capital expenditure cost,higher operational expenditure cost Costs200,000150,000100,000High initial capital expenditure cost, lower operational expenditure cost50,000001234567891011Time PeriodsSource: Asian Development Bank.12131415161718192011
12 Water Utility Asset Management: A Guide for Development PractitionersIncreasingFigure 7: Illustration of Life-Cycle Cost PatternCostsCumulative costsover asset lifeDecreasingCreateRenewOperate &Maintain0Cash requirementsof assetsDispose &ReplaceOperate &Maintain50100Percent of Effective Life ConsumedSource: GHD Course on Asset Management.To obtain the likely costs of maintenance, operation, renewal, disposal cost, and economic life,the starting point is supplier and bidding information; utility records; and utility management’sexperience, including that of engineering and finance staff. Estimated forecasts are sufficient toavoid a timing error in maintenance, renewal, or replacement. Being 80%–85% confident that theestimated life-cycle costs are within plus or minus 10%, for example, would be sufficient to makedecisions.Regardless of the technique applied, there will always be uncertainty in a number of key factorssuch as demand forecasts, expected life of an asset, operational performance, and continuity ofsupplier and spare parts. Therefore, it is important to thoroughly assess the sensitivity of computedresults to varying key assumptions. Different utility managers must work together when applyingany decision-making technique. For example, design and maintenance engineers should work withaccountants because asset management involves physical assets and their financial consequences.2. Operational Strategies and plansIn delivering agreed service levels, assets should also be fully utilized. Otherwise, their life-cycle unitcosts will be higher than they should be. This means adopting operational strategies that seek toachieve effective asset utilization.For water and wastewater services, the following is advised: Ensure asset utilization is not wasted. Examples of wasted asset utilization include pumpingwater and then losing the value of utilization through leakage, or processing morewastewater because of storm water seepage into the conveyance pipe system. Reduce demand for overused assets. This avoids the risk of failure or early replacement,which would then result in underuse. Establish a target range for asset utilization, then measure and report on actual performanceagainst the target. Have emergency plans. This ensures service continuity in a possible crisis. Ensure operators are fully trained and aware of asset performance expectations. This ensuresthat they can contribute to asset monitoring and management.
A Brief Overview of Asset Management3. Maintenance Strategies and plansThe purpose of maintenance is to slow down asset deterioration and extend the period beforerehabilitation and renewal is required. Engineers use a mix of preventive and breakdownmaintenance (repairing unplanned faults). In some utilities, very little preventive maintenance ispracticed. This translates into lower service performance and higher life-cycle costs. Experienceshows that unplanned maintenance costs two to three times more than planned maintenance forthe same task and is harder to manage. A proper maintenance management system translates thetargeted asset service and utilization levels into maintenance activities (Figure 8).Figure 8: Maintenance Management OverviewAsset Levelsof Service andUtilization ntenance andWork PlansMaintenanceActivitiesSource: Consultant adaptation of content in International Infrastructure Management Manual, 2011.Maintenance strategy encompasses (i) how maintenance will be organized (skills-based orlocation-based), (ii) the choice of service delivery method (in-house or outsourced), (iii) expectedfunctional asset performance, (iv) asset interaction with other assets, (v) information and recordsrequirements, and (vi) maintenance prioritization. Objectives will include desired maintenanceperformances, such as response times, productivity, safety, and asset availability.Maintenance plans or work plans will determine what standard operating procedures will beapplied. They will also consider previously assessed risk rating, criticality, and condition. Finally,activities will take place such as inspections; planned remedial action; and unplanned work, suchas dealing with breaks or overflows. Over
Asset Management This guide uses the International Infrastructure Management Manual structure to explain the essentials of asset management (Figure 1). A. Understand and Define requirements As a basis for effective asset management, utility managers need to (i) put in place an asset