Transcription
Delft University of TechnologyExperimental and numerical investigations of aerodynamic loads and 3D flow over nonrotating MEXICO bladesZhang, Ye; Gillebaart, Thijs; van Zuijlen, Alexander; van Bussel, Gerard; Bijl, HesterDOI10.1002/we.2025Publication date2017Document VersionFinal published versionPublished inWind EnergyCitation (APA)Zhang, Y., Gillebaart, T., van Zuijlen, A., van Bussel, G., & Bijl, H. (2017). Experimental and numericalinvestigations of aerodynamic loads and 3D flow over non-rotating MEXICO blades. Wind Energy.https://doi.org/10.1002/we.2025Important noteTo cite this publication, please use the final published version (if applicable).Please check the document version above.CopyrightOther than for strictly personal use, it is not permitted to download, forward or distribute the text or part of it, without the consentof the author(s) and/or copyright holder(s), unless the work is under an open content license such as Creative Commons.Takedown policyPlease contact us and provide details if you believe this document breaches copyrights.We will remove access to the work immediately and investigate your claim.This work is downloaded from Delft University of Technology.For technical reasons the number of authors shown on this cover page is limited to a maximum of 10.
WIND ENERGYWind Energ. (2016)Published online in Wiley Online Library (wileyonlinelibrary.com). DOI: 10.1002/we.2025RESEARCH ARTICLEExperimental and numerical investigations ofaerodynamic loads and 3D flow over non-rotatingMEXICO bladesYe Zhang, Thijs Gillebaart, Alexander van Zuijlen, Gerard van Bussel and Hester BijlDUWIND, Faculty of Aerospace Engineering, Delft University of Technology, Kluyverweg 1, 2629HS, Delft, The NetherlandsABSTRACTThis paper presents the experimental and numerical study on MEXICO wind turbine blades. Previous work by otherresearchers shows that large deviations exist in the loads comparison between numerical predictions and experimental datafor the rotating MEXICO wind turbine. To reduce complexities and uncertainties, a non-rotating experimental campaignhas been carried out on MEXICO blades Delft University of Technology. In this new measurement, quasi-2D aerodynamiccharacteristics of MEXICO blades on three spanwise sections are measured at different inflow velocities and angles ofattack. Additionally, RANS simulations are performed with OpenFOAM-2.1.1 to compare numerical results against measured data. The comparison and analysis of aerodynamic loads on the blade, where three different airfoil families andgeometrical transition regions are used, show that for attached flow condition, RANS computation predicts excellent pressure distribution on the NACA airfoil section (r R D 0.92) and good agreement is observed on the DU (r R D 0.35) andRISØ (r R D 0.60) airfoil sections. Unexpected aerodynamic characteristics are observed at the intermediate transitionregions connecting the RISØ and DU airfoils, where sudden lift force drop is found at the radial position r R D 0.55.Through numerical flow visualization, large-scale vortical structures are observed on the suction side of the blade near themid-span. Moreover, counter-rotating vortices are generated behind the blade at locations where unexpected loads occurs.Consequently, the RISØ airfoil could not give expected 2D aerodynamic characteristics because of upwash/downwasheffects induced by these counter-rotating vortices, which make 3D effects play an important role in numerical modelingwhen calculating the aerodynamic loads for MEXICO rotor. 2016 The Authors Wind Energy Published by John Wiley &Sons LtdKEYWORDS3D effects; aerodynamic loads; non-rotating blades; MEXICO wind turbine; OpenFOAMCorrespondenceY. Zhang, DUWIND, Faculty of Aerospace Engineering, Delft University of Technology, Kluyverweg 1, 2629HS, Delft, The Netherlands.E-mail: ye.zhang@tudelft.nlThis is an open access article under the terms of the Creative Commons Attribution-NonCommercial License, which permits use,distribution and reproduction in any medium, provided the original work is properly cited and is not used for commercial purposes.Received 25 July 2015; Revised 11 May 2016; Accepted 4 August 20161. INTRODUCTIONIn recent years, with increased use of wind energy, the size and complexity of modern commercial horizontal axis windturbines are increasing rapidly. In order to avoid turbine failure and decrease the manufacturing cost for large wind turbines, reliable and accurate aerodynamic models are crucial and required at the design process. To validate and improvethese aerodynamic models, several high-quality experiments have been conducted over the past decade to provide a reliable experimental database. A classical experiment is full-scale test of the National Renewable Energy Laboratory (NREL)unsteady aerodynamics experiment phase VI, which measured a 10 m diameter, stall-regulated horizontal axis wind turbines in the NASA Ames wind tunnel (24.4 m 36.6 m) in 2000. A two-bladed turbine with twisted and tapered bladeswas tested in both upwind and downwind rotor configurations. The rotating blade pressure distribution at five blade spanwise sections, angle of attack and inflow dynamic pressure were measured during the experiment.1 Another experimentis Model EXperiment In Controlled cOndition (MEXICO ), conducted in 2006 in the large-scale low-speed facility of the 2016 The Authors Wind Energy Published by John Wiley & Sons Ltd
Loads and 3D flow over non-rotating MEXICO bladesY. Zhang et al.German Dutch Wind tunnel Organization.2 In this experiment, a 4.5 m diameter, three-bladed, pitch controlled wind turbine rotor model was used, and loads on the rotating blades were measured by Kulite pressure transducers. Additionally,in the MEXICO experiment, the wind turbine wake was measured in detail using particle image velocimetry technology. The combination of measured blade loads and wake flow field resulted in a comprehensive database for validationof aerodynamic models. Because of the complex physics of wind turbine aerodynamics, in some cases, the aerodynamicmodels have difficulty in calculating the turbine performance and loads accurately. The blind comparisons between experiment and aerodynamic models show large discrepancy when these models are not tuned to the experiment. In the NRELexperiment, the comparison indicates that even at easy-to-predict wind turbine operation conditions, which are no-yaw,steady-state flow, the derivation ranges from 25% to 175% for turbine power prediction. Blade bending force predictionranges from 85% to 150% compared with the measurement.3 The comparison becomes even worse at higher wind speed. Inthe MEXICO experiment, the final conclusion states that all loads along the blade are consistently over predicted by mostof aerodynamic models with the same level of magnitude as in the NREL experiment. At the stall condition, although thecomputational fluid dynamic (CFD) models give better prediction compared with other engineering models (BEM, liftingline), still considerable deviations can be found in the comparison. These differences still cannot be fully explained.4–6Therefore, in order to better understand the reason of this discrepancy in the comparison between measurements andnumerical results for the MEXICO experiment, this study makes an in-depth experimental and numerical comparison ofthe MEXICO blades. To reduce the complexity of the flow and uncertainties in the experiment, every MEXICO blade ismeasured separately under parked (non-rotating) conditions.Many CFD studies have focused on simulating the flow over standstill wind turbine. Sørensen et al.7 compared measuredand computed pressure distribution and integrated forces for two rotors’ blades. The comparisons showed a better loadsprediction capability of Menter’s k ! SST turbulence model compared with the original Wilcox’s k ! turbulence model.Furthermore, it was concluded that the tangential forces in the attached flow conditions are difficult to predict correctlywhen fully turbulent flow is assumed. In a numerical study of the MEXICO rotor by CENER* , it was concluded that parkedcases are harder to predict than expected: both because of the large twist of the blades and because of the uncertainties instandstill measurement data, such as erroneous pressure transducer measurements on the inboard part (25%R and 35%R) ofthe blades.4 The author recommended more CFD simulations to be performed and other turbulence models to be consideredfor better predicting the aerodynamic loads at standstill conditions. However, in our non-rotating experiment, each bladeof the MEXICO rotor can be measured on three radial sections in the well-controlled flow condition. CFD simulationsare expected to cope with the quasi-2D aerodynamics without too much effort in comparisons with the experimentalmeasurements. Indeed, previous simulations8 on the non-rotating MEXICO blade, at fully attached, massively separatedand stall conditions, demonstrate that Reynolds-averaged Navier–Stokes simulations with Menter’s k ! SST turbulencemodel shows good agreement with the experiment for fully attached flow at low angles of attack.Different from previous work,8 the current paper focuses on detailed investigation of the MEXICO blade sectionalloading and 3D effects. This paper is organized as follows: first, the setup of non-rotating MEXICO blades experiment,performed in the low-speed low-turbulence (LTT) wind tunnel at Delft University of Technology, is briefly described. Second, CFD simulations are carried out to understand further about aerodynamic loads and flow behavior on the non-rotatingMEXICO blades. The numerical results concentrate on the comparisons of the pressure distribution at three radial sectionswith the experimental measurements. In addition, the flow topology predicted by CFD simulation is also compared withoil flow visualization in the experiment. Afterwards, the numerical investigations of the aerodynamic loads and 3D flowaround the non-rotating blades give more insight into the MEXICO blades.2. METHODS2.1. Experimental approach2.1.1. Wind tunnel, the model and the apparatus.The wind tunnel measurements on the non-rotating MEXICO blades are performed in the LTT wind tunnel at Delft University of Technology. The LTT is a closed return wind tunnel with an exchangeable, octagonal test section 2.60 m long,1.80 m wide and 1.25 m high. The free-stream turbulence intensity in the test section varies from 0.015% at 20 m s 1 to0.10% at 120 m s 1 . The inflow velocity is kept at 35 and 60 m s 1 in this experiment.The models measured in the experiment are the blades of a three-bladed, horizontal axis MEXICO wind turbine rotor.The blade is tapered with a length of 2.04 m. Three different airfoil profiles exist along the span of the blade. From the rootto the tip, they are the DU91-W2-250 airfoil from 20% to 45.6% span, the RISØ-A1-21 airfoil from 54.4% to 65.6% spanand the NACA 64-418 airfoil from 74.4% span to the tip. The remaining parts are the intermediate regions connecting two* NationalRenewable Energy Center of Spain, one collaboration partner in the MEXICO project.Wind Energ. (2016) 2016 The Authors Wind Energy Published by John Wiley & Sons LtdDOI: 10.1002/we
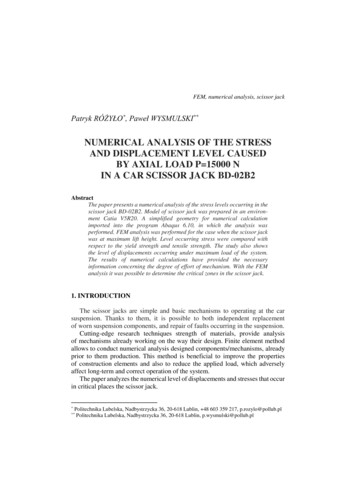
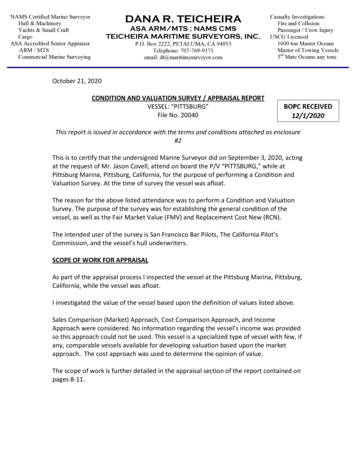
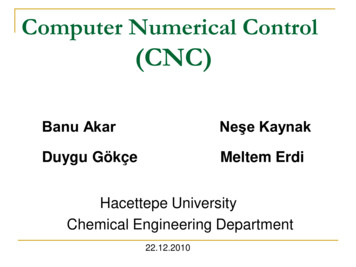
Y. Zhang et al.Loads and 3D flow over non-rotating MEXICO bladesFigure 1. Airfoil distributions over the span of the MEXICO blade.Figure 2. Chord and twist distribution of the MEXICO blade.adjacent airfoil profiles and lofted with tengency. Figure 1 shows the airfoil distributions over the blade span. The chordand twist distribution of the MEXICO blade is also illustrated in Figure 2.The apparatus used in the experiment are Kulite pressure transducers, wake rake and oil. The usage of the technicalequipments are itemized as follows: There are 148 Kulite pressure transducers in total on the three blades, distributed over five different instrumentedsections. These transducers measure the pressure distribution over all tested airfoil sections, which are 25%R and35%R spanwise locations of blade 1, 60%R spanwise location of blade 2, and 82%R and 92%R spanwise locationsof blade 3. Before the measurement, a static calibration of Kulite pressure transducers is performed, covering thepressure range observed throughout the measurement campaign. The wake rake is used to measure the velocity deficit behind the blades with 16 static and 67 total pressure tubesmounted on a spar. After that, the sectional total drag can be determined. The flow topology over the blade surface such as laminar/turbulence transition, flow separation, and 3D effects canbe clearly seen with oil flow techniques.2.1.2. Experimental setup and procedure.Each blade is mounted vertically in the test section and because the blades’ span is longer than the test section height, twoexperimental setups are used. As shown in Figure 3, the pressure at 35% span location is measured on blade 1 with theoutboard part of the blade outside of the test section. The pressure at 60% and 92% span is measured on blade 2 and blade3, respectively, which are mounted with a free blade tip, see Figure 4. Zigzag tape is applied on both pressure and suctionsides at 10% chord to promote transition and avoid free laminar to turbulent transition.In order to keep the chord-based Reynolds number Rec identical as the previous rotating experiment, the inflow velocitiesare chosen as 35 and 60 m s 1 to match Rec . The quasi-2D aerodynamic characteristics on these three test sections areobtained at a range of angles of attack, from 20ı to 20ı . The rotating table at the top of the test section can adjust the tipWind Energ. (2016) 2016 The Authors Wind Energy Published by John Wiley & Sons LtdDOI: 10.1002/we
Y. Zhang et al.Loads and 3D flow over non-rotating MEXICO bladesFigure 3. Experimental setup of the model: the MEXICO blade 1.Figure 4. Experimental setup of the models: the MEXICO blades 2 and 3.Table I. Parameters of some case
There are 148 Kulite pressure transducers in total on the three blades, distributed over five different instrumented sections. These transducers measure the pressure distribution over all tested airfoil sections, which are 25%R and 35%R spanwise locations of blade 1, 60%R spanwise location of blade 2, and 82%R and 92%R spanwise locations of blade 3. Before the measurement, a static .