Transcription
CHEROKEE COUNTY WATER & SEWERAGE AUTHORITYCITY OF CANTON WATER & SEWER DEPARTMENTSOURCE WATER ASSESSMENT PROJECT:An Assessment of Potential for Pollution of Surface DrinkingWater Supply SourcesPrepared by the Atlanta Regional Commission forCherokee County Water & Sewerage AuthorityandCity of Canton Water & Sewer DepartmentDECEMBER 2001
CHEROKEE COUNTY WATER & SEWERAGE AUTHORITYCITY OF CANTON WATER & SEWER DEPARTMENT(This page intentionally left blank.)DECEMBER 2001
CHEROKEE COUNTY WATER & SEWERAGE AUTHORITYCITY OF CANTON WATER & SEWER DEPARTMENTTable of ContentsOverview of Source Water Assessment . . . 1Description of the Cherokee County and the City of Canton Water Systems 5Results of the Cherokee County Etowah River Intake Source WaterAssessment. .Watershed Description .Susceptibility DeterminationIndividual Source Inventory .Non-Point Source Inventory Watershed Issues .Results of the City of Canton Etowah River Intake Source WaterAssessment .Watershed Description .Susceptibility DeterminationIndividual Source Inventory .Non-Point Source Inventory Watershed Issues .7779101515151718Appendix A. Potential Pollutant Sources . 23Appendix B. Potential Pollutant Source Database Sources 25Appendix C. Consumer Confidence Report for Cherokee County Water &Sewerage Authority . 27Appendix D. Water Quality Impaired Streams in the City of Canton Water andSewer Department’s Water Supply Watershed . 33Appendix E. Consumer Confidence Report for City of Canton Water & SewerDepartment . 39DECEMBER 2001
CHEROKEE COUNTY WATER & SEWERAGE AUTHORITYCITY OF CANTON WATER & SEWER DEPARTMENT(This page intentionally left blank.)DECEMBER 2001
CHEROKEE COUNTY WATER & SEWERAGE AUTHORITYCITY OF CANTON WATER & SEWER DEPARTMENTOverview of Source Water AssessmentINTRODUCTIONFederal Requirements BackgroundThe 1996 Amendments to the Federal Safe Drinking Water Act (SDWA) brought aboutnew pollution prevention and protection measures to help ensure clean and safedrinking water. As a result, the U.S. Environmental Protection Agency (USEPA) has seta national goal that by 2005, the majority of the population is to receive its drinkingwater from systems with Source Water Protection Plans in place. The initial step in thedevelopment of the Plan is to prepare an inventory and assessment of each watersupply watershed in the State. This step is the Source Water Assessment Project(SWAP).The Georgia Environmental Protection Division (GA EPD) contracted with the AtlantaRegional Commission (ARC) to coordinate and complete Drinking Water AssessmentPlans for 28 Metro Atlanta public drinking water intakes. The goals of this projectinclude:1. Delineating the water supply watershed for each drinking water intake,2. Developing an inventory of potential sources of contamination,3. Determining the susceptibility of drinking water sources to identified potentialsources of contamination, and4. Increasing public involvement in and awareness of drinking water watershedconcerns.Determination of Assessment Areas. Watersheds were delineated by ARC staff usingUSGS topographic maps and then digitized using GIS software. Once the watersheds weredelineated, the assessment areas or zones were determined using the GA EPD criteria.The Inner Management Zone (IMZ) extends to seven miles upstream from the intake. Thisarea requires the most stringent inventory and analysis of Potential Pollutant Sources. TheOuter Management Zone (OMZ) extends from the boundary of the IMZ to twenty milesupstream of the intake. In this area, the GA EPD guidance requires fewer facilities beidentified and analyzed. Outside of the OMZ is the Non-Management Zone (NMZ). TheNMZ is the remainder of the watershed beyond the twenty mile OMZ delineated boundary(the Metro Atlanta Source Water Assessment applied the IMZ criteria for identification,analysis and inventory to the entire watershed area).Potential Pollutant Source Inventory. This assessment focuses on finished watercontaminants regulated under the SDWA for groundwater and surface water,contaminants regulated under the Surface Water Treatment Rule and themicroorganism Cryptosporidium. These contaminants include fecal coliform (as anindicator), nitrate, nitrite, ammonium nitrate, suspended sediment, volatile organicchemicals (VOCs), synthetic organic chemicals (SOCs), inorganic chemicals (IOCs),iron, manganese, copper, and nutrients. A list of potential pollutant sources wasdeveloped using the GA EPD's implementation plan, task force and local utility input,DECEMBER 2001-1-
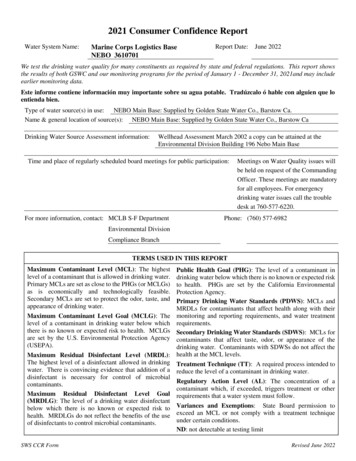
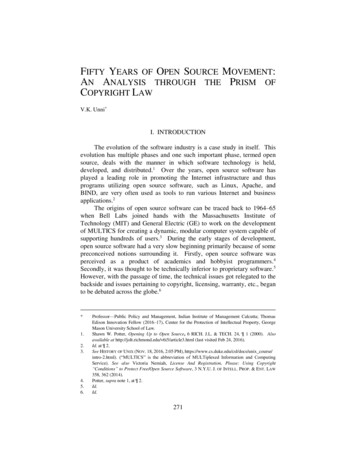
CHEROKEE COUNTY WATER & SEWERAGE AUTHORITYCITY OF CANTON WATER & SEWER DEPARTMENTand EPA guidance documentation available on the Internet athttp://www.epa.gov/safewater/swp/sources1.html. Appendix A lists all of the potentialpollutant sources identified in the contaminant source inventory.Individual Sources. To identify potential individual sources of pollution, ARC reviewedstate and federal regulatory programs which issue permits to these facilities. Fromthese data sets, all occurrences of facilities within the watershed were mapped andanalyzed. In addition to this process, ARC conducted field surveys and identifiedfacilities not listed in the reviewed data sets. Appendix B lists the data sources fromwhich facility information was obtained.Non-Point Source. Estimates of percent impervious surface were used to identify thepotential impact of non-point sources of pollution on the drinking water intake.Impervious surface area was assigned according to land use category throughout thewatershed. In addition, other factors considered as non-point sources included land intransition (exposed soil), percent of watershed sewered and non-sewered, number ofsewer pipelines over 10" in diameter crossing streams within the IMZ, number of roadsand railroads crossing streams, and major transportation corridors.Susceptibility DeterminationDrinking water intakes are susceptible to two different types of pollution – individualsources and non-point sources. Individual sources of pollution involve actual facilities,which have contaminants on-site and can pose a potential health risk if humansconsume those contaminants. Non-point source pollution is caused by developmentand everyday activities that take place in residential, commercial, and rural areas and iscarried by stormwater runoff to streams and lakes. Non-point source pollutants includesediment, bacteria, heavy metals, oil and grease, herbicides and pesticides, nutrients,and temperature increases.Individual Source Susceptibility Determination. In order to determine the potentialdegree of risk of the potential pollutant sources, the GA EPD's criteria for susceptibilityranking was used. First, all facilities were ranked as either high, medium or low forpotential sources of pollution. This ranking is based on the potential of contaminantrelease and the potential risk to the surface water intake. The factors considered inranking the potential for release are distance from surface water, volume of release,duration of release and ease of transport/travel. The factors considered for risk are:distance to intake and toxicity. Both potential and risk are ranked individually and thenthe two scores are combined to get an overall facility ranking using the GA EPDdesignated matrix (Figure 1). Release potential and risk were assigned ranks based onthe facility type represented by each potential pollutant source, supplementalinformation provided by local water systems, and information provided from GA EPDdatabases and accidental spill reports.DECEMBER 2001-2-
RIORITYLowCHEROKEE COUNTY WATER & SEWERAGE AUTHORITYCITY OF CANTON WATER & SEWER ORITYLowMediumPotentialHighFigure 1. Individual Source Susceptibility DeterminationAfter all of the sources are charted on the matrix, the overall watershed is ranked for theindividual source susceptibility as follows:High SusceptibilityMedium SusceptibilityLow Susceptibility40% or more of the sources chart in grid squares 7,8, and 920% or less of the sources chart in grid squares 7, 8 and 9AND40% or more of the sources chart in grid squares 4, 5, and 620% or less of the sources chart in grid squares 7,8, and 9AND20% or less of the sources chart in grid squares 4,5, and 6Non-Point Source Susceptibility Determination. To evaluate non-point sourcepollution in the watersheds, an estimate of impervious surface area was calculatedbased on land use categories. Impervious surfaces collect and accumulate pollutantsdeposited from a variety of sources including: dust and dirt form the air, leaks fromvehicles, animal wastes, yard pesticides and fertilizers, leaky sewer lines andconstruction and barren soil areas. During storms, accumulated pollutants are quicklywashed off, and are rapidly delivered to rivers and lakes. According to the Center forWatershed Protection, studies have consistently indicated that urban pollutant loads aredirectly related to the amount of impervious surface in the watershed.Overall non-point source susceptibility was determined based on percentage ofimpervious surface in the watershed. For this project, greater than 20% impervioussurface area was ranked high, between 10-20% was ranked as medium and less than10% was ranked low susceptibility. Other factors considered in the non-point sourcesusceptibility ranking included land in transition (exposed soil), percent of watershedsewered and non-sewered, number of sewer pipelines over 10" diameter crossingstreams within the IMZ, number of roads and railroads crossing streams, and majortransportation corridors.DECEMBER 2001-3-
CHEROKEE COUNTY WATER & SEWERAGE AUTHORITYCITY OF CANTON WATER & SEWER DEPARTMENT(This page intentionally left blank.)DECEMBER 2001-4-
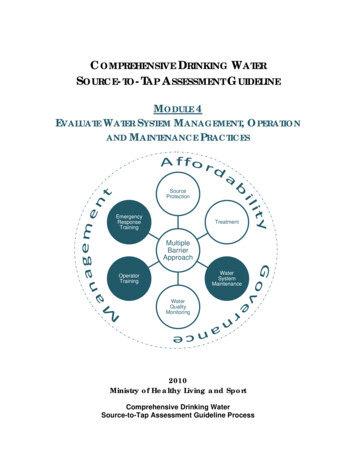
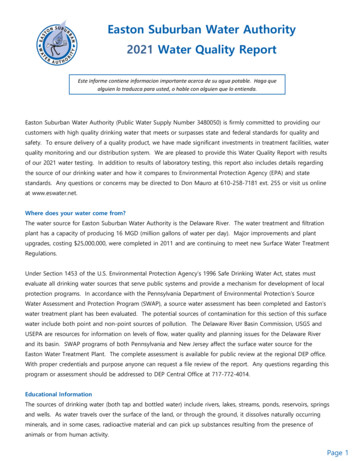
CHEROKEE COUNTY WATER & SEWERAGE AUTHORITYCITY OF CANTON WATER & SEWER DEPARTMENTDESCRIPTION OF THE CHEROKEE COUNTY AND THE CITY OFCANTON WATER SYSTEMSFigure aterTownWetlandA watershed is the area of land thatdrains into a river, stream or lake (Figure2).Source water is untreated water fromstreams, rivers, or lakes, which is used tosupply public drinking water. In CherokeeCounty and its municipalities, surfacewater serves more than 120,000 people.WatershedDividePercolationProduced by Lane Council of GovernementsCherokee County Water & Sewerage Authority. The Cherokee County Water &Sewerage Authority primarily provides retail service to the unincorporated areas of thecounty and wholesales to the jurisdictions of Canton, Holly Springs, Woodstock, BallGround, Waleska, Jasper, and Bartow County, Pickens County, and Forsyth County.Due to the arrangement of the distribution system, the Authority also purchases somewater from the City of Canton to serve some of its customers. The Cherokee CountyWater & Sewerage Authority has a surface water permit to withdraw water from theEtowah River. Cherokee County Water & Sewerage Authority also operates the YellowCreek Reservoir as a drought contingency source.City of Canton Water & Sewer Department. The City of Canton has a surface waterpermit to withdraw from the Etowah River. The City of Canton also wholesales water toCherokee County Water & Sewerage Authority as well as the City of Holly Springs, andWaleska. The City of Canton Water & Sewer Department are in the developmentstages of constructing a drought contingency reservoir on Hickory Log Creek.Etowah RiverHollis Lathem Reservoir on YellowCreekDECEMBER 2001-5-
EllijayLegendWatershed BoundaryOverlapping WatershedGilmer Co.Management Area BoundariesInner Management ZoneStreams & RiversLakes & ReservoirsFreewayMajor RoadsLumpkin Co.RailroadsIncorporated City BoundariesCounty BoundariesJasperDawson Co.Pickens Co.erDawsonvilleNelsonRYellow CreekReservoirEwtoivaherBall GroundR(Future Site ofReservoir),.-EtoHickory LogivhawCanton575Holly SpringsCherokee Co.Forsyth Co.Cumming!"Lake Lanier4000City of Canton Water & Sewer Department &Cherokee County Water & Sewerage AuthorityFigure 3Etowah River Water Supply Watershed24Miles
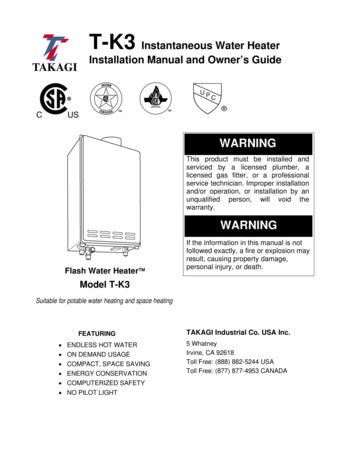
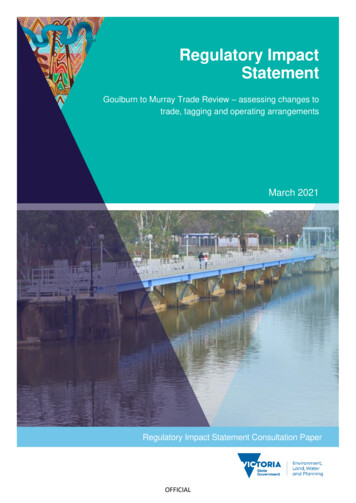
CHEROKEE COUNTY WATER & SEWERAGE AUTHORITYCITY OF CANTON WATER & SEWER DEPARTMENTRESULTS OF CHEROKEE COUNTY WATER & SEWERAGEAUTHORITY ETOWAH RIVER INTAKEDRINKING WATER SOURCE ASSESSMENTWatershed DescriptionThe Cherokee County Etowah River Water Supply Intake is located approximately 70.7river miles downstream of the headwaters of the Etowah River. The watershed has a501-square mile drainage area.Downstream of the intake, the Etowah River feeds into Allatoona Lake. The watershedcrosses several counties and jurisdictions. The counties include Fannin, Union, Gilmer,Lumpkin, Dawson, Pickens, Cherokee, and Forsyth. The watershed also containsportions of the municipalities of the Jasper, Nelson, Ball Ground, and Dawsonville(Figure 3).Susceptibility DeterminationIndividual Source. The Etowah River Watershed has 210 facilities included in theinventory of potential individual sources. Table 1 lists the type and number of facilitieswithin the watershed. These facilities are shown on Figure 4.Table 1. Inventory of Potential Individual Sources of PollutionPotential Pollutant Source FacilitiesNumber of FacilitiesAgriculture85Airports2Asphalt Plants1Electric Substations5Fuel Facilities17Hazardous Waste Facilities2Junk/Scrap/Salvage Yards3Landfills4Large Industries which Utilize Hazardous Chemicals4Land Application Site (LAS) Permit Holders7Mines61NPDES Permit Holders9Water Treatment Plants9Wastewater Treatment Facilities1Total210DECEMBER 2001-7-
Potential Pollutant Sources#ÿY# TÑU%%U\&S# Z%{xAgricultureAirportsAsphalt PlantsGarbage Transfer StationsHazardous Waste FacilitiesJunk/Scrap/Salvage YardsLAS Permit HoldersLandfillsLarge Industries Which HaveLarge Industries Which HaveLarge Industries WhichUtilize Hazardous ChemicalsLift StationsMining#³#·#·#·\&b%UFederal Categorical StandardsMarinasÊÚCamp Frank D. MerrillGilmer Co.Bulk Chemical and Petro. StorageÌËUnion Co.Fuel FacilitiesÎ Fannin Co.Electric SubstationsLumpkin Co.NPDES Permit HoldersPetroleum Pipeline Crossing Stream%URecycling CentersWastewater Treatment FacilitiesWater Treatment Plants%[#·%%[[% %[%[U%%U#· #·[%%[Dahlonega%[JasperÌÑ Ì ÌÌ#·#·[%%[#Y%[%[ %[%[ [%Ì Ì% ÌÌ Ì Ì ÌPickens Co.Nelson% %[ÌÌÌ,.-#·EtoCantonawh[%#Y#YÌÌÌÌ%[\& \&%[#³%[ÌDawsonvilleÌDawson Forest%[#· ÌWMAÌÌÌ%[ÌÌ[%#Y#Y%[Yellow CreekÿAtlanta [[% [%%[%[%[Ì#Y[%%[[%[%[%[%[%[%[%[%r%[eÌ%[ÌÌ%[ %U[%%[ Ì#Y ÿ#Y#%[%%[%[Ì[%[%Ì#YÌ%[ #Y%[[% [%#Y%[ #YÌ#YÌ%[%[%[ %U%[%[ %[%[ %[%[%[[%[%[%%[ÿ%[Y##Y%U %[ #Y%[ %[ %[ÌÌ%[ %[RivBall Ground575%[ ÌÌÌÌÌÌÌÌÌÌÌ%[bDawson Co.ÌÌ ÌÌÌÌÌ ÌÌÌrbe%[!"400Cherokee Co.Forsyth Co.CummingLegendWatershed BoundaryInner Management ZoneStreams & RiversLakes & ReservoirsFreewayMajor RoadsRailroadsPotential Individual Sources of PollutionIncorporated City BoundariesCounty BoundariesCherokee County Water & Sewerage AuthorityFigure 4Etowah River Water Supply Watershed
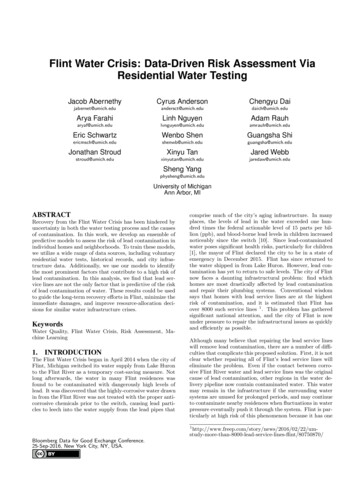
CHEROKEE COUNTY WATER & SEWERAGE AUTHORITYCITY OF CANTON WATER & SEWER DEPARTMENTHigh(4)(7)(9)RiskMediumPotential pollutant source rankings for each facility were assigned based on the GAEPD's criteria. The following chart (Figure 5) summarizes the results of the individualsource iumPotentialHighFigure 5. Etowah River Individual Source SusceptibilityWith 25% in the high category, 38% in the medium category and 37% in the lowcategory, this watershed fits somewhere between a high and medium susceptibilityrank.Non-point Source. Land use in the Etowah River Watershed is predominatelyOpen/Forest or AgriculturalFigure 6. Land Use in the Etowah River WatershedCropland (Figure 6). TheCherokee County Water & Sewerage Authoritytotal impervious surface forthe watershed is notavailable at this time due tothe lack of data in theupper part of thiswatershed. Available datacovering the lower portionof the watershed shows animpervious surface area of3.1%, which equates to alow susceptibility rank(Table 2). This portion ofthe watershed is the mostdeveloped area andtherefore is likely aconservative estimate of impervious surface area for the entire watershed. This portionof the watershed has 0.5% of the area "in transition" or exposed soil. There are 11railroads crossing streams within the IMZ and there are no large sewer lines over 10".Approximately 1% of the watershed is sewered (Figure 7). The overall non-point sourcesusceptibility ranking is therefore Low.768WaterbodiesTownhome/Apartment078High Density Residential3881Medium Density Residential200Major RoadsAg/Pasture and Cropland3590615301Low Density Residential83059Open/ForestOffice/Light Industrial659Heavy 050,00060,000AcresDECEMBER 2001-9-70,00080,00090,000
CHEROKEE COUNTY WATER & SEWERAGE AUTHORITYCITY OF CANTON WATER & SEWER DEPARTMENTTable 2. Impervious Surface Area in the Etowah Watershed (partial)Land Cover ClassificationAcres inImperviousImpervious% ofWatershed Coefficient Area (Acres)WatershedAgricultural 20585%1740.2%Heavy Industrial/Utilities34580%2760.3%Major Roads20090%1800.2%Office/Light 6.4%ResidentialHigh Density7826%200.1%Medium Density3,88119%7373.1%Low dies7680%00.6%TOTAL125,1793,973Combining the individual and non-point source rankings gives an overallsusceptibility ranking of MEDIUM.Although the drinking water intake ranks medium susceptibility to potentialpollution, water quality reports (Appendix C) for the Cherokee County Water &Sewerage Authority drinking water show no violations in water quality.Watershed IssuesAccidental Spills. Accidental spills were reviewed for each watershed. These spillsrepresent non-point source pollution within developed areas. The spill data was alsoreferred to when evaluating the susceptibility criteria in the individual source analysis.Four sources of data were used to collect information on accidental spills within thewatershed. The four programs are the Hazardous Site Response Program, the WaterQuality Branch, the Emergency Response Program, and EPD enforcement actions. Allof the data sources include spills reported from 1997-2000 to GA EPD.Within the Atlanta Region, approximately 5619 accidental spills were reported. Of thesespills, approximately 36% or 2029 were mappable. Due to the nature of the spillreporting, it is difficult to use the available data. Also, this data does not represent thetotal number of spills within a watershed. Within this watershed there are 14 identifiableaccidental spill sites (Figure 8). These spills cover a wide range from the type ofsubstance to the volume of substance spilled. The majority of the spills includedrelatively small amounts of gasoline and motor oil, and sewage spills.DECEMBER 2001- 10 -
Potential Non-PointPollutant SourcesFannin Co.Z %aUnion Co.Major Road Crossing StreamRailroad Crossing StreamLand In TransitionGeneralized Sewered AreaGilmer Co.Lumpkin Co.Dahlonega%aJasper ZZ Z %a%a Z Z Z%a Z %a Z Z%a%a%a Z Z Z ZZ Z Z ZZ ZDawsonville Z ZNelsonYellow CreekReservoirtE,.EtoahBall GroundRiv575awowZ Z ZreerPickens Co.Dawson Co.Riv ZZ Z Zh ZLegend ZCantonCherokee Co. ZZ Z Z Z ZForsyth Co.Cumming!"400Watershed BoundaryInner Management ZoneStreams & RiversLakes & ReservoirsFreewayMajor RoadsRailroadsPotential Non-Point Sources of PollutionIncorporated City BoundariesCounty BoundariesCherokee County Water & Sewerage AuthorityFigure 7Etowah River Water Supply Watershed
CHEROKEE COUNTY WATER & SEWERAGE AUTHORITYCITY OF CANTON WATER & SEWER DEPARTMENTSediment and Erosion. In this watershed, development is increasing at a high rate.Large amounts of sediment can reach waters during construction or when land hasbeen cleared of vegetation. Consequently, erosion and sediment control on exposedsites is an important area of a watershed management program for water qualityprotection. A combination of clearing restrictions, erosion prevention, and sedimentcontrols, coupled with a diligent plan review and strict construction enforcement areneeded to help mitigate these impacts.Railroads. Railroads also pose a threat to drinking water in the event of a spill. Withinthe Etowah River watershed there are several areas where the railroad crosses over astream with 11 crossings in the IMZ.Agriculture. The Etowah River Watershed contains a large number of poultry farms.Due to the nature of the contaminant and the lack of regulation, these facilities areconsidered a potentially higher risk to the drinking water.DECEMBER 2001- 12 -
Fannin Co.Legend#0Union Co.Accident Spill LocationWatershed BoundaryInner Management ZoneStreams & RiversLakes & ReservoirsGilmer Co.FreewayMajor RoadsRailroadsIncorporated City BoundariesCounty BoundariesLumpkin Co.#0DahlonegaJasperDawson Co.#0#0#0DawsonvilleerPickens Co.NelsonRYellow Creek,.-ReservoirBall GroundEtoRivwah#0#0#0575awtoEre#0#0#0h#0Cherokee Co.!"400CantonForsyth Co.CummingAccident Spill LocationsCherokee County Water & Sewerage AuthorityFigure 8Etowah River Water Supply Watershediv
CHEROKEE COUNTY WATER & SEWERAGE AUTHORITYCITY OF CANTON WATER & SEWER DEPARTMENT(This page intentionally left blank.)DECEMBER 2001- 14 -
CHEROKEE COUNTY WATER & SEWERAGE AUTHORITYCITY OF CANTON WATER & SEWER DEPARTMENTRESULTS OF THE CITY OF CANTON WATER & SEWERDEPARTMENT ETOWAH RIVER INTAKEDRINKING WATER SOURCE ASSESSMENTWatershed DescriptionThe City of Canton Water Supply Intake is located approximately 85.1 river milesdownstream of the headwaters of the Etowah River. The watershed has a 613-squaremile drainage area.Downstream of the intake, the Etowah River feeds into Allatoona Lake. The watershedcrosses several counties and jurisdictions. The counties include Fannin, Union, Gilmer,Lumpkin, Dawson, Pickens, Cherokee, and Forsyth. The watershed also contains themunicipalities of the Canton Jasper, Nelson, Ball Ground, and Dawsonville (Figure 3).Susceptibility DeterminationIndividual Source. Etowah River Watershed has 382 facilities included in the inventoryof potential individual sources. Table 3 lists the type and number of facilities within thewatershed. These facilities are shown in figure 9.Table 3. Inventory of Potential Individual Sources of PollutionPotential Pollutant Source FacilitiesNumber of FacilitiesAgriculture126Airports5Asphalt Plants2Electric Substations11Fuel Facilities61Hazardous Waste Facilities24Junk/Scrap/Salvage Yards7Landfills6Large Industries which have Federal Categorical Standards3Large Industries which Utilize Hazardous Chemicals23Land Application Site (LAS) Permit Holders7Mines81NPDES Permit Holders12Recycling Centers1Water Treatment Plants12Wastewater Treatment Facilities1Total382DECEMBER 2001- 15 -
Potential Pollutant Sources#ÿ#Y TÑ%U%U&\#S Z%x{AgricultureAirportsEllijayFuel FacilitiesGarbage Transfer StationsHazardous Waste FacilitiesJunk/Scrap/Salvage YardsLandfillsLarge Industries Which HaveBulk Chemical and Petro. StorageLarge Industries Which HaveLarge Industries WhichUtilize Hazardous ChemicalsLift StationsMining³#·#Lumpkin Co.Federal Categorical StandardsMarinasÚÊ#·#·\&b%UCamp Frank D. MerrillGilmer Co.LAS Permit HoldersÌËUnion Co.Electric SubstationsÎ Fannin Co.Asphalt Plants%UNPDES Permit HoldersPetroleum Pipeline Crossing StreamRecycling Centers%[Wastewater Treatment FacilitiesWater Treatment PlantsU%%U#· #·#·Pickens Co.%Ñ#Y%%[#Y%#Y#Y%[#YÑÑ#Y#Y·%Ì ÌÌ%[ %%#Y #Y#YÑ#Y#Y#·##YÑY#YÿÑ%#Y#ÚÿÊ%#%[ b #Y#Y Y%[%[ %U%[ÑÑÌ%Ñ%[%[[% %[%[[%%[%[JasperÌÌ%[ [% Ì%[ Ì%[%[%[%[%[Ìÿ#YÌ[%Ì%[Ì#·ÿ ickory LogEtoReservoir)#· ÌWMAÌBall Ground,.-%[Dawson ForestÌÌ[%#Y#Y%[ÿAtlanta TractÑ%[Ì\& #YÌ%[%[%[ ÿY##Y%#·%[Ì%UÌ#Y %[\&%U%U %[ %[ Ì%[%[ %[b%[Ì %Ì#Y r[%%ÌÑ%[e%%[ Ì##YÿÑÑ ZÑ%%%% #·[%[%\&ÌÌ%ÌÌ#YbÌÌÌ Y#%[Ì%[%[hÌ#YÑÑ#Yaw%[ %[%[Ì %U#YÑÑ#Y%[#YÌÌÌ#YÑ[%#Y%[#Y#·ÑÑÑ%U Z%%[%# %[%[%[%[ Y#Y%[ %[ %[(Future Site ofÌ%[\& \&%[#³%[ÌÌ ÌÌÌÌÌÌÌÌ%[b ÌÌÌÌÌÌÌÌÌÌÌ [%Ì#Y Ì% ÌÌ Ì Ì ÌDawson Co.[%%[#Y%[%[%[%[ÌYellow CreekReservoirU%%Uÿ%[tEow[%%[ah%[rbe%[RivÌÿ%[%[ [%%[%[%[#Y[%%[%[[%%[%[ %[%[ #Y%[%[[%Ì%[ %U[%%%[Ì#Y ÿ[%[%%[ Y#[%%[#Y%[ #Y#Y%[%[ %[%[ %[%[%[[%ÿ#Y%U %[ %[LegendCantonWatershed BoundaryCherokee Co.575Forsyth Co.Cumming!"400Holly SpringsInner Management ZoneStreams & RiversLakes & ReservoirsFreewayMajor RoadsRailroadsPotential Individual Sources of PollutionIncorporated City BoundariesCounty BoundariesCity of Canton Water & Sewer DepartmentFigure 9Etowah River Water Supply Watershed
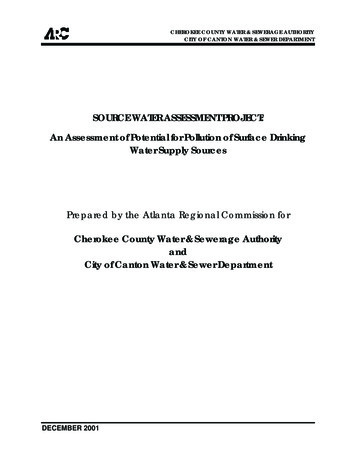
CHEROKEE COUNTY WATER & SEWERAGE AUTHORITYCITY OF CANTON WATER & SEWER DEPARTMENTHighPotential pollutant source rankings for each facility were assigned based on the GAEPD's criteria. The following chart (Figure 10) summarizes the results of the individualsource (1)(3)(6)7870Low4MediumPotentialHighFigure 10. Etowah River Individual Source SusceptibilityWith 20% in the high category, 40% in the medium category and 40% in the lowcategory, this watershed ranks as medium susceptibility.Non-point Source. Land use in the Etowah River Watershed is predominatelyOpen/Forest or Agricultural Cropland (Figure 11). The total impervious surface for thewatershed is not availableat this time due to the lackFigure 11. Land Use in the Etowah River WatershedCity of Canton Water & Sewerof data in the upper part ofthe watershed. Availabledata covering the lowerportion of the watershedshows an impervioussurface area of 3.8%,which equates to a lowsusceptibility rank (Table4). This portion of thewatershed is the mostdeveloped area andtherefore is likely aconservative estimate ofimpervious surface area forthe entire watershed. Thisportion of the watershed has 0.5% of the area "in transition" or exposed soil. There are26 railroads crossing streams within the IMZ and there are no large sewer lines over10". Approximately 1% of the watershed is sewered (Figure 12). A review of theGeorgia Department of Natural Resources list of impaired waterways (Georgia 2000)929WaterbodiesTownhome/Apartment89High Density Residential844920Medium Density Residential1254Major RoadsAg/Pasture and Cropland4913922268Low Density Residential123224Open/Forest1084Office/Light Industrial663Heavy 00,000AcresDECEMBER 2001- 17 -120,000140,000
CHEROKEE COUNTY WATER & SEWERAGE AUTHORITYCITY OF CANTON WATER & SEWER DEPARTMENTshows 1 segment in violation of water quality standards. The major cause ofimpairment was urban runoff. A list of the stream segments is included in Appendix D.The overall non-point source susceptibility ranking is therefore Low.Table 4. Impervious Surface Area in the Etowah Watershed (partial)Land Cover ClassificationAcres inImperviousImpervious% ofWatershed Coefficient Area (Acres)WatershedAgricultural 1,52485%1,2950.7%Heavy Industrial/Utilities66380%5310.3%Major Roads1,25490%1,1280.6%Office/Light 1660.1%ResidentialHigh Density8426%220.0%Medium Density4,92019%9352.4%Low ng the individual and non-point source rankings gives an overallsusceptibility ranking of MEDIUM.Although the drinking water intake ranks medium susceptibility to potentialpollution, water quality reports (Appendix D) for the City of Canton Water & SewerDepartment drinking water show no violations in water quality.Watershed IssuesAccidental Spills. Accidental spills were reviewed for each watershed. These spillsrepresent non-point source pollution within developed areas. The spill data was alsoreferred to when evaluating the susceptibility criteria in the individual source analysis.Four sources of data were used to collect information on accidental spills within thewatershed. The four programs are the Hazardous Site Response Program, the WaterQuality Branch, the Emergency Response Program, and EPD enforcement actions. Allof the data sources include spills reported from 1997-2000 to GA EPD.Within the Atlanta Region, approximately 5619 accidental spills were reported. Of thesespills, approximately 36% or 2029 were mappable. Due to the nature of the spillreporting, it is difficult to use the available data. Also, this data does not represent thetotal number of spills within a watershed. Within this watershed there are 29 identifiableaccidental spill sites (Figure 13). These spills cover a wide range from the type ofDECEMBER 2001- 18 -
EllijayFannin Co.Union Co.Potential Non-PointPollutant SourcesZ %aGilmer Co.Major Road Crossing StreamRailroad Crossing StreamLumpkin Co.Land In TransitionGeneralized Sewered AreaPickens Co.%aZ Z Z Z Z Z Z Z Z Z Z Z ZJasperDawson Co.Z Z Z ZZ ZDawsonville ZNelsonYellow CreektoEReservoirwahZ Z ZreR(Future Site ofivBall GroundHickory Log ZrZ Z %a Z Z Z Z Z Z Z Z%aZ Z Z %a Z Z%a %aZ Z %a Z Z ZZ Z Z Z %a%a Z Z%ahaw Z Z%a%a%a%a Z Z Z Z Z Ze Z Z Z %a%a Z Z ZZ %a%a Z Z%a%a%aR ZivZ Z ZEtoReservoir),.Canton575Cherokee Co. Z Z ZZ Z Z Z ZForsyth Co.Cumming!"400LegendWatershed BoundaryInner Management ZoneStreams & RiversLakes & ReservoirsFreewayHolly SpringsMajor RoadsRailroadsPotential Non-Point Sources of PollutionIncorporated City BoundariesCounty BoundariesCity of Canton Water & Sewer DepartmentFigure 12Etowah River Water Supply Watershed
CHEROKEE
Plans for 28 Metro Atlanta public drinking water intakes. The goals of this project include: 1. Delineating the water supply watershed for each drinking water intake, 2. Developing an inventory of potential sources of contamination, 3. Determining the susceptibility of drinking water sources to identified potential sources of contamination, and 4.