Transcription
SymposiumOrchestration Tools for Teachers in the Context of Individual andCollaborative Learning: What Information Do Teachers Need andWhat Do They Do With It?Anouschka van Leeuwen (organizer), Ruhr-Universität Bochum / Utrecht University, a.vanleeuwen@uu.nlNikol Rummel (organizer), Ruhr-Universität Bochum, nikol.rummel@rub.deVincent Aleven, Carnegie Mellon University, aleven@cs.cmu.eduKobi Gal, Ben-Gurion University, kobig@bgu.ac.ilKenneth Holstein, Carnegie Mellon University, kjholste@cs.cmu.eduCarolien Knoop-van Campen, Radboud University, c.knoop-vancampen@bsi.ru.nlBruce M. McLaren, Carnegie Mellon University, bmclaren@cs.cmu.eduInge Molenaar, Radboud University, i.molenaar@pwo.ru.nlNaomi Prusak, Hebrew University, naomi.ori@mail.huji.ac.ilNikol Rummel, Ruhr-Universität Bochum, nikol.rummel@rub.deBaruch Schwarz, Hebrew University, baruch.schwarz@mail.huji.ac.ilAvi Segal, Ben-Gurion University, avis@bgu.ac.ilOsama Swidan, Ben-Gurion University, osamas@bgu.ac.ilAnouschka van Leeuwen, Ruhr-Universität Bochum / Utrecht University, a.vanleeuwen@uu.nlAlyssa Wise (discussant), New York University, alyssa.wise@nyu.eduAbstract: This symposium brings together research concerning orchestration tools aimed atsupporting teachers in providing real time support to students in the classroom. Orchestrationtools are based on the idea of capturing, analyzing, and visualizing student activities duringclass time and feeding them back to teachers to facilitate real time monitoring and support ofstudents. With examples from the contexts of individual and collaborative learning, thesymposium addresses two questions, namely what information about student activitiesteachers need, and how teachers use orchestration tools in their classrooms. Two papers focuson the first question, and furthermore investigate how teachers respond to initial versions oforchestration tools. The remaining two papers focus on how teachers actually useorchestration tools in their classrooms. The symposium as such offers examples of state of theart research and ample opportunity for discussing future directions in the field of teacherorchestration tools.Focus of the symposium – teacher orchestration toolsTeachers play an essential role for student learning, as they are responsible for monitoring and orchestratingboth cognitive and metacognitive processes, as well as social processes when it concerns collaboration amongstudents (Kaendler et al., 2015; Prieto et al., 2011). Most computer-supported learning environments enablecapturing of student activities, which can then be (automatically) analyzed and visualized on so called teacherorchestration tools to support teachers in the real-time orchestration of student learning (Verbert et al., 2014;Wise & Vytasek, 2017). In the growing field of research on teacher orchestration tools, important questionsarise concerning the design and implementation of teacher orchestration tools (Van Leeuwen & Rummel, 2017).We need to ask what type of support teachers need from dashboards during their practice, and what factorsenable or constrain the successful implementation of dashboards that provide support for teachers. Thissymposium brings together research concerning teacher orchestration tools, with examples from the contexts ofindividual and collaborative learning. The symposium focuses on two particular issues: 1) what information doteachers need that would help them to support their students, and how does that translate to design of anorchestration tool? Subsequently, 2) once the orchestration tool is designed, how do teachers actually use themin their classrooms? As an overarching question, we are interested in what lessons can be drawn about whatmakes orchestration tools helpful for teaching and learning.Outline of contributionsThe underlying structure of the symposium is a 2x2 design. The most prominent distinction between the papersis whether they address the design phase of orchestration tools, in particular the question of what informationICLS 2018 Proceedings1227 ISLS
teachers need and how they respond to initial version of orchestration tools, or the implementation oforchestration tools, in particular how teachers actually use the orchestration tool in the classroom. A furtherdimension to characterize the contributions on is whether they provide an example of teacher orchestration toolsin the context of individual learning or collaborative learning. Table 1 shows the 2x2 design of the symposiumand the corresponding contribution for each cell.Table 1: Overview of symposium contributionsContextWhat information do teachers need?Individual learningHolstein et al.(contribution 1)What do teachers do with adashboard in the classroom?Molenaar et al.(contribution 3)Collaborative learningVan Leeuwen et al.(contribution 2)Schwarz et al.(contribution 4)Holstein et al. (contribution 1) and Van Leeuwen and Rummel (contribution 2) focus on whatinformation teachers need to make decisions during the real time support of their students, using severaltechniques for eliciting teachers’ thoughts. Holstein et al. followed a participatory design approach to elicitteachers’ needs for information. They also employed simulated class sessions and small studies in liveclassrooms to test initial versions of their orchestration tool. Van Leeuwen et al used contextual inquiry andstoryboarding to gauge teachers’ responses to situations in their everyday practice as well as future scenarios ofhow orchestration tools could be implemented.Molenaar and Knoop-van Campen (contribution 3) and Schwarz et al. (contribution 4) present studieson how teachers actually use orchestration tools in the classroom. In both studies, quantitative as well as richqualitative data was obtained about how teachers interpreted the orchestration tool and how it guided theirpractice. By doing so, Molenaar et al for example demonstrate how differences in teachers’ experience withorchestration tools influences the extent and specific way of using the orchestration tool as well as the type offeedback teachers give to their students. Schwarz et al. observed and interviewed a teacher in two cohorts ofsupporting multiple collaborating groups, illustrating how the teacher detected the needs of the groups by acombination of using the orchestration tool and his own observations.The four contributions together touch upon several recurring issues that are of interest to the ISLScommunity. For example, the role of teachers’ prior knowledge of their students is a recurring issue both in thedesign and implementation of orchestration tools. Another recurring issue is the way the teacher and theorchestration tool ‘complement’ each other: which tasks are best performed by the teacher, and what specificrole should the orchestration tool take on? Another overarching issue is the role of context. Although all papersare situated in the domain of mathematics, two papers concern individual learning, and the other two concerncollaborative learning. As such, the question is whether teachers’ needs for information and how they useorchestration tools differs for these contexts – is the orchestration load on teachers different in these twosituations, and what does that mean for designing orchestration tools?Outline of the symposium during ICLS2018Our plan for the symposium session is to first have brief reports about the four studies. During the fourpresentations, the audience is invited to share their questions and points for discussion through PresentersWall, alive feed that displays the audience’s input. For example, audience input could concern ideas about: (1) whatlessons we can learn from the four studies concerning factors that make orchestration tools more or lesseffective, and (2) how the emerging field of teacher orchestration tools needs to develop and what might bepromising directions for future research.Then, the discussant (Alyssa Wise) is asked to respond to a selection of the audience’s input in light ofthe four presentations and in light of her own expertise. Finally, the floor will be opened for plenary discussion.To summarize, by bringing together four studies concerning the design and implementation of teacherorchestration tools, our aim is to offer examples of new empirical work and to address important questions inthis field that are of interest to the ISLS community. The following pages contain brief descriptions of all fourcontributions to the symposium.ICLS 2018 Proceedings1228 ISLS
Balancing between teacher and student needs in the design of classroomorchestration toolsKenneth Holstein, Bruce M. McLaren, and Vincent Aleven, Carnegie Mellon UniversityIntroductionTeacher orchestration tools are frequently designed to support teachers in more effectively monitoring theirstudents, under the hypothesis that this will ultimately lead to improved student learning (Molenaar & Knoopvan Campen 2017; Rodriguez-Triana, et al., 2017; Van Leeuwen, 2015). Such tools must also be both usableand useful to teachers; designed based on an understanding of teachers’ needs and desires for real-time support,and the actual challenges they face in orchestrating complex classroom activities (Rodriguez-Triana, et al.,2017). In our current work, we are designing real-time orchestration tools for classrooms using intelligenttutoring systems (ITSs). We examine teachers’ expressed desires for real-time analytics and students’ observedneeds for teacher support, investigating how best to balance between these.MethodsIn the first phase of our design process, we adopted a participatory design approach (Hanington & Martin,2012), working closely with K-12 math teachers to understand their desires for real-time analytics, and directlyinvolving them throughout the design process (Holstein, Hong, Tegene, McLaren, & Aleven, 2018a; Holstein,McLaren, & Aleven, 2017). The resulting prototype is a pair of mixed-reality smart glasses, which augmentteachers’ perceptions of student learning, metacognition, and behavior – displaying real-time indicators floatingdirectly above students’ heads. The indicators shown by Lumilo are ideas generated and iteratively refined byteachers, and implemented using established student modeling methods (e.g., Desmarais & Baker, 2012).To understand how teachers might use Lumilo, prior to deploying in real classrooms, we conducted aseries of simulated class sessions, using a new prototyping method called Replay Enactments (REs). In each ofsix sessions, historical student interactions were replayed in ITS interfaces, on separate computers in aclassroom setting (but with no actual students present). During 40-minute replay sessions, teachers woreLumilo, while monitoring the "class". If a teacher thought they would intervene with a “student” at a given time,the teacher would approach and enact the help session aloud (Holstein et al., 2018a). Meanwhile, Lumilotracked teacher activity moment-by-moment. Analyses of data from 6 REs suggested that Lumilo can guideteachers’ time towards students who would otherwise exhibit lower learning in the software, as measured byposttest scores, controlling for pretest (r -0.17, p 0.01) (Holstein, et al., 2018a). However, the magnitude ofthis correlation suggested room for improvement. We adopted a causal model search approach (Spirtes,Glymour, & Scheines, 2000) to identify mediators of this observed relationship, which could inform a redesign.Results and discussionThrough our co-design process, 8 indicator types emerged. These included “misuse of the software” (dividedinto gaming-the-system/help-abuse and making rapid attempts), unproductive persistence or “wheel-spinning”(Beck & Gong, 2013), high/low recent performance, help avoidance (Aleven, Roll, McLaren, & Koedinger,2016), and prolonged inactivity. Importantly, we found that some of these alerts were valuable to teachers forreasons other than guiding interventions. For example, teachers found alerts about high recent performancevaluable, in part, because they found such alerts personally motivating (Holstein et al., 2017; 2018a).Using data from REs, we found that teacher time allocation while using Lumilo was strongly driven byalerts of student rapid attempts or gaming/help-abuse, but less strongly by high recent error rate orunproductive persistence (Holstein, McLaren, & Aleven, 2018b). Other alert types did not significantly driveteacher time. The causal model learned with FCI (Spirtes et al., 2000) on data from 115 middle school mathstudents suggested that, out of 7 teacher-generated ideas for negative alerts, only one corresponded to a studentstate with a direct harmful impact on student learning: unproductive persistence (Beck & Gong, 2013). Basedon these analyses, we iterated upon Lumilo’s design, prioritizing alerts about unproductive persistence and itsidentified causes (help avoidance or gaming/help-abuse). In subsequent studies, teachers using this updatedprototype in live classrooms continued to make use of all alert types. At the same time, the strongest predictorsof teachers’ overall time allocation were alerts of unproductive persistence, followed by help avoidance andgaming/help-abuse, suggesting the redesign may have been effective in redirecting teachers’ time to studentbehaviors with the greatest impact on learning (Holstein, McLaren, & Aleven, 2018b; 2018c).AcknowledgementsICLS 2018 Proceedings1229 ISLS
We thank all participating teachers and students. This work was supported by NSF Award #1530726, and byIES, U.S. Department of Education, through Grant R305B150008 to CMU. The opinions expressed are those ofthe authors and do not represent the views of the Institute or the U.S. Department of Education.Considering teachers’ informational needs and the role division betweenteacher and orchestration tool in the context of collaborative learning.Anouschka van Leeuwen, Ruhr-Universität Bochum / Utrecht University and Nikol Rummel, Ruhr-UniversitätBochumIntroductionTeacher orchestration tools are hypothesized to support teachers in monitoring and supporting student learning(Van Leeuwen, 2015). The study presented here served as input to developing a teacher orchestration tool in thecontext of collaborative fraction assignments. It was examined what information teachers need to makeinformed decisions, and what role division between teacher and orchestration tool best serves teachers’ practice.MethodElaborate sessions lasting 1.5 hours were held with 10 primary school teachers (8 were female), in whichmultiple techniques were used for eliciting teachers’ thoughts. The teachers’ mean age was 30.2 (SD 3.9). Onaverage, they had 8.2 years teaching experience (SD 7.4). The interviews consisted of two parts. In the firstpart of the interview we used contextual inquiry, which means understanding of teachers’ experiences wassought by asking how they would act and react in certain situations (Hanington & Martin, 2012). Teachers wereprompted with different types of situations that may occur during orchestration of collaborative learning, andwere asked to explain as fully as possible how they would act and what information they would need to makedecisions. Second, storyboarding was used to elicit teachers’ responses to four scenarios of how a teacher coulduse an orchestration tool (see Table 2 for an example). With storyboarding, drawn stories are used of howintended users may interact with the object under study (Hanington & Martin, 2012), in this case the objectbeing teacher orchestration tools. The storyboards differed in the function the orchestration tool fulfilled,ranging from only displaying information, to alerting the teacher, to advising the teacher what to do.Table 2: Example of storyboard12341. Students are collaborating in dyads. Teacher walks through the classroom with dashboard. 2. Dashboard gives an alert aboutgroup 1, who made relatively many mistakes and asked for a lot of hints. 3. Teacher notices another group raises their hand, butdecides to go to group 1 first. 4. Teacher gives explanation until group 1 grasps the idea, then walks to the group that raised theirhand.Results and discussionThe contextual inquiry elicited 6 types of information that teachers use during collaborative learning to decidewhether a group needs help: background information about the students in a group (like mathematical ability),whether groups get stuck (either because a task is too easy or too difficult), whether students showunderstanding of task-related concepts, whether groups are involved with the task (or display off-task behavior),the quality of the interaction between group members, and whether the group shows metacognitiveunderstanding of their own strategies and progress. The storyboarding revealed that teachers would especiallyappreciate it if orchestration tools could help them with noticing students’ misconceptions or point them toproblems in the group interaction early on, in order to enable timely intervention. Also, teachers expressed needICLS 2018 Proceedings1230 ISLS
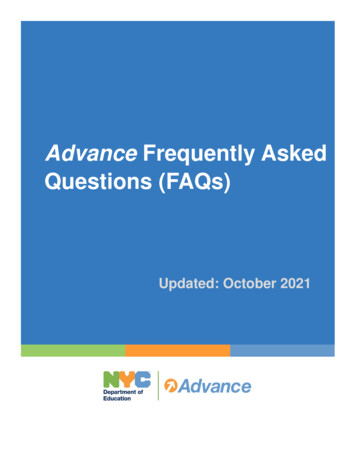
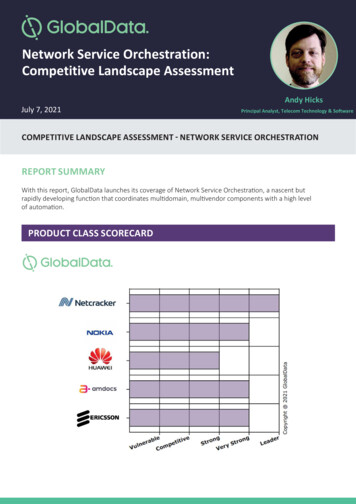
for support with monitoring multiple groups at the same time. The results are used as input for a follow up studyin which we examine how teachers use orchestration tools that fulfill different roles.AcknowledgmentsThis work was supported by the Netherlands Organization for Scientific Research (NWO) through a Rubicongrant [grant number 446-16-003/1276].Experience matters: The impact of dashboards on teachers’ feedbackInge Molenaar and Carolien Knoop-van Campen, Radboud UniversityIntroductionTeacher dashboards provide teachers during lessons with concurrent information about students’ abilities,progress, performance, and errors made (Molenaar & Van Schaik, 2017; Van Leeuwen et al. 2014). Teacherscan use this information to adapt their teaching practices to the students’ individual needs, but only whenteachers are aware of the data, able to interpret the data properly, and can translate their interpretation intoappropriate pedagogical actions (Molenaar & Knoop-van Campen, 2017; Verbert et. al. 2014). We expect thatteacher experience with dashboards is likely to influence how they use dashboards during teaching. Therefore,this study examines how teachers’ dashboard usage during lessons influences feedback given to individualstudents, and how this is associated with teachers’ experience.MethodPrimary school teachers (N 40) were observed during one mathematics lesson (50 minutes) taught in grade 2to 6. Adaptive educational technology (Snappet) is used on a daily basis in these classrooms. While studentsmade exercises on their tablets, realtime data of learner progress and performance were shown on dashboards.The observations were performed by Snappet-coaches (expert-teachers with a coaching function). They weretrained to observe teachers’ feedback (task, person, process, social & metacognitive) and initiating actions(dashboard, student, teachers) using the Classroom Observation App. A distinction was made between inexperienced (N 12), middle (N 12) and experienced (N 16) teachers. Both teachers themselves andobservers indicated teachers’ experience in using the adaptive educational technology. The agreement-ratebetween teachers and observers was 70%, in case of disagreement the observers coding was followed. Noneparametric analyses were performed with Independent-Samples Kruskal-Wallis Tests.ResultsOn average teachers gave 49.95 times (SD 26.79) feedback to an individual student during a lesson and nodifferences in feedback frequency were found between in-, middle and experienced teachers. Teachers consultedthe dashboard on average 7,83 times (SD 8.06) during a lesson and as expected experienced teachersconsulted the dashboard more often (M 11.63, SD 8.96), compared to middle (M 6.08, SD 11.63) and inexperienced teachers (M 4.92, SD 8.24), H(2) 8.61, p .014. On average 72% (SD 26%) of a teachers’dashboard consultations were followed by feedback and this did not differ between the three groups. Mostfeedback was given on teachers own initiative (58%) or in response to students’ questions (29%), only 13% ofthe feedback was provided after dashboard consultation. Although they did not differ in the frequency of givingfeedback, experienced teachers provided feedback more often after dashboard consultation (17%) compared tomiddle (9%) and in-experienced teachers (10%), H(2) 7.38, p .025 (see Figure 1). Additionally, a significantdifference was found with regard to the type of feedback given: experienced teachers gave more feedbackrelated to the task (34%) compared to in-experienced teachers (21%), H(2) 8.91, p .012 (see Figure 2).ICLS 2018 Proceedings1231 ISLS
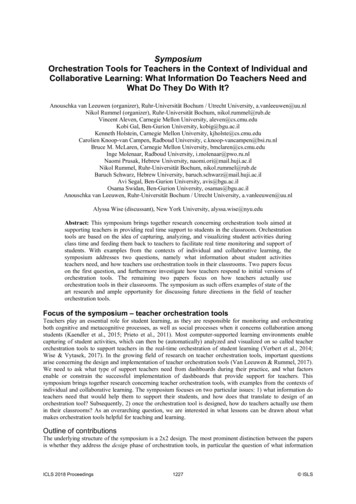
Figure 1. Feedback initiation.Figure 2. Types of feedback.DiscussionResults indicated that even though the majority of the dashboard consultations resulted in feedback given toindividual students, only a small part of all feedback was initiated by a dashboard consultation. We foundevidence that more experience teachers gave more feedback based on dashboard consultations and they alsodiffered in the type of feedback given. Teachers with more experience provided more task related feedback tostudents. This indicated that these teachers not only use the dashboard more often to inform their feedbackactions, but that they also used the dashboard information differently to customize feedback to the needs ofindividual students. This demonstrated that dashboards indeed support teacher to adapt their teaching practicesto the need of individual students and especially after teachers gained sufficient experience in using theorchestration tools.Orchestrating deep learning: A case-study in a geometry classBaruch Schwarz, Hebrew University; Naomi Prusak, Hebrew University; Osama Swidan, Ben-GurionUniversity; Avi Segal, Ben-Gurion University; and Kobi Gal, Ben-Gurion UniversityIntroductionThis paper is about orchestration of deep learning in a collaborative setting. We elaborate on the idea of criticalmoments in group-learning, events whose occurrence may lead to a particular development at the epistemiclevel regarding the shared object. We relied on research in educational psychology to identify seven criticalmoments: (a) idleness, (b) off-topic-talk, (c) technical problems, (d) explanation or challenge, (e) confusion, (f)correct solution and (g) incorrect solution. We conjectured that the teacher’s identification of critical momentsmay facilitate further guidance towards deep learning among students. The complexity of small group settingsin a classroom context does not allow teachers to be aware about these critical moments, though. Figure 3describes the SAGLET system, based on the VMT environment (Stahl, 2009), which allows teachers to observemultiple groups engaging on problem solving in geometry. In Figure 3, we see that a teacher observes fourICLS 2018 Proceedings1232 ISLS
windows of the VMT system. She is informed about a correct solution in room 696 and about a technicalproblem in room 697.Figure 3. The SAGLET system, based on the VMT environment (Stahl, 2009).MethodSAGLET capitalizes on machine learning techniques to inform on on-line critical moments, by sending alerts tothe teacher, who decides then whether (and how) to use the alerts in his/her guidance of students. One teacher inan elementary school used SAGLET in order to help multiple groups of students solving difficult tasks ingeometry. We observed how the teacher mediated two cohorts of multiple groups at two different times in amathematics classroom. The teacher was trained to use the SAGLET system, and designed challengingproblems in geometry that necessitated collaboration between Grade 6 students. Five groups of 2-3 wereformed.ResultsWe show that in both cases, the teacher could detect the needs of the groups (partly thanks to the alerts) andcould provide adaptive guidance to all groups. We identified five kinds of intervention. Most of theinterventions were of a scaffolding argumentation type. We see that the scaffolding of argumentation is the mostfrequent type of intervention. As mentioned before, this kind of intervention fits the CSCL spirit according towhich guidance is ancillary to the co-construction of meaning. We saw that the forms of this scaffolding arevaried, and included challenges or refutations expressed either in a chat mode or through GeoGebra. The mostfrequent intervention after the scaffolding of argumentation is the monitoring and supervision of the executionof the task – an intervention that refers to orchestration. The request for justifications and the social validationhave a flavor of both orchestration and support to meaning making. It is noteworthy that the less frequent typeof intervention is the encouragement of collaboration. After one preparatory session with SAGLET, studentswere already accustomed to collaborate – a fact that indicates that VMT affords collaboration.ReferencesAleven, V., Roll, I., McLaren, B. M., & Koedinger, K. R. (2016). Help helps, but only so much: Research onhelp seeking with intelligent tutoring systems. IJAIED, 26(1), 205–223.Beck, J. E., & Gong, Y. (2013). Wheel-spinning: Students who fail to master a skill. In Springer (Ed.), AIED(pp. 431–440). Berlin, Heidelberg.Desmarais, M. C., & Baker, R. S. J. D. (2012). A review of recent advances in learner and skill modeling inintelligent learning environments. UMUAI, 22, 9–38.Hanington, B., & Martin, B. (2012). Universal methods of design: 100 ways to research complex problems,develop innovative ideas, and design effective solutions. Osceola, US: Rockport Publishers.Holstein, K., Hong, G., Tegene, M., McLaren, B.M., & Aleven, V. (2018a). The classroom as a dashboard: Codesigning wearable cognitive augmentation for K-12 teachers. In LAK’18 (pp. 79-88). ACM.Holstein, K., McLaren, B.M., & Aleven, V. (2017). Intelligent tutors as teachers’ aides: exploring teacher needsfor real-time analytics in blended classrooms. In LAK’17 (pp. 257–266). ACM.ICLS 2018 Proceedings1233 ISLS
Holstein, K., McLaren, B.M., & Aleven, V. (2018b). Informing the design of teacher awareness tools throughCausal Alignment Analysis. To appear in ICLS’18.Holstein, K., McLaren, B.M., & Aleven, V. (2018c). Student learning benefits of a mixed-reality teacherawareness tool in AI-enhanced classrooms. To appear in AIED’18.Kaendler, C., Wiedmann, M., Rummel, N., & Spada, H. (2015). Teacher Competencies for the Implementationof Collaborative Learning in the Classroom: a Framework and Research Review. EducationalPsychology Review, 27(3), 505–536.Molenaar, I., & Knoop-van Campen, C. A. N. (2017, September). Teacher dashboards in practice: Usage andimpact. In European Conference on Technology Enhanced Learning (pp. 125-138). Springer, Cham.Molenaar, I. & van Schaik, A. (2017). A methodology to investigate classroom usage of educationaltechnologies on tablets. In Aufenanger, S. & Bastian, J. (Eds). Tablets in Schule und Unterricht.Forschungsergebnisse zum Einsatz digitaler Medien. Springer.Prieto, L. P., Holenko Dlab, M., Gutiérrez, I., Abdulwahed, M., & Balid, W. (2011). Orchestrating technologyenhanced learning: a literature review and a conceptual framework. International Journal ofTechnology Enhanced Learning, 3(6), 583-598.Rodríguez-Triana, M. J., Prieto, L. P., Vozniuk, A., Boroujeni, M. S., Schwendimann, B. A., Holzer, A., &Gillet, D. (2017). Monitoring, awareness and reflection in blended technology enhanced learning: Asystematic review. IJTEL, 9(2–3), 126–150.Spirtes, P., Glymour, C. N., & Scheines, R. (2000). Causation, prediction, and search. MIT press.Stahl, G. (2009). Studying Virtual Math Team. Springer New York Dordrecht Heidelberg London.Van Leeuwen, A. (2015). Learning analytics to support teachers during synchronous CSCL: balancing betweenoverview and overload. Journal of Learning Analytics, 2, 138–162.Van Leeuwen, A., Janssen, J., Erkens, G., & Brekelmans, M. (2014). Supporting teachers in guidingcollaborating students: Effects of learning analytics in CSCL. Computers & Education, 79, 28-39.Van Leeuwen, A., & Rummel, N. (2017). Teacher regulation of collaborative learning: research directions forlearning analytics dashboards. In: Proceedings of the 12th international conference on Computersupported Collaborative Learning (CSCL) 2017, Volume 1, pp 805-806.Verbert, K., Govaerts, S., Duval, E., Santos, J. L., Van Assche, F., Parra, G., & Klerkx, J. (2014). Learningdashboards: an overview and future research opportunities. Personal and Ubiquitous Computing, 18(6),1499-1514.Wise, A. F., & Vytasek, J. (2017). Learning analytics implementation design. In C. Lang, G. Siemens, A. F.Wise, & D. Gasevic (Eds.), Handbook of Learning Analytics (pp. 151-160). Society for LearningAnalytics Research.ICLS 2018 Proceedings1234 ISLS
students (Kaendler et al., 2015; Prieto et al., 2011). Most computer-supported learningenvironments enable capturing of student activities, which can then be (automatically) analyzed and visualized on so called teacher orchestration tools to support teachers in the real-time orchestration of student learning (Verbert et al., 2014;