Transcription
5th International Conference on Higher Education Advances (HEAd’19)Universitat Politècnica de València, València, 2019DOI: ing Data Analysis and Statistics Across DisciplinesAnna BargagliottiDepartment of Mathematics, Loyola Marymount University, United States.AbstractTo respond to this increased attention to statistics in society and work force,as well as to contribute to improved career preparation for students, it isimperative that we foster data literacy in our university student population.This paper discusses 13 learning outcomes that describe Advanced DataLiteracy for university level students across different disciplines.Keywords: Data Science; Statistics; Undergraduate Education.This work is licensed under a Creative Commons License CC BY-NC-ND 4.0Editorial Universitat Politècnica de València341
Integrating Data Analysis and Statistics Across Disciplines1. IntroductionThe demand for people educated in statistics and data science has grown tremendously overthe past decade. Jobs related to statistics are expected to grow by about 27% between 2012and 2022 according to the Bureau of Labor Statistics (Bureau of Labor Statistics, 2013).Key attributes to be successful in such jobs are good computing, analytic and statisticalskills, good communication skills, ability to work with real data, ability in storytelling withdata both verbally and visually, and the ability to work as a team (Davenport and Patil,2012).To respond to this increased attention to statistics in society and work force, as well as tocontribute to improved career preparation for students, it is imperative that we foster dataproficiency in our university population. Following the recommendations of the AmericanStatistical Association put forth in the new Curriculum Guidelines for UndergraduatePrograms in Statistics (ASA, 2014), this paper discusses how statistics and data analysisbridges many disciplines and how the different discipline approaches can be integrated. Inthis paper, we outline a series of common learning outcomes across disciplines forachieving data proficiency on a university campus.2. Statistics and Data Science Education at the Universities Across DisciplinesUniversities typically have several different statistics course offerings across campus.Because it is very common to have statistics courses housed in different disciplines (e.g.,mathematics, computer science, psychology, economics), the American StatisticalAssociation (ASA) and Mathematical Association of America (MAA) have offeredguidelines for teaching introductory statistics targeted at non-statistics departments(ASA/MAA Joint Statement, 2014). Often times these courses overlap and yet theirprerequisite structures do not allow a student to move from a statistics course offered in onedepartment to a more advanced course offered by another department. Departments, oftenrightfully argue that the type of statistical techniques needed are discipline specific and thusnecessitate the offering of a course within a specific discipline.Although specific techniques do vary from discipline to discipline, certain basic themes ofworking with data should be present in all courses. Three important, fundamental, andparticularly timely themes are that students need to (1) be employing technology, (2) beexploring real data sets, and (3) be practicing communicating statistical ideas and results.Moreover, in all disciplines, statistics should be guided and taught through the statisticalinvestigative process of formulating a question, collecting appropriate data to answer thatquestion, choosing the appropriate analysis technique to answer that question, andinterpreting the results to answer the question (Franklin et al, 2007). The materialcommonly taught in introductory statistics courses often focuses on techniques, but such342
Anna Bargagliottimethods are often “necessary but not sufficient” for modern data science (Hardin et al,2015; Ridgeway, 2015).Several important reports have stated the need for students to work with real data. TheCommittee on the Undergraduate Program in Mathematics Curriculum Guide 2015(CUPMC, 2015) states “Working mathematicians often face quantitative problems to whichanalytic methods do not apply. Solutions often require data analysis, complex mathematicalmodels, simulation, and tools from computational science.” This report recommends that allmathematical sciences major programs include concepts and methods from data analysisand computing. The Guidelines for Assessment and Instruction in Statistics Education(GAISE) college guidelines also included working with real data as one of the necessary sixcomponents of structuring a statistics course (ASA, 2016). In addition, therecommendations of the ASA on undergraduate programs in data science include RealApplications and Problem Solving as two of their Background and Guiding Principles.They state programs should “emphasize concepts and approaches for working withcomplex data and provide experiences in designing studies and analyzing real data (definedas data that have been collected to solve an authentic and relevant problem)” (ASA, 2014).As data science has been described as an intersection of statistics with computer science,when considering undergraduate preparation, one must consider how the use of softwareinterplays with statistics. Regardless of the discipline, technological fluency has become amust for success in the workforce. Therefore, university statistics and data science coursesmust incorporate heavy use of technology and computing.Working with technology, working with real data, and communicating results provide theunifying themes for statistics and data science course offerings across campuses. If a modelexisted for what courses should look like across different departments that were centered onsuch themes, then the door may open for students seeking statistics and data science beyondwhat their departments offer.2.1. Teaching and Learning of Statistics and Data Science at UniversitiesMuch research has been dedicated toward uncovering best practices for undergraduatestudents’ learning of statistics. This research has largely targeted introductory statisticscourses. A focus of the research has been to identify statistics topics and concepts thatstudents have difficulty learning (Garfield & Ben-Zvi, 2008). Often students rely on “plugand-chug” methods to solve problems without understanding the statistical ideas beingdiscussed (Chervany et al., 1977; Stroup, 1984; delMas, 2004).As noted by Horton & Hardin (2015), little research has targeted statistics learning beyondthe introductory course. Given the the rapid growth of statistics and data science, it isimportant for research to “catch up” and inform best practices in developing, implementing,343
Integrating Data Analysis and Statistics Across Disciplinesand assessing programs. In addition, understanding how data science and computinginterplay with statistics program offerings is currently an under-researched topic. Datascience, as described by Baumer (2015), is “an emerging interdisciplinary field thatcombines elements of mathematics, statistics, computer science, and knowledge in aparticular application domain for the purpose of extracting meaningful information from theincreasingly sophisticated array of data available in many settings.” Some researchers havesuccessfully implemented data science courses at their institutions (e.g., Hardin et al, 2015,Baumer, 2015) with similar student learning goals.2.2. Statistics and Data Science at Loyola Marymount UniversityThe National Science Foundation (NSF)-funded project (NSF Grant No. 1712296),Undergraduate Data Pathways (UDaP), focuses on understanding differences andsimilarities of statistics and data analysis course offerings across different disciplines.Using Loyola Marymount University (LMU), a mid-sized comprehensive university in LosAngeles, California that offers 53 major and 57 minor undergraduate programs; 31 master’sdegrees; one doctoral degree; and 15 credential programs as a case study, the projectdefined a set of learning outcomes that integrated the statistical goals put forth by severaldifferent disciplines.While LMU does not have a department dedicated to statistics or data science, theDepartment of Mathematics, Department of Biology, Department of Engineering,Department of Economics, Department of Political Science, Department of Psychology,Department of Sociology, the School of Business, and the School of Education offercourses related to statistics and data analysis. Several of the introductory courses offered inthese departments overlap in content thus creating an appearance of duplication andpotential wasted resources across campus. Furthermore similar courses in one departmentare often not accepted as prerequisites for higher-level statistics offered in anotherdepartment, thus blocking the pipeline for students to advance their statistical knowledge.Because of LMU’s breadth of programs, its size and relatively typical situation regardingstatistical course offerings, the findings for LMU can provide a model for other universitieswishing to unify statistics offerings across disciplines around working with real data,technology, and emphasizing communication.3. ProcessesFive steps have been undertaken to research the differences and commonalities of statisticsand data analysis across disciplines. As a first step, a faculty working group withrepresentation from mathematics, economics, biology, psychology, sociology, business, andstatistics was formed. The working group was centered around understanding the processesand support needed to implement the themes of communication, technology, and real data344
Anna Bargagliottiin statistics courses across the disciplines. Four meetings per semester have consistentlybeen scheduled over the course of the last two academic years. The purpose of the workinggroup discussions is to gather qualitative data on how the different disciplines articulatedthe importance of statistics and to reach common ground to understand what all of thediscipliens had in common.The second step in the process was to develop and administer a 15 minute survey to theworking group. The survey asks about the software platforms they used, data sources theyused, the types of class assignments they gave (e.g., statistics investigations in the form ofprojects, problem sets), and the types of activities they used in the classroom (e.g., studentsusing computers in a lab setting, group work). The survey included questions from theNSF-funded Statistics Teaching Inventory (STI) surveys developed by Zieffler et al.(Zieffler, 2012) focusing on their teaching practice, assessment practice, teaching beliefsand assessment beliefs.A third step was to review any position statements, policy documents, or curriculumguidelines written by professional organizations regarding data proficiency to understandwhether there was common ground between the disciplines.A fourth step included carrying out a survey to the community, both academic and nonacademic, to garner their thoughts on the necessary learning outcomes for statistics and dataanalysis at the university level.Lastly, the culminating step of the work was to develop a set of learning outcomes forteaching and learning data-related courses based on the findings of the prior steps. Thirteensuch learning outcomes were agreed upon.4. FindingsThe Table 1 presents the final 13 learning outcomes that were established as important forstudents to meet at the university level. Students meeting these learning outcomes aredeemed to be Advanced Data Literate.The learning outcomes span both content and process. The important themes of using realdata, communication with data, and technology are well-represented withing the learningoutcomes as well. These outcomes are meant to be broad and cross-disciplinary so they canserve as benchmarks across all disciplines offering statistics and data analysis courses.These learning outcomes stemmed from the extensive discussions within the working groupas well as the review of the policy documents and the community survey.345
Integrating Data Analysis and Statistics Across DisciplinesTable 1. Learning Outcomes and ts formulate and/or address questions about univariate data, collect/considerunivariate data, analyze univariate data, and interpret results2Students understand, calculate and interpret descriptive measures for quantitativeand/or categorical variables to describe characteristics of the data3Students create and interpret basic data visualizations for quantitative and categoricalvariables4Students understand, carry out, and interpret basic inferential statistical procedures forone or two samples5Students understand, carry out, and interpret results from estimating statistical modelsfor bivariate data (e.g., linear regression, interpolation, extrapolation, predictiveinference)6Student carry out and communicate results from extensive data-driven project(s) that isrelated to a real-life problem (extensive means that a single project takes more thantwo weeks to complete or a series of projects take more than two weeks to completeand are worth at least 25% of the final grade)7Students communicate their analyses and the interpretations of their results in a mannerthat is appropriate to their discipline in the context of the data (e.g., communicationcould be emphasized with presentations, oral explanations of results, oral/writtenanswers for in-class work, written explanation of results)8Students understand the implications of study design, can select appropriate statisticalmethods for data analysis, and can explain limitations of their analyses andinterpretations9Students become critical consumers of statistically-based results reported in popularmedia, recognizing whether reported results reasonably follow from the study andanalysis conducted10Students formulate and/or address questions about multivariate data, collect/considermultivariate data, analyze multivariate data, and interpret results11Students use current statistical software or statistical packages that are appropriate tothe discipline and context beyond basic Excel or a calculator12Students write a program (using a programming language) to analyze data or extractinformation from the data13Students study at least one type of advanced data-analytic methods such as (not limitedto): generalized linear models, Bayesian analysis, advanced probability theory andstochastic processes, non-linear models, machine learning, advanced study-design, bigdata analysis, econometrics, or statistical computing
Anna BargagliottiPolicy documents. Six curriculum guidelines were found from various professionaloraganizations that specifically dicuss students’ necessary data literacy. Each of thesedocuments was reviewed to cross-check whethere the learning outcomes were explicitlymentioned. Five difference disciplines are represented in the policy documents;Mathematics, Statistics, Psycholoy, Economics, and Sociology. The Table 2 presents theresults.Table 2. Professional Organization Alignment with Learning sociation (ASA)XXXXMathematicalAssociation ofAmerica (MAA)XXXGuidelines forAssessment lAssociaion (APA)XAmericanEconomicsAssociation (AEA)AmericanSociologyAssociation XXXXXXXXXXXXXXXXXXXTable 2 illustrates that eight of the learning outcomes were discussed in all of the policydocuments. The remaining five learning outcomes were supported by three of more of thedocuments. Only in one case, the extensive project, was the learning outcome not wellsupported. In this case, the documents did not discuss the need for a project, however, theyalso did not suggest that an extensive project was a bad idea. A project offers students away to connect ideas in a coherent manner and further work on their communication. It also347
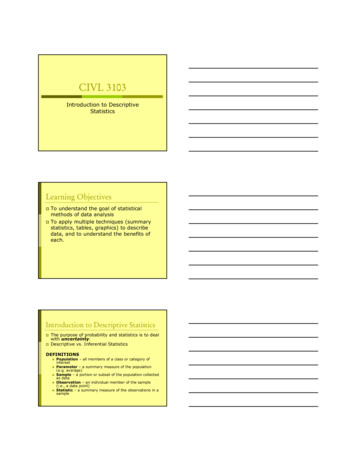
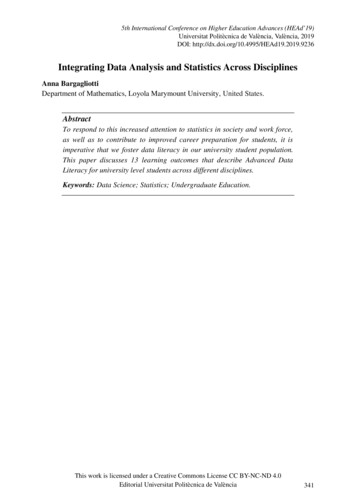
Integrating Data Analysis and Statistics Across Disciplinesprovides an opportunity for students to work extensively with real data as well astechnology to carry out the analyses.To further validate the learning outcomes, a community survey was administered online.The online survey was sent out by members of the working group to their connections, wassent out of list serves for several disciplines, and was posted on a few forums. A total of367 people opened the survey and 287 people completed the survey. The following piegraph show the distributions of backgrounds of people who completed the survey.Figure 1. Distribution of backgrounds.The next table shows the percentage of survey respondents that agreed, were neutral, ordisagreed with the statement that the learning outcome was an important skill that auniversity student must acquire.Of the 13 learning outcomes, four of them had 90% or above of the 287 people inagreement that they are important skills that a university student must acquire. Another fivelearning outcomes had a large majority of respondents state that they agreed or wereneutral. Only three learning outcomes had large disagreements with the statatements.As a result of the findings, the 13 learning outcomes were deemed to describe an AdvancedData Literate student. A student meeting less of these outcomes could be labelled at lowerlevels of data literacy.5. Conclusions and Future ResearchThe main goal of this paper is to outline 13 learning outcomes for statistics and data literacyat the university level. As society pushed towards being more data-driven, it is important tounderstand and characterize what education should be doing as a response. The commonlearning outcomes in statistics and data science across disciplines focused around threeimportant themes in data science: working with real data, communication, and technology.348
Anna BargagliottiThis project is ongoing and the findings are expanding. This paper offers the importantinitial step in finding common ground across disciplines. The creation of a working groupof “change agents” on a university campus that have interest in furthering data proficiencyin students has been an invaluable asset to the project. To be effective, these change agentsmust come from different disciplines. The formation of a working group of invested changeagents is no easy task. For the formation of such a group at LMU, we saught the help of theAssociate Dean for Undergraduate Studies who urged faculty that had investement instatistics to join the group. In addition, members of the research team personally reachedout to faculty in other departments to encourage them to join the working group. In total, aworking group of 10 faculty was set up.Future work for the project includes reviewing enrollement data and all of the coursesoffered at LMU. The goal is to contribute a comprehensive picture of what is happening atthe university level sorrouding statistics and data science.ReferencesAmerican Statistical Association, Undergraduate Guidelines Workgroup. (2014).Curriculum Guidelines for Undergraduate Programs in Statistical Science, retrievedfrom es.cfm.American Statistical Association. (April, 2014). Statistical Research and Training stat.org/policy/pdfs/StatisticsBRAIN April2014.pdf.AMSTAT News, (2015). Statistics: Fastest-Growing Undergraduate STEM Degree.AMSTATNEWS, March Issue.ASA/MAA Joint Committee on Undergraduate Statistics. (2014). Qualifications forTeaching an Introductory Statistics Course, American Statistical oStats-Qualifications.pdf.Baumer, B. (2015). A Data Science Course for Undergraduates: Thinking with Data,retrieved from http://arxiv.org/pdf/1503.05570.pdfBureau of Labor Statistics. (2013). Employment by Detailed Occupation, 2012 andProjected 2022 Table, retrieved from www.bls.gov/emp/ep table 102.htm.Cai, J. (2000). Understanding and representing the arithmetic averaging algorithm: Ananalysis and comparison of U.S. and Chinese students’ responses. International Journalof Mathematical Education in Science and Technology, 31, 839–855.Chance, B., delMas, R., & Garfield, J. (2004). Reasoning about Sampling Distributions, InD. Ben-Zvi & J. Garfield (Eds.), The Challenge of Developing Statistical Literacy,Reasoning and Thinking (pp. 295–323). Dordrecht: Kluwer.Chance, B. & Rossman, A. (2015). Investigating Statistical Concepts, Applications, andMethods. Thomson Brooks Cole, Third Edition.349
Integrating Data Analysis and Statistics Across DisciplinesChervany, N. L., Collier, R. D., Fienberg, S., & Johnson, P. (1977). A framework for thedevelopment of measurement instruments for evaluating the introductory statisticscourse. The American Statistician, 31(1), 17–23.Cobb, G. W., & Moore, D. S. (1997). Mathematics, statistics, and teaching. AmericanMathematical Monthly, 104, 801–823.Committee on the Undergraduate Program in Mathematics (CUPM). (2004).Undergraduate Programs and Courses in the Mathematical Sciences: CUPMCurriculum Guide 2004. Mathematical Association of America.Available atwww.maa.org/cupm/.delMas, R. C. (2004). A comparison of mathematical and statistical reasoning. In J.Garfield & D. Ben-Zvi (Eds.), The challenge of developing statistical literacy,reasoning, and thinking (pp. 79–95). Dordrecht, the Netherlands: Kluwer Academic.delMas, R., Garfield, J., Ooms, A., & Chance, B. (2007). Assessing students’ conceptualunderstanding after a first course in statistics. Statistics Education Research Journal,6(2), 28–58.Davenport, T., & Patil, D.J. (2012). Data Scientist: The Sexiest Job of the 21st Century.Harvard Business Review, 90(10), 70–76.Fischbein, E., & Schnarch, D. (1997). The evolution with age of probabilistic, intuitivelybased misconceptions. Journal for Research in Mathematics Education, 28, 96–105.Franklin, C., Kader, G., Mewborn, D., Moreno, J., Peck, R., Perry, M., & Scheaffer, R.(2007). Guidelines for assessment and instruction in statistics education (GAISE)report: A pre-K–12 curriculum framework. Alexandria, VA: American StatisticalAssociation. (Also available at www.amstat.org.)Garfield, J., & Ben-Zvi, D. (2008). Developing students’ statistical reasoning: Connectingresearch and teaching practice. Berlin, Germany: Springer.Green, D. R. (1983). A survey of probability concepts in 3000 pupils aged 11-16 years. InD. R. Grey, P. Holmes, V. Barnett, & G. M. Constable (Eds.), Proceedings of the FirstInternational Conference on Teaching Statistics. Sheffield, England: Teaching StatisticsTrust.Groth, R. E. (2002). Characterizing secondary students’ understanding of measures ofcentral tendency and variation. In D. S. Mewborn, P. Sztajn, D. Y. White, H. G. Wiegel,R. L. Bryant, & K. Nooney (Eds.), Proceedings of the twenty-fourth annual meeting ofthe North American Chapter of the International Group for the Psychology ofMathematics Education: Volume 1 (pp. 247–257). Columbus, OH: ERIC Clearinghousefor Science, Mathematics, and Environmental Education.Groth, R. (2003). High school students’ levels of thinking in regard to statistical studydesign. Mathematics Education Research Journal, 15(3), 252–269.Hardin, J., Hoerl, R., Norton, N., & Nolan, D. (2015). Data Science in Statistics Curricula:Preparing Students to “Think with Data,” working paper, accessed .pdfHesterberg, T. C. (1998). Simulation and Bootstrapping for Teaching Statistics. AmericanStatistical Association Proceedings of the Section on Statistical Education, 44–52.Available online at www.timhesterberg.net/articles.350
Anna BargagliottiHodgson, T. & Burke, M. (2000). On Simulation and the Teaching of Statistics, TeachingStatistics, 22 (3), 91-96.Holdren, J. P. and Lander, E. (2012). Engage to excel: Producing one million additionalcollege graduates with degrees in science, technology, engineering, and l 2-25-12.pdf.Horton, N. & Hardin, J. (2015) Teaching the Next Generation of Statistics Students to“think with Data”: Special Issue on Statistics and the Undergraduate Curriculum. TheAmerican Statistician, forthcoming issue November.Jones, G. A., Langrall, C. W., & Mooney, E. S. (2007). Research in probability:Responding to classroom realities. In F. K. Lester, Jr. (Ed.), Second handbook ofresearch on mathematics teaching and learning (pp. 909–955). Charlotte, NC:Information Age.Koehler, M. H. (2006). Using Graphing Calculator Simulations in Teaching Statistics. In G.F. Burrill & P. Elliott, (Eds.), Thinking and Reasoning with Data and Chance, Sixtyeighth Yearbook (pp. 257-272). Reston VA: National Council of Teachers ofMathematics.Konold, C. (1995). Issues in assessing conceptual understanding in probability andstatistics. Journal of Statistics Education, 3(1).Konold, C., & Pollatsek, A. (2002). Data analysis as the search for signals in noisyprocesses. Journal for Research in Mathematics Education, 33(4), 259–289.Konold, C., Pollatsek, A., Well, A. & Gagnon, A. (1997). Students analyzing data:Research of critical barriers. In J. B. Garfield & G. Burrill (Eds.), Research on the roleof technology in teaching and learning statistics: Proceedings of the 1996 IASERoundtable Conference (pp. 151–167). Voorburg, the Netherlands: InternationalStatistical Institute.Lock, R., Lock, P., Lock Morgan, K., Lock, E., & Lock, D. (2012). Unlocking the power ofdata. Wiley.LMU Mathematics Department Careers Committee. (2014). Survey of Online Job Postingin California, Internal Report.Meletiou-Mavrotheris, M. (2003). Technological Tools in the Introductory StatisticsClassroom: Effects on Student Understanding of Inferential Statistics, InternationalJournal of Computers for Mathematical Learning, 8, 265-297.Mills, J. D. (2002). Using Computer Simulation Methods to Teach Statistics: A Review ofthe Literature, Journal of Statistics Education [online], 10(1). Available atwww.amstat.org/publications/jse/jse archive.htm#2002.Nolan, D. & Temple Lang, D. (2010). Computing in the statistics curriculum. TheAmerican Statistician, 53: 370-375.Nolan, D. & Temple Lang, D. (2015). Data Science in R: A case studies approval tocomputational reason and problem solving. The American Statistician, forthcomingNovember issue.351
Integrating Data Analysis and Statistics Across DisciplinesPfaff, T. & Weinberg, A. (2009). Do Hands-On Activities Increase Student Understanding?A Case Study,” Journal of Statistics Education [online], 17(3). Available atwww.amstat.org/publications/jse/jse archive.htm#2009.Piaget, J., & Inhelder, B. (1975). The origin of the idea of chance in children. London,England: Routledge & Kegan Paul.Ridgeway, J. (2015). Implications of the Data Revolution for Statistics Education,International Statistical Review, doi:10.1111/insr.12110Shaughnessy, J. M. (2007). Research on statistics learning and reasoning. In F. K. Lester(Ed.), Second handbook of research on mathematics teaching and learning (pp. 957–1009). Charlotte, NC: Information Age.Shaughnessy, J. M., Ciancetta, M., & Canada, D. (2004). Types of student reasoning onsampling tasks. In M. Johnsen Hoines & A. Berit Fuglestead (Eds.), Proceedings of the28th meeting of the International Group for the Psychology of Mathematics Education(Vol. 4, pp. 177–184). Bergen, Norway: Bergen University College Press.Stroup, D. F. (1984). The statistician and the pedagogical monster: Characteristics ofeffective instructors of large statistics classes. Proceedings of the Section on StatisticalEducation (pp. 1–7). Washington, DC: American Statistical Association.Tintle, N., Chance, B., Cobb, G., Rossman, A., Roy, S., Swanson, T., & VanderStoep, J.(2014). Introduction to Statistical Investigations, Preliminary Edition. Wiley.Watkins, A., Bargagliotti, A. E., & Franklin, C. (2014). Simulation of the samplingdistribution of the mean can mislead. Journal of Statistics Education.Wilder, E. I. (2010). A Qualitative Assessment of Efforts to Integrate Data Analysisthroughout the Sociology Curriculum Feedback from Students, Faculty, and Alumni.Teaching Sociology, 38(3), 226-246.Zieffler, A., Park, J., Garfield, J., delMas, & R., Bjornsdottir, A. (2012). The statisticsteaching inventory: A survey on statistics classroom practices and beliefs. Journal ofStatistics Education, 2(1).Zorn, P., Bailer, J., Braddy, L., Carpenter, J., Jaco, W., and Turner, P. (2014). TheINGenIOuS project: Mathematics, statistics, and preparing the 21st /ingenious/INGenIOuS-report.pdf.352
Teaching and Learning of Statistics and Data Science at Universities . Using Loyola Marymount University (LMU), a mid -sized comprehensive university in Los . and 15 credential programs as a case study, the project defined a set of learning outcomes that integrated the statistical goals put forth by several different disciplines. While LMU .