Transcription
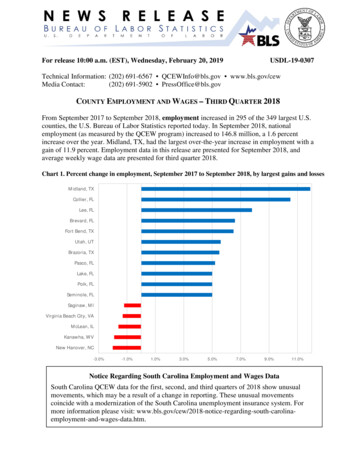
For release 10:00 a.m. (EST), Wednesday, February 20, 2019USDL-19-0307Technical Information: (202) 691-6567 QCEWInfo@bls.gov www.bls.gov/cewMedia Contact:(202) 691-5902 PressOffice@bls.govCOUNTY EMPLOYMENT AND WAGES – THIRD QUARTER 2018From September 2017 to September 2018, employment increased in 295 of the 349 largest U.S.counties, the U.S. Bureau of Labor Statistics reported today. In September 2018, nationalemployment (as measured by the QCEW program) increased to 146.8 million, a 1.6 percentincrease over the year. Midland, TX, had the largest over-the-year increase in employment with again of 11.9 percent. Employment data in this release are presented for September 2018, andaverage weekly wage data are presented for third quarter 2018.Chart 1. Percent change in employment, September 2017 to September 2018, by largest gains and lossesMidland, TXCollier, FLLee, FLBrevard, FLFort Bend, TXUtah, UTBrazoria, TXPasco, FLLake, FLPolk, FLSeminole, FLSaginaw, MIVirginia Beach City, VAMcLean, ILKanawha, WVNew Hanover, NC-3.0%-1.0%1.0%3.0%5.0%7.0%9.0%11.0%Notice Regarding South Carolina Employment and Wages DataSouth Carolina QCEW data for the first, second, and third quarters of 2018 show unusualmovements, which may be a result of a change in reporting. These unusual movementscoincide with a modernization of the South Carolina unemployment insurance system. Formore information please visit: naemployment-and-wages-data.htm.
Among the 349 largest counties, 336 had over-the-year increases in average weekly wages. Inthe third quarter of 2018, average weekly wages for the nation increased to 1,055, a 3.3 percentincrease over the year. Chatham, GA, had the largest third quarter over-the-year wage gain at 8.5percent. (See table 1.)Large County Employment in September 2018Midland, TX, had the largest over-the-year percentage increase in employment (11.9 percent).Within Midland, the largest employment increase occurred in natural resources and mining,which gained 5,824 jobs over the year (23.7 percent).New Hanover, NC, experienced the largest over-the-year percentage decrease in employment,with a loss of 2.0 percent. Within New Hanover, leisure and hospitality had the largestemployment decrease with a loss of 1,466 jobs (-8.0 percent).Large County Average Weekly Wage in Third Quarter 2018Chatham, GA, had the largest over-the-year percentage increase in average weekly wages (8.5percent). Within Chatham, an average weekly wage gain of 486 (30.7 percent) in manufacturingmade the largest contribution to the county’s increase in average weekly wages.Elkhart, IN, had the largest over-the-year percentage decrease in average weekly wages with aloss of 4.2 percent. Within Elkhart, professional and business services had the largest impact,with an average weekly wage decrease of 482 (-32.2 percent) over the year.Chart 2. Percent change in average weekly wage, third quarter 2017 to third quarter 2018, bylargest gains and lossesChatham, GAKing, WASanta Clara, CAStanislaus, CASan Francisco, CALinn, IAMidland, TXWarren, OHSan Mateo, CANew Hanover, NCDavidson, TNPeoria, ILForsyth, NCProvidence, RIUnion, NJElkhart, IN-5.0%-3.0%-1.0%1.0%-2-3.0%5.0%7.0%9.0%
Ten Largest CountiesAll of the 10 largest counties had over-the-year percentage increases in employment and averageweekly wages. In September 2018, Miami-Dade, FL, had the largest over-the-year employmentpercentage gain among the 10 largest counties (3.9 percent). Within Miami-Dade, trade,transportation, and utilities had the largest employment increase with a gain of 9,878 jobs (3.6percent). (See table 2.)In third quarter 2018, King, WA, experienced the largest over-the-year percentage gain inaverage weekly wages among the 10 largest counties (7.9 percent). Within King, information hadthe largest impact, with an average weekly wage increase of 475 (9.4 percent) over the year.For More InformationThe tables and charts included in this release contain data for the nation and for the 349 U.S.counties with annual average employment levels of 75,000 or more in 2017. September 2018employment and third quarter 2018 average weekly wages for all states are provided in table 3 ofthis release.The most current news release on quarterly measures of gross job flows is available from QCEWBusiness Employment Dynamics at www.bls.gov/news.release/pdf/cewbd.pdf.Several BLS regional offices issue QCEW news releases targeted to local data users. Links tothese releases are available at www.bls.gov/cew/cewregional.htm.QCEW’s news release schedule is available at www.bls.gov/cew/releasecalendar.htm.The County Employment and Wages full data update for third quarter 2018 is scheduledto be released on Wednesday, March 6, 2019, at 10:00 a.m. (EST).The County Employment and Wages news release for fourth quarter 2018 is scheduled tobe released on Wednesday, May 22, 2019, at 10:00 a.m. (EDT).-3-
Technical NoteThese data are the product of a federal-state cooperative program, the Quarterly Census of Employment and Wages (QCEW)program, also known as the ES-202 program. The data are derivedfrom summaries of employment and total pay of workers coveredby state and federal unemployment insurance (UI) legislation andprovided by State Workforce Agencies (SWAs). The summariesare a result of the administration of state unemployment insuranceprograms that require most employers to pay quarterly taxes basedon the employment and wages of workers covered by UI. QCEWdata in this release are based on the 2017 North American IndustryClassification System (NAICS). Data for 2018 are preliminary andsubject to revision.For purposes of this release, large counties are defined as havingemployment levels of 75,000 or greater. In addition, data for SanJuan, Puerto Rico, are provided, but not used in calculating U.S.averages, rankings, or in the analysis in the text. Each year, theselarge counties are selected on the basis of the preliminary annualaverage of employment for the previous year. The 349 countiespresented in this release were derived using 2017 preliminary annual averages of employment. For 2018 data, three counties havebeen added to the publication tables: Cabarrus, N.C.; Pitt, N.C.;and Kent, R.I. These counties will be included in all 2018 quarterlyreleases. The counties in table 2 are selected and sorted each yearbased on the annual average employment from the preceding year.Summary of Major Differences between QCEW, BED, and CES Employment MeasuresQCEWBEDCESSource Count of UI administrative recordssubmitted by 10.0 million establishments in first quarter of 2018 Count of longitudinally-linked UI administrative records submitted by 8.0million private-sector employers Sample survey: 689,000 establishmentsCoverage UI and UCFE coverage, includingall employers subject to state andfederal UI laws UI coverage, excluding government,private households, and establishments with zero employmentNonfarm wage and salary jobs: UI coverage, excluding agriculture, privatehouseholds, and self-employed workers Other employment, including railroads,religious organizations, and other nonUI-covered jobsPublication fre- Quarterlyquency— Within 5 months after the end ofeach quarter Quarterly— 7 months after the end of eachquarter Monthly— Usually the 3rd Friday after the endof the week including the 12th of themonth Links each new UI quarter to longitu- Uses UI file as a sampling frame and todinal database and directly summaannually realign sample-based estimatesrizes gross job gains and lossesto population counts (benchmarking)Use of UI file Directly summarizes and publisheseach new quarter of UI dataPrincipalproducts Provides a quarterly and annual uni- Provides quarterly employer dynam- Provides current monthly estimates ofverse count of establishments, emics data on establishment openings,employment, hours, and earnings at theployment, and wages at the county,closings, expansions, and contractionsMSA, state, and national level by indusmetropolitan statistical area (MSA),at the national level by NAICS supertrystate, and national levels by detailedsectors and by size of firm, and at theindustrystate private-sector total level Future expansions will include datawith greater industry detail and dataat the county and MSA levelPrincipal uses Major uses include:— Detailed locality data— Periodic universe counts forbenchmarking sample survey estimates— Sample frame for BLS establishment surveysProgram Websites www.bls.gov/cew Major uses include:— Business cycle analysis— Analysis of employer dynamicsunderlying economic expansionsand contractions— Analysis of employment expansion and contraction by size offirm www.bls.gov/bdm Major uses include:— Principal federal economic indicator— Official time series for employmentchange measures— Input into other major economic indicators www.bls.gov/ces
The preliminary QCEW data presented in this release may differfrom data released by the individual states. These potential differencesresult from the states' continuing receipt of UI data over time and ongoing review and editing. The individual states determine their datarelease timetables.Differences between QCEW, BED, and CES employmentmeasuresThe Bureau publishes three different establishment-based employment measures for any given quarter: QCEW, Business EmploymentDynamics (BED), and Current Employment Statistics (CES). Each ofthese measures makes use of the quarterly UI employment reports inproducing data; however, each measure has a somewhat different universe coverage, estimation procedure, and publication product.Differences in coverage and estimation methods can result in somewhat different measures of employment change over time. It is important to understand program differences and the intended uses of theprogram products. (See table.) Additional information on each program can be obtained from the program Web sites shown in the table.CoverageEmployment and wage data for workers covered by state UI lawsare compiled from quarterly contribution reports submitted to theSWAs by employers. For federal civilian workers covered by the Unemployment Compensation for Federal Employees (UCFE) program,employment and wage data are compiled from quarterly reports submitted by four major federal payroll processing centers on behalf ofall federal agencies, with the exception of a few agencies which stillreport directly to the individual SWA. In addition to the quarterly contribution reports, employers who operate multiple establishmentswithin a state complete a questionnaire, called the "Multiple WorksiteReport," which provides detailed information on the location and industry of each of their establishments. QCEW employment and wagedata are derived from microdata summaries of 9.8 million employerreports of employment and wages submitted by states to the BLS in2017. These reports are based on place of employment rather thanplace of residence.UI and UCFE coverage is broad and has been basically comparablefrom state to state since 1978, when the 1976 amendments to the Federal Unemployment Tax Act became effective, expanding coverage toinclude most state and local government employees. In 2017, UI andUCFE programs covered workers in 143.9 million jobs. The estimated138.6 million workers in these jobs (after adjustment for multiple jobholders) represented 96.4 percent of civilian wage and salary employment. Covered workers received 7.968 trillion in pay, representing94.3 percent of the wage and salary component of personal incomeand 40.9 percent of the gross domestic product.Major exclusions from UI coverage include self-employed workers, most agricultural workers on small farms, all members of theArmed Forces, elected officials in most states, most employees of railroads, some domestic workers, most student workers at schools, andemployees of certain small nonprofit organizations.State and federal UI laws change periodically. These changes mayhave an impact on the employment and wages reported by employerscovered under the UI program. Coverage changes may affect the overthe-year comparisons presented in this news release.Concepts and methodologyMonthly employment is based on the number of workers whoworked during or received pay for the pay period including the 12thof the month. With few exceptions, all employees of covered firms arereported, including production and sales workers, corporation officials, executives, supervisory personnel, and clerical workers. Workers on paid vacations and part-time workers also are included.Average weekly wage values are calculated by dividing quarterlytotal wages by the average of the three monthly employment levels(all employees, as described above) and dividing the result by 13, forthe 13 weeks in the quarter. These calculations are made using unrounded employment and wage values. The average wage values thatcan be calculated using rounded data from the BLS database may differ from the averages reported. Included in the quarterly wage data arenon-wage cash payments such as bonuses, the cash value of meals andlodging when supplied, tips and other gratuities, and, in some states,employer contributions to certain deferred compensation plans suchas 401(k) plans and stock options. Over-the-year comparisons of average weekly wages may reflect fluctuations in average monthly employment and/or total quarterly wages between the current quarter andprior year levels.Average weekly wages are affected by the ratio of full-time to parttime workers as well as the number of individuals in high-paying andlow-paying occupations and the incidence of pay periods within aquarter. For instance, the average weekly wage of the workforce couldincrease significantly when there is a large decline in the number ofemployees that had been receiving below-average wages. Wages mayinclude payments to workers not present in the employment countsbecause they did not work during the pay period including the 12th ofthe month. When comparing average weekly wage levels between industries, states, or quarters, these factors should be taken into consideration.Wages measured by QCEW may be subject to periodic and sometimes large fluctuations. This variability may be due to calendar effects resulting from some quarters having more pay dates than others.The effect is most visible in counties with a dominant employer. Inparticular, this effect has been observed in counties where governmentemployers represent a large fraction of overall employment. Similarcalendar effects can result from private sector pay practices. However,these effects are typically less pronounced for two reasons: employment is less concentrated in a single private employer, and private employers use a variety of pay period types (weekly, biweekly, semimonthly, monthly).For example, the effect on over-the-year pay comparisons can bepronounced in federal government due to the uniform nature of federalpayroll processing. Most federal employees are paid on a biweeklypay schedule. As a result, in some quarters federal wages include sixpay dates, while in other quarters there are seven pay dates. Over-theyear comparisons of average weekly wages may also reflect this calendar effect. Growth in average weekly wages may be attributed, inpart, to a comparison of quarterly wages for the current year, whichinclude seven pay dates, with year-ago wages that reflect only six paydates. An opposite effect will occur when wages in the current quarterreflecting six pay dates are compared with year-ago wages for a quarter including seven pay dates.In order to ensure the highest possible quality of data, states verifywith employers and update, if necessary, the industry, location, andownership classification of all establishments on a 3-year cycle.Changes in establishment classification codes resulting from this process are introduced with the data reported for the first quarter of theyear. Changes resulting from improved employer reporting also areintroduced in the first quarter.
QCEW data are not designed as a time series. QCEW data aresimply the sums of individual establishment records and reflect thenumber of establishments that exist in a county or industry at a pointin time. Establishments can move in or out of a county or industry fora number of reasons that reflect economic events or administrativechanges. For example, economic change would come from a firm relocating into the county; administrative change would come from acompany correcting its county designation.The over-the-year changes of employment and wages presented inthis release have been adjusted to account for most of the administrative corrections made to the underlying establishment reports. This isdone by modifying the prior-year levels used to calculate the over-theyear changes. Percent changes are calculated using an adjusted version of the final 2017 quarterly data as the base data. The adjustedprior-year levels used to calculate the over-the-year percent change inemployment and wages are not published. These adjusted prior-yearlevels do not match the unadjusted data maintained on the BLS Website. Over-the-year change calculations based on data from the Website, or from data published in prior BLS news releases, may differsubstantially from the over-the-year changes presented in this newsrelease.The adjusted data used to calculate the over-the-year changemeasures presented in this release eliminate the effect of most of theadministrative changes (those occurring when employers update theindustry, location, and ownership information of their establishments). The most common adjustments for administrative change arethe result of updated information about the county location of individual establishments. Included in these adjustments are administrativechanges involving the classification of establishments that were previously reported in the unknown or statewide county or unknown industry categories. Adjusted data account for improvements in reporting employment and wages for individual and multi-unit establishments. To accomplish this, adjustments were implemented to accountfor: administrative changes caused by multi-unit employers who startreporting for each individual establishment rather than as a single entity (first quarter of 2008); selected large administrative changes inemployment and wages (second quarter of 2011); and state verifiedimprovements in reporting of employment and wages (third quarter of2014). These adjustments allow QCEW to include county employment and wage growth rates in this news release that would otherwisenot meet publication standards.The adjusted data used to calculate the over-the-year changemeasures presented in any County Employment and Wages news release are valid for comparisons between the starting and ending points(a 12-month period) used in that particular release. Comparisons maynot be valid for any time period other than the one featured in a releaseeven if the changes were calculated using adjusted data.County definitions are assigned according to Federal InformationProcessing Standards Publications (FIPS PUBS) as issued by the National Institute of Standards and Technology, after approval by theSecretary of Commerce pursuant to Section 5131 of the InformationTechnology Management Reform Act of 1996 and the Computer Security Act of 1987, Public Law 104-106. Areas shown as counties include those designated as independent cities in some jurisdictions and,in Alaska, those designated as census areas where counties have notbeen created. County data also are presented for the New Englandstates for comparative purposes even though townships are the morecommon designation used in New England (and New Jersey). The regions referred to in this release are defined as census regions.Additional statistics and other informationEmployment and Wages Annual Averages Online features comprehensive information by detailed industry on establishments, employment, and wages for the nation and all states. The 2017 edition of thispublication, which was published in September 2018, contains selected data produced by Business Employment Dynamics (BED) onjob gains and losses, as well as selected data from the first quarter2018 version of this news release. Tables and additional content fromthe 2017 edition of Employment and Wages Annual Averages Onlineare now available at www.bls.gov/cew/cewbultn17.htm. The 2018edition of Employment and Wages Annual Averages Online will beavailable in September 2019.News releases on quarterly measures of gross job flows also areavailable from BED at www.bls.gov/bdm, (202) 691-6467, ordata.bls.gov/cgi-bin/forms/bdm.Information in this release will be made available to sensory impaired individuals upon request. Voice phone: (202) 691-5200; TDDmessage referral phone number: (800) 877-8339.
Table 1. Covered establishments, employment, and wages in the 350 largest counties,third quarter 2018Average weekly wage ²EmploymentCounty¹Establishments,third entchange,September2017-18³Ranking bypercentchangeThirdquarter2018Percentchange,third quarter2017-18³Ranking bypercentchangeUnited States⁴.10,118.0146,824.11.6- 1,0553.3-Jefferson, AL.Madison, AL.Mobile, AL.Montgomery, AL.Shelby, AL.Tuscaloosa, AL.Anchorage, AK.Maricopa, AZ.Pima, AZ.Benton, ki, AR.Washington, AR.Alameda, CA.Butte, CA.Contra Costa, CA.Fresno, CA.Kern, CA.Los Angeles, CA.Marin, CA.Merced, erey, CA.Napa, CA.Orange, CA.Placer, CA.Riverside, CA.Sacramento, CA.San Bernardino, CA.San Diego, CA.San Francisco, CA.San Joaquin, 3San Luis Obispo, CA.San Mateo, CA.Santa Barbara, CA.Santa Clara, CA.Santa Cruz, CA.Solano, CA.Sonoma, CA.Stanislaus, CA.Tulare, CA.Ventura, .17.82.33.65.47.82.22.91591543241101193259169Yolo, CA.Adams, CO.Arapahoe, CO.Boulder, CO.Denver, CO.Douglas, CO.El Paso, CO.Jefferson, CO.Larimer, CO.Weld, .13.73.20.83.90.35.83407314123951413277333314See footnotes at end of table.
Table 1. Covered establishments, employment, and wages in the 350 largest counties,third quarter 2018 - ContinuedAverage weekly wage ²EmploymentCounty¹Establishments,third entchange,September2017-18³Ranking bypercentchangeThirdquarter2018Percentchange,third quarter2017-18³Ranking bypercentchangeFairfield, CT.Hartford, CT.New Haven, CT.New London, CT.New Castle, DE.Sussex, DE.Washington, DC.Alachua, FL.Bay, FL.Brevard, 10.61.70.72.32.66.632524920630721911520672624 roward, FL.Collier, FL.Duval, FL.Escambia, FL.Hillsborough, FL.Lake, FL.Lee, FL.Leon, FL.Manatee, FL.Marion, 3169215259128128280312304241Miami-Dade, FL.Okaloosa, FL.Orange, FL.Osceola, FL.Palm Beach, FL.Pasco, FL.Pinellas, FL.Polk, FL.Sarasota, FL.Seminole, 9283141732310127221516319613Volusia, FL.Bibb, GA.Chatham, GA.Clayton, GA.Cobb, GA.DeKalb, GA.Fulton, GA.Gwinnett, GA.Hall, GA.Muscogee, 2.73.2-2.310149115196115169196141344Richmond, GA.Honolulu, HI.Maui Kalawao, HI.Ada, ID.Champaign, IL.Cook, IL.DuPage, IL.Kane, IL.Lake, IL.McHenry, 9See footnotes at end of table.
Table 1. Covered establishments, employment, and wages in the 350 largest counties,third quarter 2018 - ContinuedAverage weekly wage ²EmploymentCounty¹Establishments,third entchange,September2017-18³Ranking bypercentchangeThirdquarter2018Percentchange,third quarter2017-18³Ranking bypercentchangeMcLean, IL.Madison, IL.Peoria, IL.St. Clair, IL.Sangamon, IL.Will, IL.Winnebago, IL.Allen, IN.Elkhart, IN.Hamilton, 1.60.31.21.62.134732016133516812326216112385 1.81.83.8-4.22.1365934533624128328386349267Lake, IN.Marion, IN.St. Joseph, IN.Tippecanoe, IN.Vanderburgh, IN.Johnson, IA.Linn, IA.Polk, IA.Scott, IA.
The County Employment and Wages full data update for third quarter 2018 is scheduled to be released on Wednesday, March 6, 2019, at 10:00 a.m. (EST). The County Employment and Wages news release for fourth quarter 2018 is scheduled to be released on Wednesday, May 22, 2019, at 10:00 a.m. (EDT).