Transcription
North Dakota University SystemFollow‐Up Study of Online EnrollmentPUBLISHED BY:State CapitolBismarck, ND 58505December 2018600 E Boulevard Department 215Bismarck, North Dakota 58505‐0230Website: www.ndus.edu
Report prepared byJennifer Weber, Ph.D., NDUS Institutional Research
Table of ContentsExecutive Summary . 4Figure 1: 2008 – 2018 Trending Online Course Enrollment . 5Table 1: 2008-2018 Trending Online Course Enrollments . 5Figure 2: NDUS Student Online Enrollment Status . 6Table 2: Online Course Enrollment by Institution (by percentage) . 6Table 3: Top 20 Majors with Online Enrollment . 7Figure 3: Online Students by Age . 8Table 4A: Online Enrollment of High School Students (Early Entry) . 9Table 4B: Online Enrollment of Undergraduate Degree Seeking Students . 9Table 4C: Online Enrollment of Graduate Degree Students. 9Table 5: Online Only Students by State . 10
Executive SummaryThis report is a follow up study to Study of Distance Education (DE) Enrollment released in December2017 (revised January 2018). The Study of Distance Education (DE) Enrollment was conducted ad hoc torespond to governor and legislative inquiries regarding distance education enrollment in the NorthDakota University System.The focus of this follow up report is NDUS online enrollment, which includes student enrollment ineither online synchronous or online asynchronous courses. Online enrollment is considered part of thelarger category of distance education, which also includes course enrollment via interactive video, offcampus face‐to‐face courses, and independent study coursework. According to the 2017 Study ofDistance Education (DE) Enrollment, online enrollments account for 15% of all distance education in theNorth Dakota University System.Data for all tables and figures come from the 2018 NDUS Fall Enrollment census count.Key findings include: Over the past decade, enrollment in online courses has increased 70% (Figure 1).16% of students are enrolled online only, and 21% are enrolled in some but not all onlinecourses, accounting for 37% of NDUS students taking at least one course online (Figure 2).The greatest rate in online only course participation occurs in the 35‐39 and 40‐49 year old agegroups, although one‐third of students in the 20‐21 year old age group take some onlinecoursework (Figure 3).Non‐degree seeking students are the largest subgroup of students participating in courseworkonline only (Table 3).North Dakota students account for nearly half of all online only enrollments (Table 5).4
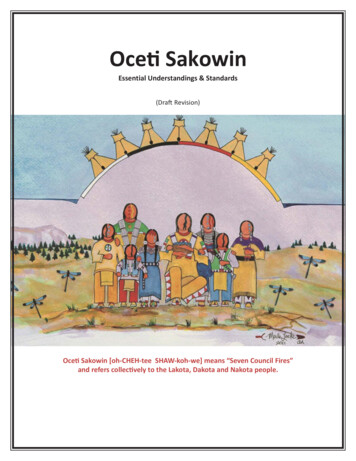
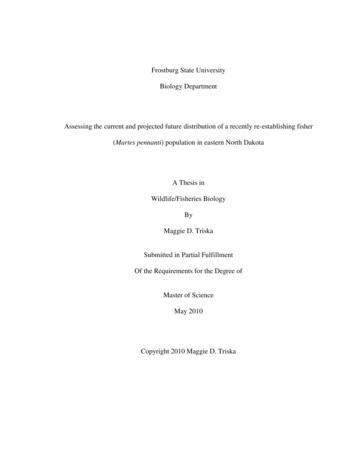
Figure 1: 2008 – 2018 Trending Online Course EnrollmentStudent enrollment count as of fall term census.Table 1: 2008‐2018 Trending Online Course EnrollmentsOnline OnlySome OnlineTotal OnlineFall 20086,1383,89210,030Fall 20106,0546,72812,782Fall 20127,1387,08714,2255Fall 20147,4657,68915,154Fall 20167,4618,22415,685Fall 20187,4739,72017,193
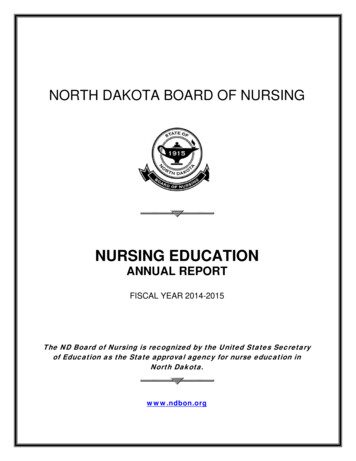
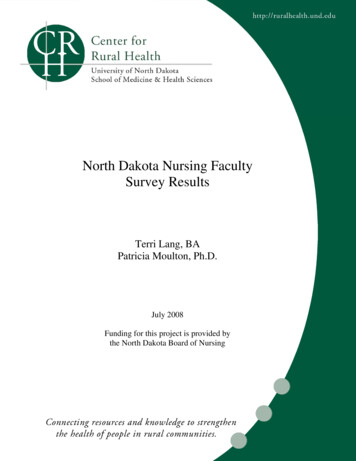
Figure 2: NDUS Student Online Enrollment StatusThe pie chart below accounts for the online enrollment status of all NDUS students (N 46,018).NDUS Student Online Enrollment Status (Fall 2018)16%21%63%Enrolled in Online Courses Only (Online)Enrolled in Both Traditional and Online Courses (Hybrid)Not Enrolled in any Online Courses (Traditional)Table 2: Online Course Enrollment by Institution (by percentage)Bismarck State CollegeDakota College BottineauLake Region State CollegeND State College of ScienceWilliston State CollegeDickinson State UniversityMayville State UniversityMinot State UniversityValley City State UniversityNorth Dakota State UniversityUniversity of North DakotaNDUS OverallEnrolled in BothTraditional andOnline %Enrolled inOnline CoursesOnly (Online)30%25%29%7%20%16%40%15%29%4%21%16%6Not Enrolled inany 42%66%65%63%
Table 3: Top 20 Majors with Online EnrollmentThe table below shows enrollment in online courses by major. Rank determined by count. Counts shownin parenthesis by major.Note: Non‐degree undergraduate includes students with undeclared majors as well as high schoolstudents enrolled in college coursework.Rank dergraduate MajorNon‐Degree (2,143)Nursing (804)Liberal Arts/Transfer (789)Mechanical Engineering (468)Business Administration (438)Psychology (434)Liberal Arts (362)Elementary Education (346)Practical Nursing (322)Management (319)Human Development & Family Sci (302)Civil Engineering (298)Accounting (269)Marketing (266)Energy Management (201)Finance (199)Associate Degree Nurse (197)Criminal Justice (184)Commercial Aviation (181)Electrical Engineering (177)7Graduate MajorSpecial Education (354)Non‐Degree (185)Nursing (169)Education (127)Social Work (127)Business Administration (117)Pharmacy (96)Forensic Psychology (91)Nursing Practice (86)Space Studies (83)Physician Assistant Studies (63)M.A. in Teaching (45)Counseling (43)Information Systems (41)Early Childhood Education (36)Reading Education (34)Medical Laboratory Science (32)Software Engineering (31)Applied Economics (31)English Language Learner (27)
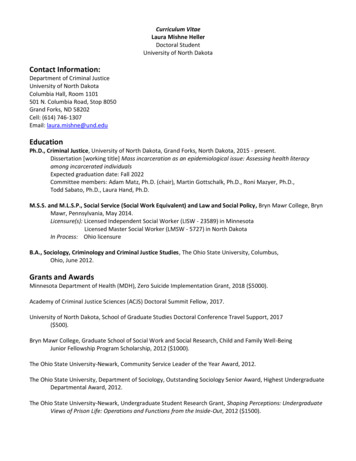
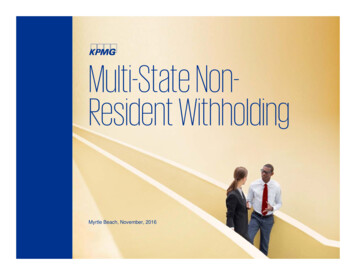
Figure 3: Online Students by AgeNDUS Online Course Enrollment by Age90%80%70%60%50%40%30%20%10%0%Under 1818‐1920‐2122‐24Online Only25‐2930‐34Some Online835‐39Traditional40‐4950‐64Over 65
Table 4A: Online Enrollment of High School Students (Early Entry)Early Entry accounts for high school students enrolled in any type of college coursework. In NDUS, themajority of these enrollments are for dual credit.EnrollmentCountEnrollment StatusOnline OnlySome OnlineTraditional OnlyTotal High School Students EnrolledPercent41112%2,83282%2196%3,462Table 4B: Online Enrollment of Undergraduate Degree Seeking StudentsHigh school/dual credit and non‐degree undergraduates excluded from this data.TierTwo Year CollegesRegional UniversitiesResearch UniversitiesAll Online25%19%9%Some Online22%24%25%Traditional Only53%57%66%Table 4C: Online Enrollment of Graduate Degree StudentsIncludes both degree and non‐degree seeking students.TierRegional UniversitiesResearch UniversityAll Online65%24%Some Online14%9%9Traditional Only22%68%
Table 5: Online Only Students by StateIncludes only students enrolled exclusively online. “Other” category includes American territories, ArmedForces addresses, Canada, and other foreign countries. North Dakota count includes 411 high schoolstudents enrolled in college 010
Lake Region State College 29% 13% 58% ND State College of Science 7% 15% 77% Williston State College 20% 34% 46% Dickinson State University 16% 21% 63% Mayville State University 40% 18% 43% Minot State University 15% 21% 65% Valley City State University 29% 29% 42% North Dakota State University 4% 30% 66%