Transcription
August 2018Survey of GranteeDemographicsResultsA Data Book for the William andFlora Hewlett Foundation
Executive SummaryThe William and Flora Hewlett Foundation makes grants to a wide range of institutions in the United States and aroundthe globe through the following programs and initiatives: Education, Environment, Global Development andPopulation, Performing Arts, Effective Philanthropy, the Madison and Cyber Initiatives, and Special Projects.Regardless of program area, the foundation’s approach is rooted in honesty, integrity, high standards and ethics, anda commitment to fair and respectful treatment for all. These values form the basis for Hewlett’s guiding principles,including its pledge “to promote the values and practice of diversity, equity, and inclusion in our workforce, ourculture, and our grantmaking.”In demonstration of its commitment to diversity, equity, and inclusion, the foundation has implemented severalpractices to help “develop enough awareness of difference—enough mutual understanding and culturalsensitivity-that people can raise what matters to them, and to help the foundation learn from the en richeddialogue and relationships that result.” i These practices include, but are not limited to, incorporating questionsabout inclusion of diverse voices and perspectives in the outcome-focused philanthropy (OFP) guidance forstrategy development and implementation; supporting sector efforts to increase diversity; and understandingthe composition and experiences of the foundation’s grantees.To support the implementation of these and other practices, the foundation partnered with Harder CompanyCommunity Research to design and administer a survey of grantee demographics. The survey, administered in Winter2018, gathered demographic information on the race/ethnicity and gender of board members and staff of thefoundation’s U.S.-based grantee organizations that were active as of November 2017.This databook includes foundation- and comparative program-level survey findings. Key questions centered onrace/ethnicity and gender demographic information for grantees’ boards, head(s) of organization, senior staff, andother staff. Key findings about grantee organizations’ race/ethnicity and gender demographics include the following: Grantees that completed this survey have an average of 31 percent board members of color. Grantees that completed this survey have an average of 36 percent staff members of color (including head(s)of organization, senior staff and other staff). Grantees that completed this survey have an average of 43 percent woman/female board members. Grantees that completed this survey have an average of 57 percent woman/female staff members (includinghead(s) of organization, senior staff, and other staff).The primary purpose of this data book is to present findings from the survey in ways that support foundation staff’slearning and reflection. We have intentionally included limited, if any, commentary on charts and tables to allowHewlett staff to interpret the data in ways that are most informative and important to their grantmaking. We hope thatthis data book inspires reflection and learning, and helps foundation staff better understand the composition of theircurrent U.S.-based grantees that were active as of November 2017.iThe William and Flora Hewlett Foundation (2018). Diversity, equity, and inclusion. Retrieved /Survey of Grantee Demographics Data Book2
ContentsExecutive Summary . 2Introduction. 4Overview of Sample . 8Foundation-Wide Grantee Demographics . 11Grantee Demographics by Program . 36Grantee Feedback. 44Limitations and Considerations . 49Appendix: Survey of Grantee Demographics . 50Survey of Grantee Demographics Data Book3
IntroductionThe William and Flora Hewlett Foundation makes grants to a wide range of institutions in the United States and aroundthe globe through the following programs and initiatives: Education, Environment, Global Development andPopulation, Performing Arts, Effective Philanthropy, the Madison and Cyber Initiatives, and Special Projects.Regardless of program area, the foundation’s approach is rooted in honesty, integrity, high standards and ethics, anda commitment to fair and respectful treatment for all. These values form the basis for Hewlett’s guiding principles,including its pledge “to promote the values and practice of diversity, equity, and inclusion in our workforce, ourculture, and our grantmaking.”In demonstration of its commitment to diversity, equity, and inclusion, the foundation has implemented severalpractices to help “develop enough awareness of difference—enough mutual understanding and culturalsensitivity-that people can raise what matters to them, and to help the foundation learn from the enricheddialogue and relationships that result.” ii These practices include, but are not limited to, incorporating questionsabout inclusion of diverse voices and perspectives in the outcome-focused philanthropy (OFP) guidance forstrategy development and implementation; supporting sector efforts to increase diversity; and understandingthe composition and experiences of the foundation’s grantees.To support the implementation of these and other practices, the foundation partnered with Harder CompanyCommunity Research to design and administer a survey of grantee demographics. The survey, administered in Winter2018, gathered demographic information on the race/ethnicity and gender of board members and staff of thefoundation’s U.S.-based grantee organizations that were active as of November 2017.This Data BookThe primary purpose of this data book is to present findings from the survey in ways that support foundation staff’slearning and reflection. We have intentionally included limited, if any, commentary on charts and tables to allowHewlett staff to interpret the data in ways that are most informative and important to their grantmaking. We hope thatthis data book inspires reflection and learning, and helps foundation staff better understand the composition of theircurrent U.S.-based grantees that were active as of November 2017.Information gathered through the survey is included in this data book. In the next section we provide a brief overviewof the survey sample and key characteristics of survey respondents and non-respondents. In subsequent sections ofthe data book we include race/ethnicity and gender demographic data at the foundation and at program- andinitiative-levels, as well as qualitative feedback from grantees. The survey is included as an appendix.About The SurveyThe survey of grantee demographics included 15 questions (See Appendix for complete survey). Key questionscentered on race/ethnicity and gender demographic information for grantees’ boards, head(s) of organization, seniorstaff, and other staff. The survey also asked grantees to report on their organization’s annual operating budget, regranting made to other organizations with Hewlett Foundation funds, and whether they served as a fiscal sponsor.To better understand how data were collected we asked grantees if data they provided in the survey were gathereddirectly or indirectly from their boards and staff, and which, if any, additional race/ethnicity and gender categoriesthey include in their own demographic surveys. Finally we asked respondents to offer advice to the foundation as itworks to understand and further integrate diversity, equity, and inclusion into its various strategies (see GranteeFeedback section for selected respondent quotes). All survey questions, with the exception of those pertaining to basicorganizational characteristics, were optional.iiThe William and Flora Hewlett Foundation (2018). Diversity, equity, and inclusion. Retrieved /Survey of Grantee Demographics Data Book4
The survey’s questions and response choices drew upon publicly available sector standards, especially thoseestablished by Guidestar, as well as information gathered through conversations with social-sector leaders deeplyengaged in diversity, equity, and inclusion work. An working group comprised of representatives from all HewlettFoundation programs also provided input and feedback on the survey’s content and design. The reporting standardswere chosen to enable alignment with other data sourcing initiatives. To place minimal burden on grantees,respondents were given the option to share information in the form closest to how they originally collected it. Forexample, for the race/ethnicity category, respondents had the option to identify board members and staff as eitherMulti-Racial/Multi-Ethnic, or to count a single board member or staff person in more than one specific race/ethnicitycategory (e.g., Asian/American and Black/African-American). More information about the survey and its questions isincluded in the following sections of this introduction and throughout the data book.The survey did not provide any instructions or guidelines on how organizations should collect race/ethnicity andgender demographic data. We did, however, note in the introduction that organizations that did not have demographicdata on hand could gather data voluntarily from their boards and staff to complete the survey. We provided the Green2.0 Demographic Survey Templateiii as an example survey that could be adopted and customized to gather thenecessary information to complete this survey.People at Grantee OrganizationsThe survey asked grantees to report demographics on four groups of people associated with their organizations: boardmembers, head(s) of organization, senior staff, and other staff. In the survey’s instructions we defined head(s) oforganizations as the President, CEO or Executive Director and defined senior staff as individuals who report directly tothe President, CEO, or Executive Director. Other staff were defined as any staff not counted as head(s) of organizationor senior staff. University grantees were provided different instructions to accommodate the structure of thoseinstitutions.ivSurvey respondents were asked to report counts of their board members, head(s) of organization, senior staff, andother staff. We used this information during our analysis to calculate the percentages of board members and staff whowere identified as members of race/ethnicity and gender -Template.pdfThe survey we sent to university grantees included the following guidelines:Board Members: If your organization, department, or school does not have a board, please enter “0.”President/CEO/Executive Director: Please include the head of the organization, school, or department. This may be a dean ordepartment chair, for example.Senior Staff: Please include all staff in your organization, school, or department that report directly to the head of theorganization, school, or department and spend any amount of time working at the organization, school, or department. Pleasedo not include researchers to whom the organization grants funds.Other Staff: Please include all staff that spend any amount of time working for the organization, school, or department. Pleasedo not include researchers to whom the organization grants funds.Survey of Grantee Demographics Data Book5
Race/Ethnicity DemographicsThe survey included the following nine race/ethnicity categories/response options: Asian/Asian American Black/African American Native American/American Indian/Alaska Native/Native Hawaiian/Other Indigenous Groups Hispanic/Latino/Latina White Multi-Racial/Multi-Ethnic (2 races/ethnicities) Decline to State Other Unknown (information not collected)Respondents were able to count a single board or staff member in any applicable race/ethnicity category.Respondents were also asked to share if they collect more detailed race/ethnicity information than was captured in thesurvey, if they reported information gathered directly or indirectly from their boards and staffs, and if the informationthey reported was already available when they received the survey.Gender DemographicsThe survey included the following six gender categories/response options: Female/Woman Male/Man Non-binary Transgender Decline to State Unknown (information not collected)Respondents were able to count a single board or staff member in any applicable gender category.Respondents were also asked to share if they collect more detailed gender information than was captured in thesurvey, if they reported information gathered directly or indirectly from their boards and staffs, and if the informationthey reported was already available when they received the survey.Grantee FeedbackAt the end of the survey, we asked respondents for advice to the foundation as it works to understand and furtherintegrate diversity, equity, and inclusion into its programs and strategies and if there were any notes about the datathey provided in the survey. Selected quotes from respondents are included in the Grantee Feedback section of thedata book.Survey of Grantee Demographics Data Book6
Survey RespondentsThe survey of grantee demographics was emailed to 705 of the foundation’s current U.S.-based grantees that wereactive as of November 2017. Some 39 survey respondents (6 percent) opted out of the survey and 428 respondents(59 percent) opted to continue on in the survey and answered some or all of the remaining survey questions. A totalof 238 grantees (34 percent) did not respond to any part of the survey. The Western Conservation strategyadministered its own grantee demographics survey. Fifty-three grantees responded to the Western Conservationsurvey. Data gathered through the Western Conservation survey is included in this data book.Survey of Grantee Demographics Data Book7
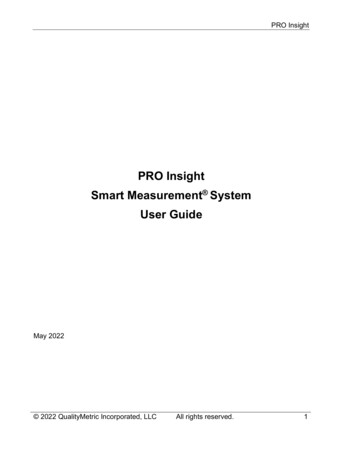
Overview of SampleIn total, 759v U.S.-based Hewlett Foundation grantees that were active as of November 2017 were surveyed on thedemographic makeup of their boards and staff. Survey response ratesvi varied by program, from 56 percent to 83percent, with an overall foundation-level response rate of 68 percent. Grantees that receive foundation fundingthrough multiple programs are included in each program’s unique response rate.Exhibit 1. Response Rate, All Grantees (n 759)NonRespondents32%Respondents68%Exhibit 2. Response Rate by ProgramSpecial Projects (n 66)56%Philanthropy (n 33 )61%ProgramPerforming Arts (n 232 )74%Madison Initiative (n 75 )61%Cyber Initiative (n 32)63%GDP (n 146)65%Environment (n 117 )83%Education (n 102 )59%Percent RespondentsvThis total includes 706 grantees surveyed through the Harder Company-administered grantee survey, as well as 53 WesternConservation grantees surveyed through a separate process. Both surveys were intentionally designed to allow for dataaggregation.viSurveys were considered “complete” if respondents progressed past the opt-out item (Q4) and explicitly indicated eithertheir willingness to complete the survey, or their desire to not do so.Survey of Grantee Demographics Data Book8
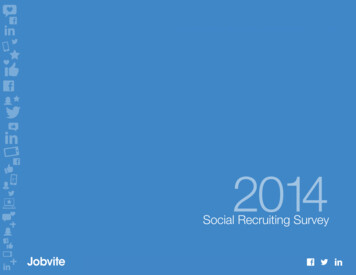
In order to better understand trends behind survey completion, organizational-level characteristics were comparedand analyzed between those grantees that responded to the survey, and those that did not. This analysis was basedon grantee data provided directly by the foundation on total grant dollars awarded. There were no statisticallysignificant differences between survey responders and non-responders in total grant dollars awarded.Of those grantees that responded to the survey, 39 chose to explicitly opt out of providing demographic informationon the people at their organization. These opt-outs generally skewed toward larger and more bureaucratic granteeorganizations, with one third (13) representing university-based grantees.Among respondents who opted out of the survey, most (n 20) who provided an explanation for opting out shared thatthey did not collect race/ethnicity and/or gender demographic data from their boards or staffs. Some of theserespondents did not have the capacity to administer such a survey and others were unable to collect the informationwithin the survey’s timeframe. A few respondents (n 5) did not have access to board and/or staff demographic data.One respondent reported having outdated information.Respondent CharacteristicsAmong the respondents to the survey, we observed a healthy spread of organizational sizes. The largest staff sizereported was 14,828, with a median staff size of 16 people (not including board members). Half (fifty percent) ofgrantee organizations reported staff sizes between 6 and 44 people.In addition to staff counts, we examined annual operating budgets as a measure of organizational size. Exhibit 3 belowillustrates the distribution of budget sizes among respondents.Exhibit 3. Survey Respondents’ Annual Operating Budgets (n 458)Percent of Respondents39%32%15%14%Less than 500,000 500,000- 2.49M 2.5M- 19.9M 20M or moreBudget SizeThe survey’s introductory section also included a question on whether or not grantees served as fiscal sponsors or regranted dollars using funds obtained from the foundation. A large majority of respondents (79 percent) reportedengaging in neither practice. The table below summarizes all responses to this survey item.Survey of Grantee Demographics Data Book9
Exhibit 4. Re-granting and Fiscal Sponsorship Practices (n 460)CategoryPercentNot a re-grantor or a fiscal sponsor79%Re-grantor14%Fiscal sponsor4%Re-grantor and fiscal sponsor3%Survey of Grantee Demographics Data Book10
Foundation-Wide GranteeDemographicsThis section includes information for all grantees that provided race/ethnicity and/or gender demographic data(n 546)vii. It includes the following sub-sections: 1) People of Color, 2) Race/Ethnicity Demographics, 3)Women/Females, 4) Gender Demographics, and 5) People of Color and Women/Females.People of Color at Hewlett Foundation Grantee OrganizationsSome 452 grantees provided race/ethnicity demographic information for at least one of the following categories: boardmembers, head(s) of organization, senior staff, and other staff. In the survey’s instructions we defined head(s) oforganizations as the President, CEO or Executive Director and defined senior staff as individuals who report directly tothe President, CEO, or Executive Director. University grantees were provided different instructions to accommodatethe structure of those institutions.viiiSome 60 percent of organizations gathered race/ethnicity information directly from their staff and 40 percent gatheredrace/ethnicity information indirectly. Among respondents who gathered race/ethnicity data indirectly, most (n 92)provided information based on their personal knowledge of staff or through informal conversations, 17 respondentsprovided information based on observations, and another 15 provided information from personnel files.For the purposes of this survey, we defined people of color as all individuals who were identified as belonging to arace/ethnicity categoryix other than White or Unknown, or who declined to state their race/ethnicity.Before reading this sub-section, please note: The unit of analysis for all charts in this sub-section isorganizations, not individual people. That is, all n’s represent the total number of organizations included in therespective analysis.viiThis total represents all respondents that completed the first four questions of the survey administered by Harder CompanyCommunity Research and chose not to opt out on additional questions when prompted. It also includes respondents to theWestern Conservation survey. Not all respondents included in this total provided race/ethnicity and/or gender demographicdata for their boards and staffs.viiiSee footnote ii for guidelines provided to university grantees.ixWe included the following race/ethnicity categories in the survey: Asian/Asian-American, Black/African-American,Hispanic/Latino/Latina, Native American/American Indian/Alaska Native/Native Hawaiian/Other Indigenous Groups, White,Multi-racial/multi-ethnic, Other, Unknown (information not collected), and Individuals decline to state.Survey of Grantee Demographics Data Book11
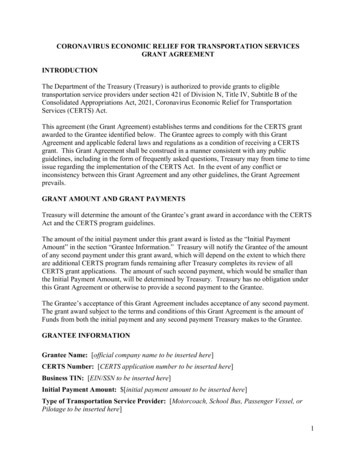
Percent of OrganizationsExhibit 5. Percent Board Members of Color, All Grantees (n 413)i23%20%18%Mean 60-69%70-79%2%80-89% 90-100%Percent People of ColoriThis chart shows the total percent of organizations that have 0-9%, 10-19%, 20-29%, 30-39%, 40-49%, 50-59%, 60-69%,70-79%, 80-89%, or 90-100% of board members of color in their organizationsExhibit 6. All Staffi of Color, All Grantees (n 442)ii,iiiPercent of OrganizationsMean -49%50-59%60-69%70-79%4%80-89% 90-100%Percent People of ColoriAll staff is defined as an organization’s head(s) of organization, senior staff, and other staff; board members are not includedin the all staff countiiThis chart shows the total percent of organizations that have 0-9%, 10-19%, 20-29%, 30-39%, 40-49%, 50-59%, 60-69%,70-79%, 80-89%, or 90-100% of all staff of color in their organizationsiiiDue to rounding, total is greater than 100%Survey of Grantee Demographics Data Book12
Exhibit 7. Range and Distribution of People of Color by People Type, All Granteesi,ii100%Percent People of Color90%80%70%60%50%40%30%20%10%0%Board (n 413)Senior Staff (n 418)Other Staff (n 407)People TypeiIn this chart the minimum value is the tick mark at the bottom of the boxplot. The lower line of the blue box is the firstquartile and the white line in the box is the mean. The upper part of the box is the third quartile and the tick mark at the topof the boxplot represents the maximum value.iiHeads of organizations were intentionally omitted from this chart. The mean people of color among head(s) of organizationsis 22 percent (n 427)Exhibit 8. Range and Distribution of People of Color by Total Annual Operating Budget, All Granteesi100%Percent People of Color90%80%70%60%50%40%30%20%10%0%Less than 500,000 500,000- 2.49M(n 55)(n 130) 2.5M- 19.9M(n 152) 20M or more(n 55)Annual Operating BudgetiIn this chart the minimum value is the tick mark at the bottom of the boxplot. The lower line of the blue box is the firstquartile and the white line in the box is the mean. The upper part of the box is the third quartile and the tick mark at the topof the boxplot represents the maximum value.Survey of Grantee Demographics Data Book13
Race/Ethnicity Demographics of Hewlett Foundation Grantee OrganizationsThe following charts and tables show the percent and count of 1) board members, 2) all staff, which includes head(s)of organizations, senior staff, and other staff, 3) head(s) of organization, 4) senior staff, and 5) other staff,respectively, by the race/ethnicity categories included in the survey. Some 452 organizations provided race/ethnicityinformation for at least one of the aforementioned categories.Before reading this sub-section, please note: The unit of analysis for all charts and tables in this sub-section ispeople. That is, the n represents the total number of people at all Hewlett Foundation grantee organizations includedin a given analysis. Each chart includes a note stating how many organizations the people in the analysis represent.The n’s used to determine the percent of a given type of people and the count of a given type of people are different.To determine the percent of people who were identified as each race/ethnicity category included in the survey, weused information from two survey questions (Q5 and Q6). Any respondents who did not respond to both questionswere excluded from the sample and analysis. To determine the counts of people who were identified as eachrace/ethnicity category included in the survey, we used information from one question (Q6).Exhibit 9. Percent Board Members by Race/Ethnicity Category, All Grantees (n an8%iBoard members represent 409 organizations 1% respondents declined to state their race/ethnicityiiiThe survey included the category Native American/American Indian/Alaska Native/Native Hawaiian/Other IndigenousGroups. It has been shortened to Indigenous Groups in the visual because of space constraints.iiiDue to rounding, total is less than 100%iiSurvey of Grantee Demographics Data Book14
Exhibit 10. Total Count of Board Members by Race/Ethnicity Category, All Grantees (n 5,647)iCategoryWhiteiTotal Count3,649Black/African American482Unknown479Asian/Asian ulti-Ethnic116Native American/American Indian/Alaska Native/Native Hawaiian/Other Indigenous Groups62Other45Decline to State14Board members represent 452 organizationsSurvey of Grantee Demographics Data Book15
Exhibit 11. Percent All Staffi by Race/Ethnicity Category, All Grantees (n 41,584)ii,iiiMulti-Racial/ Unknown Decline to StateIndigenous an10%iAll staff is defined as an organization’s head(s) of organization, senior staff, and other staff; board members are not includedin the all staff countiiStaff represent 374 organizationsiii 1% of respondents were identified as OtherivThe survey included the category Native American/American Indian/Alaska Native/Native Hawaiian/Other IndigenousGroups. It has been shortened to Indigenous Groups in the visual because of space constraints.Exhibit 12. Total Count of All Staffi by Race/Ethnicity Category, All Grantees (n 42,674)iCategoryWhiteTotal Count26,737Asian/Asian American4,298Black/African 87Multi-Racial/Multi-Ethnic847Decline to State585Native American/American Indian/Alaska Native/Native Hawaiian/Other Indigenous Groups307Other121iAll staff is defined as an organization’s head(s) of organization, senior staff, and other staff; board members are not includedin the all staff countiiStaff represent 452 organizationsSurvey of Grantee Demographics Data Book16
Exhibit 13. Percent Head(s)i of Organization by Race/Ethnicity Category, All Grantees (n 538)ii,ii,ivIndigenousGroupsvHispanic/ 1%Latino/Latina6%Multi-Racial/ OtherMulti-Ethnic rican8%White76%iSome organizations reported having more than one head of organizationStaff represent 423 organizationsiiiTotal is greater than 100% because some respondents counted at least one head of organization in more than onerace/ethnicity categoryiv 1% of respondents declined to state their race/ethnicityvThe survey included the category Native American/American Indian/Alaska Native/Native Hawaiian/Other Indigenous Groups.It has been shortened to Indigenous Groups in the visual because of space constraints.iiExhibit 14. Total Count of Head(s)i of Organization by Race/Ethnicity Categories, All Grantees (n 582)iiCategoryWhiteiTotal429Asian/Asian American49Hispanic/Latino/Latina33Black/African American27Multi-racial or Multi-Ethnic16Unknown13Native American/American Indian/Alaska Native/Native Hawaiian/Other Indigenous Groups7Other7Decline to State1Some grantees reported having more than one head of organizationStaff represent 409 organizationsiiSurvey of Grantee Demographics Data Book17
Exhibit 15. Percent Senior Staff by Race/Ethnicity Category, All Grantees (n 2,878)i,ii,iiiIndigenousGroupsiv1%Multi-Racial/ UnknownMulti-Ethnic4%3%Decline to state1%Hispanic/Latino/Latina an9%iStaff represent 416 organizationsDue to rounding, total equals more than 100%iii 1 % respondents were identified as OtherivThe survey included the category Native American/American Indian/Alaska Native/Native Hawaiian/Other IndigenousGroups. It has been shortened to Indigenous Groups in the visual because of space constraints.iiExhibit 16. Total Count of Senior Staff by Race/Ethnicity Category, All Grantees (n 2,889)iiCategoryTotalWhite1,941Asian/Asian American253Black/African i-racial or Multi-Ethnic80Native American/American Indian/Alaska Native/Native Hawaiian/Other Indigenous Groups22Decline to State18Other14Staff represent 452 organizationsSurvey of Grantee Demographics Data Book18
Exhibit 17. Percent Other Staffi by Race/Ethnicity Category, All Grantees (n Groupsiv1%Unknown5%Decline to an9%White62%Asian/AsianAmerican10%iOther Staff were defined in the survey as all staff members who were not counted as head(s) of organization or senior staffStaff represent 402 organizationsiii 1% respondents were identified as OtherivThe survey included the category Native American/American Indian/Alaska Native/Native Hawaiian/Other IndigenousGroups. It has been shortened to Indigenous Groups in the visual because of space constraints.iiExhibit 18. Total Count of Other Staffi by Race/Ethnicity Category, All Grantees (n 39,203)iiCategoryWhiteTotal Count24,367Asian/Asian American3,996Black/African 61Multi-Racial/Multi-Ethnic751Decline to State566Native American/American Indian/Alaska Native/Native
The survey of grantee demographics included 15 questions (See Appendix for complete survey). Key questions centered on race/ethnicity and gender demographic information for grantees' boards, head(s) of organization, senior staff, and other staff. The survey also asked grantees to report on their organization's annual operating budget, re-