Transcription
1Q22 Financial ResultsAdvanced Info Service Plc.10 May 2022
1Q22 Executive SummaryProlonged economic impact from Omicron outbreak andrising inflation in 1Q22Growth in fixed broadband and enterprise revenue surgedsignificantly Thailand’s economic recovery was challenged as privateconsumption remained subdued. Mobile service continued to beimpacted by low tourist arrivals and weak consumer spending. AIS Fibre continued to surge to stand at 1.87mn subscribers,adding 93k or rising 30% YoY as demand for home broadbandremained robust AIS reported core service revenue of Bt32,770mn, improving 1.1%YoY driven by strong growth of fixed broadband and enterprisebusiness. QoQ, it dropped -1.9% mainly from lower mobile revenue. Non-mobile enterprise revenue grew 31% YoY and accounted for3.8% of core service revenue. The growth was driven by robustdemand for Cloud service and ICT solutionsMobile revenue impacted by economy & price competitionSoften EBIDA following revenue decline while maintainedFY22 guidance Mobile revenue was Bt28,847mn, dropping -1.7% YoY and -2.5%QoQ impacted by low spending amidst Omicron’s spread andrelatively high base of 1Q21 from government stimulus campaign. EBITDA in 1Q22 dropped -0.8% YoY and -2.3% QoQ followingrevenue decline to amount of Bt22,404mn with a margin of 49.5%. Our 5G network continued to expand with 20k BTS and reached78% of the population With our all-out effort to drive 5G adoption, 5G subscribers as ofMar-22 reached over 2.8mn or 6.3% of total subscribers, whileARPU uplift remained around 10-15%.Net profit decreased -5.0%YoY due to higher spectrum amortizationand -8.1%QoQ from lower core service revenue and unrealizedforeign exchange loss. The full-year guidance and outlook for 2022 were maintained.2
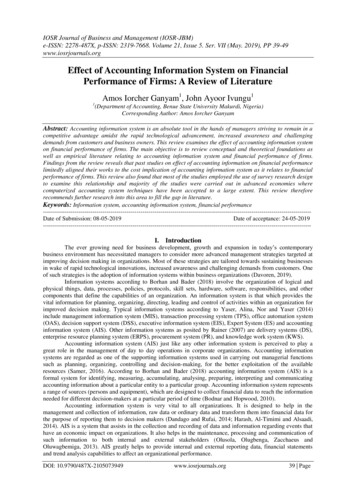
1Q22 Performance:Core service revenue supported by strong growth in FBB and enterprise businessCore service revenue (Bt mn)-1.7% YoY32,425 27% YoY519EBITDA (Bt mn) 29% YoY 1.1% YoY33132,770-1.3% YoYReported NPAT (Bt mn)-2.5% YoY 0.8% YoY-0.8% YoY-0.8% YoY 2.8% YoY447504-5.0% YoY20441582-7% YoY177360Constructionand Real estate1Q21 CoreServicerevenueMobileFBBCore service revenue (Bt bn)Enterprise 1Q22 Corenon-mobileService& othersrevenueTotalrevenueEBITDA (Bt bn)Total costex. D&A 1.1% YoY-0.8% YoY-1.9% QoQ-2.3% QoQNPAT (Bt bn)-5.0% YoY-8.1% QoQNormalizedNPAT-7.0% YoY-5.8% QoQCore service revenue rose by 1.1% YoY amid prolonged COVID-19 from strong growth in fixed broadband and enterprise business whiledropped 1.9% QoQ mainly from mobile revenue.EBITDAdecreased YoY and QoQ following core service revenue and continued investment to strengthen our network leadership.System IntegratorNPAT dropped YoY following higher spectrum amortization while declined QoQ due to lower core service revenue and unrealized FX loss.Norm. NPAT (excluding unrealized FX loss) declined 7.0% YoY and 5.8% QoQ.Hotel and Recreation3
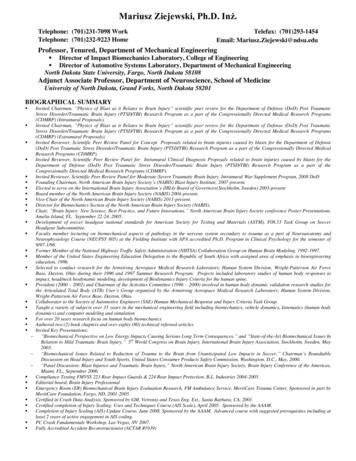
Mobile: Weak consumer spending & competition affected mobile revenueMobile revenue (Bt bn)Total subscriber (mn)Mobile ARPU (Bt/sub/month)-1.7% YoY-2.5% QoQ42.843.2 Decreased YoY and QoQ following a drop in ARPUdue to weak economy and price competition despitesubscriber 32225223224216-6.9% YoY-3.5% 32.232.144.143.7Blended11.8 Low spending and price competition pressured onARPU dilutionNet additional subscriber (‘000)Data Consumption888% Mobile Revenue ContributionBlended VOU (GB/data sub/month)PostpaidPrepaidIR Q213Q214Q21 Postpaid growth continued to expand from bothnew acquisition and pre-to-post migration19.7%QoQ 5%0.8%269 23855%1Q211Q21Prepaid Subscriber base continued to grow to stand at 44.6mnfrom both prepaid and postpaid Increase in prepaid driven by its acquisition momentumwhile expanding in postpaid due to handset bundlingand better churn protection 2Q21Downward trend in data consumption after openingthe country and the ease of covid restriction
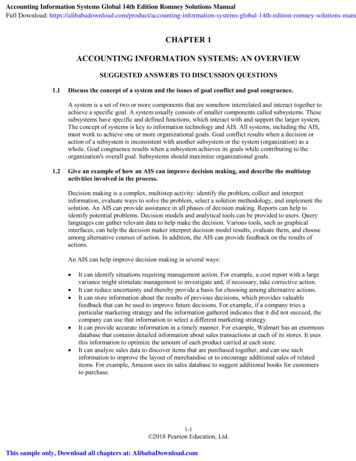
5G subscribers continued to expandedwith the goal of achieving 5mn 5G subscribers by 2022Enhance leadership in 5G networkScale expansion with value uplift 99%MAR-22BKK(Populationcoverage)77provinces 96% 90%EECArea21K sites5G Base station(as of MAR-22)Target of 2022 78%85%Nationwide coverage(Population coverage)2.8mn5.0mn5G package subscribers5G package subscribers(3.0mn for 5G handseton AIS network) 10-15%5G ARPU upliftMonetization5
Proactively promoted 5G services to leverage our best 5G networkEnhanced customer experiences through AR and VR technologiesLaunched Avatar Park:New feature of Metaverse World Allowing customers to create theirown identity and make new friendsin metaverse on V-AVENUE.COContinued to drive MAU onAIS V-AVENUE.CO withmore partnersNew Partners
FBB: Expanded revenue accelerated by Work from home demandContinued to deliver strong growth with slight increase in ARPUBusiness Services17%21%23%27%24%7% revenueMaintained steady growth with scale and quality1,4321,5361,6691,7721,865Contribution 14% subscriberConstructionand Real estateFinance market shareAIS Fibre revenue expanded with double-digit growth due tostrong demand from remote working951041Q212Q211333Q211034Q21Net addition (‘000)93Ending subscriber(‘000)1Q22 Gained 93k subscribers in 1Q22, on track to meet target 2.2mn by theend of 2022Maintained leadership as the first intelligent Wi-Fi in ThailandARPU slightly rebounded despite price competitionGovernment-3.4% YoY 0.7% QoQ462458455Wholesale and System Integrator AIS Fibre has differentiated its service with value added andbundling package to ease pressure on ARPUHotel and Recreation Debuted an AI-poweredSmart Router whichallocates data traffic andshares the Internet signalon separate pipes toprovide VIP Service forfaster speed and lowerlatency Launched ‘Power4Advance’ package bundling with AI-poweredSmart Routers for 3 core groups : Gamer, Work & Learn Online andLive & Stream7
Enterprise: Seize opportunities in digitalization trend to drive revenueCaptured growth with an increase in contribution rate to service revenueEnterprise non-mobile revenue*11%1.3 billionYoY growthRevenue (Bt mn)13%23%Enterprise Data service(EDS)*Enterprise Rev in 1Q2226%31%100050001Q212Q213Q214Q211Q22%YoY revenue%YoY revenue14%3.8%% on core service revenue Non-mobile enterprise businessstill had a strong growth due to ahigher demand of Cloud and ICTsolutions.5.2%Cloud, Data centerCybersecurity, IOT and ICTsolutions*88%11%6.9%4.6%1Q21 2Q21 3Q21 4Q21 1Q22 EDS continued to gain growthmomentum amid the competition31%71%105%14%1Q21 2Q21 3Q21 4Q21 1Q22 Strong growth in CCIID boostedby robust demand for Cloudservice and ICT solutionsStrive to achieve double-digit growth via 5 key strategies and collaborationSmartTransportation andLogisticsSmartProperty andSmartRetail5 StrategiesConnecting 5G Ecosystem toEnhance BusinessesAgricultureSmart HealthSmart Automation and Manufacturing*Note: there has been a reclassification in revenue for enterprise services since 2020Enhancing network performancewith Intelligent NetworkEnhancing Digital Infrastructure andPlatform for BusinessesEnhancing Data-Driven BusinessCapability for Business OpportunitiesDelivering Solution and ManagedService by Trusted Professionals8
2022 GuidanceFY22 Guided itemsBusiness ServicesCore service revenueConstructionand Real estateGuidanceMid-single digit growthRationale FinanceEBITDALow-single digit growth Leverage 5G service to gain market share in high value segmentGrow FBB with target of 2.2mn subscribers with increase inARPH from FMC strategyEnterprise non-mobile continues to grow double digitContinue to digitally transform focusing on customer experienceand to optimize the cost to serveensure an effective capital allocation to capture growthopportunityGovernment CAPEX*exclude spectrumWholesale and RetailBt30-35bn Build 5G leadership to deliver a superior customer experience,targeted to reach 85% population coverageExpand AIS Fibre coverage to capture untapped demandEnhance our enterprise business and digital servicesSystem IntegratorHotel and Recreation9
Appendix
Healthy Balance sheet and cash flow to support investmentBalance Sheet1Q22 Cash flow(Bt bn)(Bt bn)7111617 16 25A/R3251othersretained 1.80.5Lease liabilities paid50Equity76868.67.7Repayment ofST & LT borrowings356interestbearingdebtLT borrowingsB/S1Q22Net cash19.4Liabilities280Cash decreaseFinancingFinance costAssets129InvestingSpectrum licensespectrumlicense42OperatingCash CAPEX2949spectrumlicensepayableA/PIncome tax paidothersOperating cash flowrightof useCash increasecash others0.8x1.1xNet debt to EBITDAInterest bearing debtto Equity0.4x32%Current ratioReturn on EquityOperating cash flow was healthy to support CAPEX, spectrumpayment, and dividendInvesting cash flow was Bt9.4bn, including spectrum payment ofBt1.8bnAverage finance costs 2.6% p.a. Maintained investment grade credit ratings Fitch: national rating AA (THA), outlook stable S&P: BBB , outlook stable11
1Q22 Revenue breakdownOther service revenuesFixed broadband revenueMobile revenue(Bt bn)(Bt bn)(Bt bn)-1.7% YoY-2.5% QoQ 27% YoY 6.4% QoQ Decreased YoY and QoQ following adownward trend in ARPU due to weakFinanceconsumer spending and price competition 29% YoY-1.9% QoQ Subscriber base expanded to 1.87mn withan increase QoQ in ARPU to Bt446 Boosted by higher demand for CloudService and ICT solutionsNet Sales & marginIC and TOT partnership(Bt mn)(Bt bn)-14% YoY-4.0% QoQ Dropped YoY and QoQ due to lowernetwork traffic with TOT and change inIC rate effective from Jan-22.Hotel and Recreation Lower sale volume from high seasonal sales of thenew iPhone13 in 4Q21 while sale margin grewdue to an increased sales mix of higher-marginhandsets.12
1Q22 Cost breakdownD&ARegulatory fee(Bt bn)% to core service revenueNetwork OPEX and TOT partnership(Bt bn)(Bt bn) 2.9% YoY-1.4% QoQ-0.3% YoY-4.7% YoY 0.2% QoQ 7.8% QoQ YoY flat in-line with core servicerevenue while QoQ increase fromFinancerelatively low base in 4Q21. Increased YoY from additional 700MHzspectrum acquisition in Apr-21 andcontinued investment in 5G/4G network Decreased YoY from lower network traffic with TOT, whileremaining flat QoQAdmin & othersMarketing expense(Bt bn)% to core service revenue-9.2% YoY-14% QoQ Dropped YoY and QoQ impacted by lower marketingcampaigns and high-seasonal spending in 4Q21Hotel and Recreation(Bt bn) 5.1% YoY-1.2% QoQ YoY rose mainly from higher staff cost, whereas QoQdecline due to some seasonal staff-related expenses13
Contact usIR website: http://investor.ais.co.thEmail : investor@ais.co.thTel: 662 029 3145Some statements made in this material are forward-looking statements with the relevant assumptions, which are subject to various risks and uncertainties. These include statements with respect to ourcorporate plans, strategies and beliefs and other statements that are not historical facts. These statements can be identified by the use of forward-looking terminology such as “may”, “will”, “expect”,“anticipate”, “intend”, “estimate”, “continue” “plan” or other similar words.The statements are based on our management’s assumptions and beliefs in light of the information currently available to us. These assumptions involve risks and uncertainties which may cause the actualresults, performance or achievements to be materially different from any future results, performance or achievements expressed or implied by such forward-looking statements. Please note that thecompany and executives/staff do not control and cannot guarantee the relevance, timeliness, or accuracy of these statements.
YoY driven by strong growth of fixed broadband and enterprise business. QoQ, it dropped -1.9% mainly from lower mobile revenue. Growth in fixed broadband and enterprise revenue surged significantly AIS Fibre continued to surge to stand at 1.87mn subscribers, adding 93k or rising 30% YoY as demand for home broadband remained robust