Transcription
International Journal of Business and Social ScienceVol. 7, No. 1; January 2016An Empirical Study on the Influence of Non-Debt Tax Shield on the Choice ofCorporate Debt Levels----Based On the Tax Preference PolicyRuibing GaoDoctor CandidateDepartment of AccountingCentral UniversityFinance and EconomicsBeijing CityChinaAbstractThis paper exploits the data from A- share listed corporations of China from 2008 to 2013, using the ratio of thesum of fixed assets depreciation and intangible assets amortization and R&D expenses and R&D expenses plusdeduction to total assets as substitute variables of NDTS, attempts to check the impact of the non- debt tax shieldon the choice of corporate debt levels, and further analyzes whether the effect of the non-debt tax shields isdifferent in different nature of enterprise ownership or different industries. This study finds a negative andsignificant relationship between NDTS and corporate debt levels, which is consistent with the NDTS’s effecttheory of capital structure. In addition, we further find that the effect of the non-debt tax shields has ownershipnature and industry characteristics.Keywords: Non-debt Tax Shields; Debt levels; State-owned Enterprises; Industries; Endogen-nousIntroductionUnder the framework of MM (1958), the capital structure has nothing to do with the enterprise value. However, inconsideration of the corporate income tax, the high the tax rate, the more debt interest deduction. Thus, companieswhich apply high tax rates may choose higher leverages to increase business values. MM (1963) supports thisphenomenon that the value of the company with debt is higher than the debt free company. Therefore, itconcludes that debt can generate profits because of interest tax credit. Accordingly, this tax credit effect is calleddebt tax shield. However, excessive leverage not only has the tax credit effect, but also has the risk of financialcrisis; therefore enterprises should weigh their own debt levels (Miller, 1977). In addition, if the company issuedtoo much debt, which may lead to tax depletion phenomenon and then further induce the debt extrusion effect(Ross, 1985). Not the higher the better, even though the debt tax shield may increase the incentive for businessexecutives to choose more debts.De Angelo and Masulis (1980) find that depreciation, investment tax credits and deferred tax losses can be againsttaxes like debt interest. Moreover, it can reduce the cash outflows and decrease the financing needs of enterprises,so as to cut down the costs of capital. Thus, such non - debt but equally having a tax credit factor is called non debt tax shield (NDTS). The non-debt tax shield has a certain alternative effect on the debt. It can make up for theproblem of debt tax shield is too low so it is used by most governments as tax incentives. The Chinesegovernment is no exception. In order to encourage enterprises to carry out innovation activities, the Chinesegovernment has encouraged corporations to increase R&D investment for many years.Based on the non debt tax shield, Chinese government issued a series of tax incentives policies such as the "Enterprise Income Tax Deduction Method " in 2000, "Notice of the Enterprise Income Tax Preferential Policieson the Enterprise Technological Innovation" in 2006 (No.88 Financial Tax [2006]) and "The ManagementMethod of Enterprise Research and Development Expenses before Tax Deduction (Trial)" in 2008 (No.116National Tax [2008]), etc. The implementation of these preferential policies likely enhances the motivation ofmanagers to choose the non-debt tax shield evasion.201
ISSN 2219-1933 (Print), 2219-6021 (Online) Center for Promoting Ideas, USAwww.ijbssnet.comEspecially, under the background of incomplete capital market and strict bank loan constraints in China, theincentives of non-debt tax shield have a very important practical significance. In macro terms, it can guide thedevelopment of the national industry and then adjust the economic structure. In micro terms, it can not onlyreduce the tax cost, directly affect the performance of enterprises, but also affect the financing behavior of themanagement by reducing the cash flow, thereby affecting the capital structure of enterprises. However, theresearch on this aspect is not enough at present in China. In addition, Great changes have been happened after theimplementation of “No.6 Accounting Standard-Intangible Assets” in the recognition, measurement andaccounting of the enterprise R&D expenses and independent research and development of intangible assets.Combined with the No.116 National Tax [2008], it is necessary to empirically analyze the relationship betweenthe non-debt tax shield and the capital structure under the new institutional background and to verify whether thenon-debt tax shield effect theory hypothesis is established in China. Furthermore, further to check whether therelationship between the non-debt tax shield and the capital structure has the nature of ownership and industrialcharacteristics from the point of view of the property rights and industry difference.1. Literature Review and Research Hypothesis1.1 Non debt tax shield and corporate debt levelsThe transaction cost theory indicates that the transaction cost is derived from the limit rationality of the manager,the uncertainty of the transaction and opportunism. One of the objectives of the enterprise is to minimize thetransaction costs. At present, China's financial market is not perfect and there are many financing constraints. Thedebt contract is likely to increase the transaction costs of the enterprise because of the high interest of the bankloan. However, the non-debt tax shield does not require companies to pay the high cost, so it could reduce theamount of funds occupied. Therefore, companies have a strong incentive to choose the non-debt tax shield way todelay or reduce the taxes. All in all, the non-debt tax shield may be preferred over the debt tax shield(Beneish(1999); Kasznik(1999)). The non-debt tax shield plays a certain substitution effect on the debt tax shield;based on this, this paper puts forward the following hypothesis to be verified:Hypothesis 1: Non debt tax shield is negatively related to the corporate debt levels, and Non debt tax shield has acertain substitution effect on the enterprise debt.1.2 The influence of property right on Non debt tax shield effectAlthough China has completed the economic system reform, the influence of the planned economy still exists. Atypical example is the managers in state-owned enterprises usually have complicated political connection. Et alFan (2007) has found that the managers in the state-owned enterprises have a natural political connection and it ismore obvious to the extent of government intervention. The reason of government appointed executives to thestate-owned enterprises with the background of the government may be they have to bear and fulfill the socialfunctions of the government. Yanjie Bian, Ming Lei (2015) found that managers of state owned enterprise haveboth political and economic double roles because the state-owned enterprise itself has the dual nature of politicsand economy. They not only have the responsibility in achieving the national will, but also shoulder the duty ofleading enterprises steady development and consistently profitable in the competitive market. It shows that thestate-owned enterprises play an active role in the political and economic life. In addition, the President Xi pointsout that the owned enterprises are the backbone force of the development of national economy in China recently(Jinping Xi, 2015)i. Therefore the state-owned enterprises pay more attention to the constraints, when they choosethe tax avoidance, in order to circumvent the political costs caused by illegal business.Non debt tax shield is a national macro control means to guide industrial development and economic incentives toencourage enterprises to make full use of the national tax law to carry out business activities. Therefore, it islikely to be the best way to evade taxes for the managers of the state-owned enterprises. On the contrary, themanagement model of the non-state-owned enterprises is family business with a unique non-economic valuetarget. In addition, non-state-owned enterprises are often subject to financial constraints. It has less risk resistancecapacity and most of them pursuit the short-term interests. Therefore, they are less likely to carry out R&Dinvestment because of research results in the presence of uncertainty. From this, puts forward the secondhypothesis of this paper:Hypothesis 2: Compared with the non-state-owned enterprises, the negative correlation between the non-debt taxshield and the debt level is more significant in the state-owned corporations.202
International Journal of Business and Social ScienceVol. 7, No. 1; January 20161.3 The impact of industry difference on Non debt tax shield effectIn November 8th, 2012, the 18th meeting of Communist Party of China points out that technological innovation isthe strategic support to improve the social productive forces and the comprehensive national strength. It must beplaced in the core position of the national development, stressed the need to follow the path of independentinnovation with Chinese characteristics and the implementation of innovation driven development strategy. Inaddition, during the APEC summit in November 2014, President Xi further has driven innovation developmentstrategy to the world. There is no doubt that technology innovation has become the leading force to promoteglobal economic development.Moreover, investment in R&D is the key to improve enterprise innovation ability and core competitiveness. Inorder to encourage enterprises to increase R&D investment, the government issued a corporate research anddevelopment expenses tax deduction (Trial) (116) in December 10th, 2008. It made on a major adjustment for theR&D expenses of high and new tech enterprises in the pre tax deduction: Form of intangible assets, according tothe cost of intangible assets of 150% to be pre tax amortization within the period permitted by tax law. If nointangible assets are formed, allowing for a further the actual amount of R&D expenses of 50% to be deducteddirectly from the amount of taxable income in the year. These policies directly reduce the enterprise's capitalexpenditures and improve the operating cash flow, which may reduce corporate debt financing needs, and furtherreduce the cost of capital. On the contrary, non-high and new tech enterprises are not allowed to enjoy suchpreferential policies. From this, the third hypothesis of this paper has been proposed:Hypothesis 3:Compared with the non-high and new tech enterprises, the negative correlation between the nondebt tax shield and the debt level is more significant in the high and new tech companies.2. Methodology2.1 Sample Selection and Data SourcesThe new accounting standards issued at February 15, 2006 began to implement from 2007, and the No.116national tax policy and the enterprise income tax law come into effect at the beginning of 2008. In addition, highand new tech enterprise income tax rate decrease from 25% to 15% with a time limit. Thus, in order to maintainthe consistency and validity of data information, this paper selects the A-shares of listing corporation in Shanghaiand Shenzhen from 2008 to 2013 of China as the research object. Furthermore, these samples are divided into 12industries according to “the listing Corporation industry Classification Guidelines” promulgated by ChinaSecurities Regulatory Commission issued in 2001.Financial data come from the Wind database and corporate governance statistics are from the CSMAR database.In order to guarantee the validity of the sample and the veracity of the results, this paper screens the samplesaccording to the following principles:1. Remove the corporations called ST and PT during the study period.2. Remove the companies listed after the year of 2008.3. Remove the enterprises which operating income is zero or less than zero.4. Remove the companies which are lack of data.Finally, In order to reduce the effect of the abnormal value, all continuous variables are winsorized by the tail of1%. The final sample size is 10183 companies of the annual observations.2.2 Definitions of Key VariablesTable 1 gives the definitions of the main variables in this paper.203
ISSN 2219-1933 (Print), 2219-6021 (Online) Center for Promoting Ideas, USAwww.ijbssnet.comTable 1: Variable DefinitionTypesDependentVariablesNamesAsset Debt Ratio(ADR)Current Liability Ratio(CLR)IndependentVariablesNon Debt Tax Shield (NDTS)Company Size(Size)Collateral Value of(CVOA)AssetsCompany Growth (Growth)ControlVariablesProperty Rights (PR)Board Size(BS)Company Age (Age)Industry Variables (Industry)Year Variables (Year)DefinitionsTotal Debt /Total AssetsCurrent Liabilities/Total assets(Depreciation of Plant Asset Amortization ofIntangible Assets R&D Expenses R&DExpense Deduction)/ Total AssetsNatural Logarithm of Total Assets(Fixed Assets Inventory)/Total Assets(Final Total Assets-Initial Total Assets)/InitialTotal AssetsDummy Variables, State-owned Enterprise is 1,nois 0The natural logarithm of the numbers of the boardof directors.The number of years from listing to t.Dummy VariablesDummy Variables2.2.1 Dependent VariablesRajian and Zingales(1995) point out that the choice of proxy variables of capital structure depends on the purposeof the study. Because of the soft constraints of the creditor governance and the proportion of non-tradable sharesin the share capital structure is relatively high in listing corporations in China, this paper draws on the research ofGuoliu Hu and Jinggui Huang (2006) to treat asset debt ratio (ADR) and current liabilities ratio (CLR) assubstitute variables of the debt level.2.2.2 Independent VariablesForeign scholars use investment tax credits, fixed assets depreciation, deferred losses, R&D expenses, advertisingexpenses, stock options, pension plans, etc. as substitute variables of NDTS (De Angelo and Masulis,1980;Bradley et al., 1984; MacKie-Mason, 1990; Graham et al., 2004; Shivdasani and Stefanescue, 2010. In domesticstudies, Guoliu Hu and Jinggui Huang (2006) use the ratio of sum of fixed assets depreciation and amortization ofintangible assets and other assets to total assets as the replacement of NDTS. In this paper, the issue of R&Dexpenses plus tax incentives enhances the motivation for managers to choose the NDST evasion. Therefore, thispaper uses the ratio of sum of fixed asset depreciation and intangible assets amortization and R&D expenses andR&D expense plus deduction to total assets as substitute variable of non-debt tax shield.2.2.3 Control VariablesThis paper draws on the research of Frank and Goyal Frank (2004), combined with the special institutionalbackground of China, to control the following variables: Company Size (Size),Collateral Value of Assets(CVOA), Company Growth (Growth), Property Rights (PR), Company Age (Age), Industry Variables (Industry)and Year Variables (Year).3. Model DesignThis paper uses the following the multiple regression model to conduct empirical tests. This model studies therelationship between these variables and the substitute variables of capital structure, the form is:Debtit 0 1 Ndtsit 2Sizeit 3Cvoait 4Growthit 5 State 6 BSit 7 Age Indusry Year itThe dependent variable is Debt in the model. ADR and CLR as the substitute variables for the debt level variable.NDTS is a non-debt tax shield, if the NDTS coefficient is negative; it shows that there is a negative correlationbetween the non-debt tax shield and the debt level. Therefore hypothesis 1 has been confirmed that there issubstitution relationship between the non-debt tax shield and the debt.204
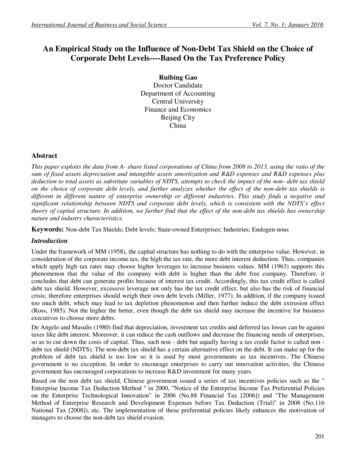
International Journal of Business and Social ScienceVol. 7, No. 1; January 2016For hypothesis 2 and hypothesis 3, above model can be grouped into different groups according to the groupingvariable to determine the size of the variable coefficient.4. Results4.1 Unvaried Analysis4.1.1 The Variation Tendency of NDTSFigure 1 is a time trend chart for mean of the non-debt tax shield (NDTS) of the listing corporations. The non-debttax shield (NDTS) presents a "U" type of change that first declines then climbs up from 2008 to 2013. The reasonmay be the Chinese economy is impacted by the financial crisis in the second half of 2008. The crisis leads to PPIand CPI data continually to decline and the economy has suddenly turned from expansion to shrink. Enterprisemanagement into trouble and non-debt tax shield effect presents a downward trend. To deal with the financialcrisis and stimulate economic recovery, the Chinese government takes the monetary policy and fiscal policy of"Moderate Loose" in time. It helps to expand domestic demand, reduce foreign trade dependence and rapideconomic recovery. The effect of non-debt tax shield increases with the economy's turnaround in 9201020112012Year2013Figuer 1: Annual Average non Debt Tax Shield4.1.2 The Relationship between NDTS and Debt LevelsFigure 2 is a diagram of the relationship between the non-debt tax shield (NDTS) and the debt levels. Thehorizontal axis is the tenths digit trend of non-debt tax shield. The first point means the lowest NDTS enterprisesand the tenth means the highest NDTS enterprises. The vertical axis is the mean of each variable in different partsof the corresponding. It can be seen from Figure 2 that the lowest NDTS corresponds to the highest level of debtand the highest NDTS corresponds to the lowest debt levels. Preliminary evidence suggests that there is anegative relationship between NDTS and debt 45678910Figuer 2: Relationship between non debt tax shields and capital structure205
ISSN 2219-1933 (Print), 2219-6021 (Online) Center for Promoting Ideas, USAwww.ijbssnet.com4.1.3 Descriptive StatisticsTable 2 is the descriptive statistics in this paper. The mean of ADR is 0.445. It shows that the debt levels in listingcorporation in China are far below that in developed countries. Moreover, the mean of CLR is 0.361. It shows thatthe short-term debt ratio is low and the probability of default is small. Furthermore, the mean of NDTS is 0.035,the median of NDTS is 0.032, the maximum value is 0.128 and the minimum value is 0.001. It shows that someenterprises make full use of the tax effect of NDTS.Table 2 Descriptive dians0.4420.3420.03212.40.3870.1132.2014Standard imum1.21.070.12816.20.8330.8022.711634.1.4 Correlation AnalysisTable 3 shows the results of Pearson correlation coefficient for each variable. The results show that there is a highcorrelation between the non-debt tax shield (NDTS) and the debt level. The correlation coefficients of NDTS onADR and CLR are -0.131 and -0.087. Moreover, they are remarkable at the level of 1%. This is consistent withthe discovery of Guoliu Hu and Jinggui Huang (2006) that non- debt tax shield is in line with the alternative ofdebt. In addition, the correlation coefficient between the variables is not more than 0.5, which indicates that themodel does not have a problem of multi-co linearity.Table 3 Pearson Correlation 87***1NDTS-0.13***-0.087*** 1Size0.287***0.099***-0.286*** 1Cvoa0.393***0.282***0.1***0.185** 1Growth-0.152*** -0.149*** -0.127*** -0.004-0.248*** 1BS0.118***0.053***0.032***0.298** 0.097***-0.0071Age0.175***0.122***-0.184*** 0.208** 0.098***-0.215*** 0.003 1note:***, **,* mean remarkable at the level of 1%,5% and 10%.4.2 Multivariate Regression AnalysisIn this section, this paper tests the impact of the non- debt tax shield on the choice of corporate debt levelsthrough multiple regression analysis, as well as if it could be affected by the nature of enterprise ownership andindustry characteristics.4.2.1 Full sample regressionTable 4 is the full sample regression results of the relationship between NDTS and company debt level. Firstly,this paper checks the impact of NDTS on corporate debt levels by basic regression and binary cluster adjustmentanalysis. In particular, column 1and column 2 is the basic regression results, the column 3 and the column 4 arethe binary cluster adjustment regression results. In column 1 and column 3, the dependent variable is ADR andindependent variable is NDTS. It shows that there is a negative correlation between the non-debt tax shield andcorporate debt levels when it is significantly negative at 1% levels. That is, the greater the non-debt tax shields,the lower the level of corporate debt. In column 2 and column 4, the dependent variable is CLR and theindependent variable is NDTS. It is significantly negative at 1% levels. Thus, hypothesis 1 is supported by theabove conclusions.206
International Journal of Business and Social ScienceVol. 7, No. 1; January 2016At the same time, it is in line with expectations: the larger the company, the higher the collateral value of assets,and the older the enterprise and state-owned enterprises, Corresponding to the higher the debt ratio.Table 4 Results of Regression AnalysisBasic regressionBinary cluster 0,18310,18310,183Adj r20.3880.2760.3880.276note:***, **,* mean remarkable at the level of 1%,5% and 10%, and brackets for T values. binary cluster,namely use Cluster2 to adjust the standard deviation in the company and the year.4.2.2 Sub sample regressionIn order to further verify the relationship between the NDTS and corporate debt levels, this paper analyzes thedifferences between the non- debt tax shield effect in the two groups according to the nature of property rights andindustry characteristics.1. The Regression Analysis of the Impact of Ownership nature on the NDTS EffectThis paper divides the observation samples into two groups: state-owned enterprises and non-state-ownedenterprises according to the nature of ownership, to carry out the corresponding regression. Table 5 gives theresults of the impact of ownership difference on the NDTS effect. In particular, the column 1and column 2 is theregression results of ADR. Moreover, column 1 is the regression results of the non-state-owned enterprises, whichregression coefficient is -0.650 and it is remarkable at the level of 1%. Column 2 is the regression results of thestate-owned enterprises, which regression coefficient is -1.001 and it is remarkable at the level of 1%. Thecoefficient difference between state-owned enterprises and non-state-owned enterprises is significant at the levelof 1%. It is shown that the correlation between NDTS and the ADR is more significant in the state-ownedenterprises. That is, compared with the non-state-owned enterprises, NDTS plays a greater role in the state-ownedenterprises. The dependent variable is CLR in column 3 and column 4. NDTS coefficient is significantly negative,and the difference between the two coefficients is significant at the level of 10%, which further supports theimportance of NDTS in the state-owned enterprises. Therefore, hypothesis 2 set up. Finally, the correspondingcontrol variables are consistent with the main regression results.207
ISSN 2219-1933 (Print), 2219-6021 (Online) Center for Promoting Ideas, USAwww.ijbssnet.comTable 5: Results of Regression Analysis(1)(2)(3)(4)VariablesADRADRCLRCLRPR 0PR 1PR 0PR 24)(-2.32)(-2.33)Prob (Difference) 0.00Prob (Difference) YESYESYESObservations5,9164,2675,9164,267Adj r20.3890.2800.3010.235note: ***, **,* mean remarkable at the level of 1%,5% and 10% and brackets for T values.2. The Regression Analysis of the Impact of Industry Characteristics on NDTS effectMoreover, the observation sample is divided into the high and new tech enterprise group and the non-high andnew tech enterprise group based on the policy of management of the high and new tech enterprises to deal withthe regression model. Table 6 shows the results of the impact of industrial characteristics on the non-debt taxshield effect. In particular, the dependent variables are ADR in column 1 and column 2. Specifically, column 2shows the results of regression of high and new tech enterprises. The regression coefficient is -1.089, and thecoefficient is significant at the level of 1%. Column 1 shows the results of regression of non-high and new techenterprises. The regression coefficient is -0.801, and the coefficient is significant at the level of 1%. Thedifference between the high and new tech enterprise group and the control group was significant at the level of5%. It is shown that the negative correlation between NDTS and the ADR is more significant in the high and newtech enterprises. The dependent variable is CLR in column 3 and column 4, non-debt tax shield regressioncoefficients are significantly negative, and the difference between the two coefficients is significant at the level of5%. It further support for the above conclusions, thus hypothesis 3 is established. Finally, the correspondingcontrol variables are consistent with the main regression results.208
International Journal of Business and Social ScienceVol. 7, No. 1; January 2016Table 6: Results of Regression arIndustrySampleAdj r2(1)ADRNon hi-tech-0.801***(-3.56)Prob(Difference) 6.27)-0.323***(-2.86)YESYES3,6210.321(3)CLRNon hi-tech-0.597***(-2.88)Prob(Difference) .42)-0.005(-0.04)YESYES3,6210.249note:***, **,* mean remarkable at the level of 1%,5% and 10% and brackets for T values.4.3 Robustness TestIn order to verify the robustness of the above conclusions, this paper also considers the endogenous nature of themodel. First, this paper takes the industrial mean as a tool variable of NDTS, and analyzes the regression of thedebt levels and non -debt tax shield. The results are shown in Table 7 that there is a negative correlation betweenthe non-debt tax shield and the level of corporate debt.Table 7 Robust test results of the industry mean instrumental ntYearIndustrySamplesAdj r2Basic ***(16.11)-0.105***(-3.44)YESYES10,1830.266Binary cluster YESYES10,18310,1830.3770.266note:***, **,* mean remarkable at the level of 1%, 5% and 10% and brackets for T values. Binary cluster,namely use Cluster2 to adjust the standard deviation in the company and the year.209
ISSN 2219-1933 (Print), 2219-6021 (Online) Center for Promoting Ideas, USAwww.ijbssnet.comSecondly, the paper uses the method of two stage least squares (2SLS) to reduce the endogenous nature of themodel. In the first stage, this paper uses government quality GR and government regulation policy uncertaintyEPU as tool variables for regression. In the second stage, it uses the tool variables which are from stage 1 assubstitute variables for OLS regression. The regression results are in line with the regression results in Table 4.Table 8 Regression Analysis Results of 2SLSVariables2SLSStage dustrySamplesAdj .342Stage *(14.10)-0.303***(-9.53)YESYES10,1830.2662SLSStage 830.325Stage 11.78)0.065**(2.17)YESYES10,1830.162Note:***, **,* mean remarkable at the level of 1%, 5% and 10% ,a
debt tax shield and the debt level is more significant in the high and new tech companies. 2. Methodology 2.1 Sample Selection and Data Sources The new accounting standards issued at February 15, 2006 began to implement from 2007, and the No.116 national tax policy and the enterprise income tax law come into effect at the beginning of 2008. .