Transcription
State of Washington2021 Population TrendsForecasting & Research DivisionOffice of Financial ManagementMarch 2022
To accommodate persons with disabilities, this document is available in alternative formats by calling the Office ofFinancial Management at 360-902-0401. TTY/TDD users should contact OFM viathe Washington Relay Service at 711 or 1-800-833-6388.This publication and other current and historical demographic data are available electronically.Visit our website at www.ofm.wa.gov.
Table of Contents1 Part 1. State, County and City Populations1Summary of population trends: overall1Figure 1: State population change and components of change2Figure 2: Driver’s licenses wurrendered to washington2Figure 3: Births, deaths and natural increase3Figure 4: Change in housing units3Summary of population trends: counties and cities4Figure 5: Percentage change in population by region6Figure 6: Distribution of population change by county7 Part 2. Data Tables7Table 1: Population and components of population change8Table 2: Population and components of population change by county: April 1, 2010, to April 1, 20209Table 3: Population and components of population change by county: April 1, 2020, to April 1, 202111Table 4: Populations of cities, towns and counties: April 1, 2020, to April 1, 202118Table 5: Federal corrections and OFM adjustments to Census 2010 Public Law 94-171 counts20Table 6: Rank of cities and towns by April 1, 2021, population size26Table 7: Alphabetical listing of cities and towns with April 1, 2021, population29Table 8: Housing units by structure type for cities, towns and counties: April 1, 2020, and April 1, 202137Table 9: Annexations, incorporations and other municipal boundary changes approved by OFM44Table 10: Population age 65 years and over by county45Table 11: Intercensal estimates of population by county: April 1, 2010, to April 1, 202046 Part 3. Supplemental Population Information46Washington State statutes related to the population estimates program46Population estimates development47Small area estimates program48Small area demographic estimates48Population data products49Washington State Data Center and Business and Industry Data Center50Acknowledgments
This page intentionally left blank.
Part 1State, county and city populationsPopulation trendsprovides demographic data for Washington counties, citiesand towns as of April 1, 2021. The Office of Financial Management developed the populationdeterminations in this document to represent the state’s official population figures. OFM hasannually prepared these figures for more than five decades. These estimates are cited in statutes thatuse population as criteria for fund allocation, program eligibility and whether a county is required toplan under the Growth Management Act.The state will use the 2021 population estimates for state agency programs and to allocate selectedstate revenues beginning January 2022 (RCW 36.13.100, 43.62.020, 43.62.030, 66.08.200 and66.08.210).Summary of population trends: OverallThe April 1, 2021, population estimate places Washington’s population at 7,766,9751. OFMestimated a population increase of 59,900 people (from births, deaths and net migration) from the2020 census adjusted base. The unadjusted population growth rate is 0.8%, the lowest since 2010during the Great Recession.As we expected, the COVID-19 crisis dramatically affected the 2021 estimates. The findings show adecrease in births, increase in deaths, a dramatic drop in migration and in the population who live ingroup quarters. Many of the group quarters changes were large enough to cause population decline,particularly in areas with college dorms. We expect some of these changes will be temporary, withpopulation rebounding once pandemic impacts subside.Despite a drop in migration due to COVID-19, migration continues to be the primary driverbehind population growth. From 2020 to 2021, net migration (people moving in minus peoplemoving out) to Washington totaled 42,100, which is down 22,300 people from the average of thepast decade. Net migration accounted for 70% of the state’s population growth, with naturalincrease (births minus deaths) responsible for the other 30%.1This total and the values in this document represent the November 30, 2021 rather than the June 30, 2021 release.The June 30 release did not fully account for the latest decennial census due to the late release of the Census 2020P.L. 171-94 Redistricting Data.1
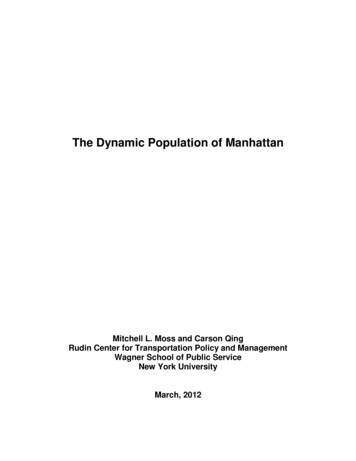
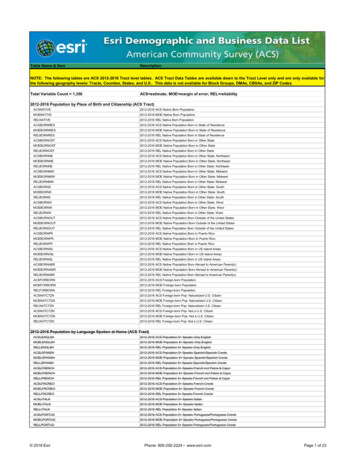
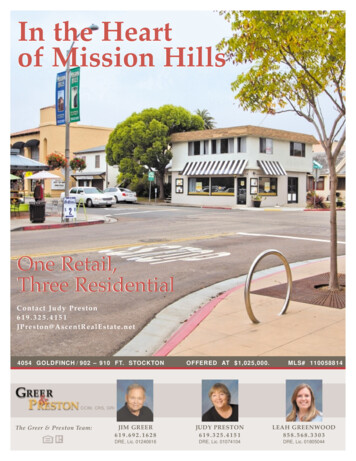
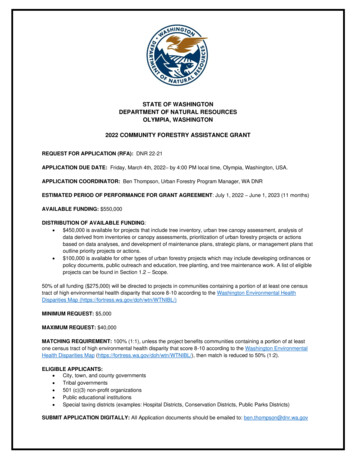
Figure 1. State population change and components of changePopulation Change160,000Natural Increase140,000Net 0,000198019851990199520002005201020152020We can use driver’s license data to provide trend information about migration flows betweenWashington and other states. Approximately 49% of in-movers to Washington last year came fromCalifornia, Oregon, Texas, Florida, and Arizona. The 12-month total of in-movers from these fivestates was 63,500, but this statistic is likely missing data due to underprocessing of out-of-statelicenses at Department of Licensing offices during the COVID-19 pandemic. The remaining statesaccounted for 46% of in-migrants, with 5% arriving from other countries.Figure 2. Driver’s licenses surrendered to xasRest of U.S.Outside of U.S.23.1%46.2%4.0%12.3%5.6%During the past year, 17,800 people were added to the state’s population due to natural increase,down 8,500 from the previous year. Due to lower fertility rates, births have declined even though we2
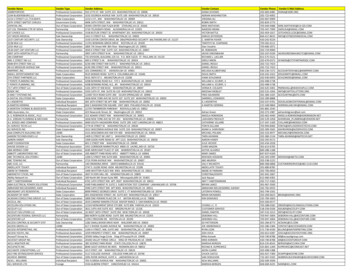
have more women of childbearing age. Deaths have increased as the population ages. We expectnatural increase, as a share of state total population growth, to gradually decline over time due toincreasing mortality. Last decade, population growth due to natural increase averaged 33,800 personsper year, or 34% of total population growth, while this year, natural increase is 30% of our totalpopulation growth.Figure 3. Births, deaths and natural 05Births2010Deaths20152020Natural IncreaseHousing, another indicator of population change, continued to strengthen in 2021. Housing growthin 2021 increased by 2.30% over the previous year. Washington added 46,500 housing units last year.This decade begins with an annual housing change that exceeds the previous decade average of31,500 housing units. Statewide, 58% of all new housing units in 2021 were associated withmultifamily structures.Figure 4. Change in housing 20052010320152020
Summary of population trends: counties and citiesPopulation growth remains concentrated in the five largest metropolitan counties. For theninth year in a row, more than 65% of state population growth occurred in the state’s five largestcounties: Clark, King, Pierce, Snohomish and Spokane. King County accounted for the largest shareof state growth this year, at 29%, followed by Snohomish at just over 16% and Pierce at almost12%. The state’s 20 nonmetropolitan counties2 accounted for 0.3% of population growth.We can use different county combinations to examine population change in more detail.For example, in 2021, Eastern Washington grew by 0.5% and Western Washington by 0.9%.Metropolitan counties grew 0.9% compared to nonmetropolitan counties, which grew 0.02%. Ruralcounties3, grew by 0.4% versus 0.9% for nonrural counties. Distressed area counties4, grew by 0.7%versus 0.8% for the remaining counties.2Nonmetropolitan counties are the counties that are not metropolitan using the Office of Management and Budget’sdefinition. Please see the following map for the current metropolitan a/us wall/Mar2020/CBSA WallMap Mar2020.pdf.3We use the rural definition described in RCW 82.14.370: population density of less than one hundred persons persquare mile or a county smaller than two hundred twenty-five square miles (meaning San Juan and Island counties).For counties meeting this rural definition please see: ssed area counties can be found on Washington State’s Employment Security Department’s website reas.4
Figure 5. Percentage change in population by region3.0%Western WashEastern 02005201020153.0%2020Rural 052010520152020
Figure 5. Percentage change in population by region (continued)3.0%DistressedNot 20152020The geographic distribution of population change by county can be seen in Figure 6. Clark was thefastest-growing county between 2020 and 2021, with 1.9% growth, followed by Grant and Franklinat 1.7%. In 2021, 13 counties experienced growth exceeding 1.0%, with 5 of these beingnonmetropolitan counties. The loss of student group quarters population is the primary contributingfactor leading to a decline in Kittitas, Walla Walla, Whatcom, and Whitman counties.Figure 6. Distribution of population change by county6
The population of incorporated places totaled 5,077,235 on April 1, 2021, an increase of 38,900people since last year. Most of the population growth in incorporated areas was due to naturalincrease and net migration rather than annexation. Of the total increase in incorporated areapopulation, only 900 was due to annexation.The total unincorporated area population increased by 21,000 persons over the previous year. Thefive most-populous unincorporated county areas (Pierce, Snohomish, King, Clark and Kitsap) havealmost as much population as the five largest cities in the state (Seattle, Spokane, Tacoma,Vancouver and Bellevue): 1.47 million versus 1.54 million.7
Part 2Data tablesTable 1. Population and components of population changeApril 1PopulationPopulationChangeNumber PercentageComponents of Change from Previous PeriodDeathsNaturalNet ber10-Year gle 755.44Notes: Rates are calculated per 1,000 midpoint population based on unrounded numbers.Totals may not add due to rounding.8
Table 2. Population and components of population change by county: April 1, 2010, to April 1, 2020Total Change: 2010 to 2020DeathsNaturalIncreaseNetMigrationRank -239781-1,2496,4314585,2662033,6942335243614Pend OreillePierceSan a 7291127307 5-68 Grays wisLincolnMasonOkanoganPacificCalculation:Notes:1 23 2-14 3/1*100Rankings based on unrounded numbers.956
Table 3. Population and components of population change by county: April 1, 2020 to April 1, 2021Total Change: 2020 to 2021PercentNaturalChangeBirthsDeaths IncreaseNetMigrationRank 6-122458-266,8892,5554022,5497992722128Walla -1038137861-381-628-3,41051137363926123 2-1 4 72642,10423,365Pend Oreille*Pierce*San ant*Grays HarborIsland*Calculation:Symbols:*Counties currently planning under the Growth Management Act.Notes: Totals may not add due to rounding.107 5-68 3-7
Table 4. Populations of cities, towns, and counties: April 1, 2020 to April 1, tedIncorporatedBenton CityKennewickProsserRichlandWest EntiatLeavenworthWenatchee79,141 32,50746,634 3,2484,2221,3262,26335,575 mUnincorporatedIncorporatedForksPort IncorporatedBattle GroundCamasLa CenterRidgefieldVancouverWashougalWoodland partYacolt503,311233,048 270,263 20,74326,0653,42410,325 48119CowlitzUnincorporatedIncorporatedCastle RockKalamaKelsoLongviewWoodland part110,73048,339 62,391 2,4462,960 IncorporatedCoulee CityCoulee Dam partElectric CityEphrataGeorgeGrand CouleeHartlineKruppMattawaMoses LakeQuincyRoyal CitySoap LakeWardenWilson 485205Grays ElmaHoquiamMcClearyMontesanoOakvilleOcean rporatedIncorporatedCoupevilleLangleyOak orporatedPort 10,220Douglas continuedBridgeportCoulee Dam partEast WenatcheeMansfieldRock orated2,023,409Algona3,290Auburn part77,243Beaux Arts317Bellevue151,854Black Diamond4,697Bothell part28,956Burien52,066Carnation2,158Clyde Hill3,126Covington20,777Des Moines32,888Duvall8,034Enumclaw12,543Federal Way101,030Hunts land92,175Lake Forest Park13,630Maple Valley28,013Medina2,915Mercer Island25,748Milton part1,640Newcastle13,017Normandy Park6,771North Bend7,461Pacific arrow ,125KitsapUnincorporatedIncorporatedBainbridge IslandBremertonPort 00KittitasUnincorporatedIncorporatedCle ElumEllensburgKittitasRoslynSouth Cle Elum46,468 20,56725,901 2,15720,797 leWhite 14949,46132,68882,70049,84032,860
Table 4. Populations of cities, towns, and counties: April 1, 2020 to April 1, 2021 1¹Lewis e ConconullyCoulee Dam partElmer ng BeachRaymondSouth 8157,6101,0851,7003,0751,750Pend eMetaline IncorporatedAuburn partBonney timate2021¹Pierce continuedEatonvilleEdgewoodEnumclaw partFifeFircrestGig HarborLakewoodMilton partOrtingPacific partPuyallupRoyRustonSouth PrairieSteilacoomSumnerTacomaUniversity 043,0608151,0603756,74510,700218,70035,100495San JuanUnincorporatedIncorporatedFriday lingtonConcreteHamiltonLa ConnerLymanMount tedNorth atedArlingtonBothell partBrierDarringtonEdmondsEverettGold BarGranite FallsIndexLake StevensLynnwoodMarysvilleMill CreekMonroeMountlake 815,175 2,613 2,613 ,42111,604 9,1482,456 965 ay HeightsCheneyDeer ParkFairfieldLatahLiberty LakeMedical LakeMillwoodRockfordSpangleSpokaneSpokane IncorporatedChewelahColvilleKettle 856149,93760053,52655,382 2,3691,87025,573 athlamet4,4223,8625605604,4753,915560560Walla WallaUnincorporatedIncorporatedCollege PlacePrescottWaitsburgWalla ooksackSumas226,84792,660 134,187 91,4825,8842,88815,04815,7491,4711,665 78240131213144,6005,88038,7205452,765400310135
Table 4. Populations of cities, towns, and counties: April 1, 2020 to April 1, 2021 1¹Whitman kesdale395Palouse1,015Pullman32,901Rosalia598St. 90600600810390Notes: Symbols:*# elahSunnysideTieton256,72888,147 168,581 10,910 108,23516,4001,430CountyMunicipalityYakima continuedToppenishUnion 45,038,2937,766,9752,689,7405,077,235The county and municipal populations shown for 2020 are, with a few exceptions, the 2020 federal census PL 94-174 counts. Some2020 counts may differ from the federal census. See Table 5 for more information.With the exception of corrections to federal census counts, annual estimates in this official series are not revised on the basis ofother information that becomes available after the estimate date.¹The 2021 estimates in this table were revised November 30, 2021 after the 2020 Census P.L. 94-171 became available. These2021 estimates supersede the estimates OFM released on June 30, 2021.State certified special censusInformal census. A population and housing count that is considered accurate but does not meet all special census certification.Informal count. A population count that is considered accurate but does not meet special census certification.Adjusted census 2020 population and housing. See Table 5 for more information.13
Table 5. Federal corrections and OIFM adjustments to Census 2020 Public Law 94-171 countsThe Office of Financial Management is responsible for April 1 population determinations that are used for state revenue allocations to local governments and inselected state programs requiring population as a criterion for funding and/or administration.Abbreviations: Occ. - Occupied, Vac. - Vacant, HH - Household, GQ - Group QuartersI. OFM Adjustments to Census 2020 Counts Due to Misallocation of Housing Units and/or Group QuartersMunicipalityEllensburgNorth BonnevilleWenatcheeTotalFederal Census 2020Housing hangeHousing UnitsPopulationTotal Occ. Vac.HHGQ -432671,766Adjusted Federal CensusHousing . OFM Adjustments to Census 2020 Counts Due to Annexation Activity from Jan. 2, 2020, through April 1, 2020MunicipalityFederal Census 2020Housing UnitsPopulationTotalOcc.Vac.HHGQFriday ousing UnitsPopulationTotal Occ. Vac.HH GQ 161000000031610III. OFM Certified April 1, 2020, Special City Census Counts Used in Place of Census 2020 CountsMunicipalitySumasTotalFederal Census 2020Housing 6361,5831,583001,5831,583Special City CensusHousing UnitsPopulationTotalOcc.Vac.HH usted Federal CensusHousing 2,96010,32526,808
Table 5. Federal corrections and OFM adjustments to Census 2020 Public Law 94-171 counts (continued)IV. Summary of Changes to 2020 Federal Census Counts Due to Federal Corrections, Annexations and Special City CensusesFederal Census 2020Housing helanWenatchee* (C)ChangeHousing UnitsPopulationTotal Occ. Vac.
The state's 20 nonmetropolitan counties2 accounted for 0.3% of population growth. We can use different county combinations to examine population change in more detail. . Metro Nonmetro 0.0% 0.5% 1.0% 1.5% 2.0% 2.5% 3.0% 1995 2000 2005 2010 2015 2020 Rural Counties Nonrural 5. Figure 5. Percentage change in population by region (continued)