Transcription
Equitable Growth Profile of theCity of Long BeachSupported by:
Equitable Growth Profile of the City of Long BeachSummaryDemographic shifts are occurring within the city of Long Beach. TheWhite population is now smaller, while the majority of the city’sresidents are now people of color from a variety of racial and ethnicbackgrounds. An examination of the quality of life for people of color andimmigrants in Long Beach reveals deep and persistent racial andeconomic inequities in employment, wages, education, health, housing,and transportation. The city’s prosperity hinges upon the well-being ofthis growing, diverse population, and it will take deliberate andintentional action to expand opportunities in Long Beach.In fact, closing racial gaps in income could have boosted the regionaleconomy (of which Long Beach is a critical part) by nearly 502 billion in2015. Recent efforts indicate that local leaders are committed to equity.These efforts include the creation of an Office of Equity within the cityand the Everyone In economic inclusion initiative. Through such efforts,local leaders can put all residents on the path toward reaching their fullpotential, and secure a bright economic future for all.PolicyLink and PERE2
Equitable Growth Profile of the City of Long BeachPolicyLink and PERE3IndicatorsDEMOGRAPHICSWho lives in the city and how is it changing?Can everyone access good jobs?Unemployment Rate by Race/Ethnicity, 2016Race/Ethnicity and Nativity, 2016Unemployment Rate by Race/Ethnicity and Gender, 2016People of Color by Census Tract, 1990 and 2016Unemployment Rate by Educational Attainment and Race/Ethnicity,Growth Rates of Major Racial/Ethnic Groups, 2000 to 2016Change in Population for Major Racial/Ethnic Groups, 2000 to 2016Racial/Ethnic Composition, 1980 to 2016Race/Ethnicity Dot Map by Census Tract, 1990 and 2016Racial Generation Gap: Percent People of Color (POC) by Age Group,1980 to 2016Median Age (in Years) by Race/Ethnicity, 2016Population Under 5 Years, by Census Tract, 2016Population 65 Years and Over, by Census Tract, 2016Immigrants 5 Years and Over: Speaks English Well/Very Well/Only, byRace/Ethnicity, 2000 and 20162016Can all workers earn a living wage?Median Hourly Wage by Educational Attainment and Race/Ethnicity,2016Are incomes increasing for all workers?Real Earned Income Growth for Full-Time Wage and Salary Workers,Ages 25-64, 2000 to 2016Median Hourly Wage by Race/Ethnicity, 2000 and 2016Is the middle class expanding?Household by Income Level, 1979 and 2016Is the middle class becoming more inclusive?Middle Class by Race/Ethnicity, 1979 and 2016ECONOMIC VITALITYIs economic growth creating more jobs?Average Annual Growth in Jobs and GDP, 1990 to 2007 and 2009 to2016Growth in Jobs and Earnings by Wage Level, 2000 to 2016Is inequality low and decreasing?Gini Coefficient, 1979 to 2016How is income distributed across age groups?Age of Householder by Income in the Past 12 Months
Equitable Growth Profile of the City of Long BeachPolicyLink and PERE4IndicatorsECONOMIC VITALITY (continued)READINESSIs poverty low and decreasing?Do all workers have the education and skills needed for the jobs of thePoverty Rate by Race/Ethnicity, 2000 and 2016Is working poverty low and decreasing?Working-Poverty Rate by Race/Ethnicity, 2000 and 2016Are all residents building wealth?Homeownership Rates by Race/Ethnicity, 2016Homeownership Rate by Ancestry for Asians or Pacific Islanders, 2016Do all residents have access to business opportunities?future?Share of Working-Age Population with an Associate’s Degree or Higherby Race/Ethnicity and Nativity, 2016, and Projected Share of Jobs thatRequire an Associate’s Degree or Higher, 2020Are all youth prepared for the future?3rd Graders in Long Beach Unified School District Proficient or Above inEnglish Language Arts and Math, 2016-17 School YearNumber of Firms per 100 Adults in the Labor Force, 2012Cohort Graduation Rate (4-Year Adjusted), 2016-17 School YearAverage Annual Receipts per Firm, 2012Graduates Meeting UC/CSU Requirements, 2016-17 School YearNumber of Small Businesses per 1,000 ResidentsSuspension Rates, 2016-17 School YearWhat are the region’s strongest industries?Strong Industries Analysis, 2006 to 2016Is economic growth creating more jobs?Employment by Industry for Major Racial/Ethnic Groups, 2016What are the region’s strongest occupations?Occupational Employment Projections, 2014 to 2024Are all youth ready to enter the workforce?Disconnected Youth: 16- to 24-Year-Olds Not in School or Working,1980 to 2016Do all households have access to technology?Household Internet Access by Income, 2017Do all residents have positive health outcomes?CalEnviroScreen Pollution Burden Percentile by Census Tract, 2018Life Expectancy at Birth, 2012Life Expectancy at Birth by Census Tract, 2010-2015Mortality Rate (Age Adjusted) per 100,000, 2014
Equitable Growth Profile of the City of Long BeachIndicatorsCONNECTEDNESSCan all residents access affordable housing?Median Market Rent (MMR), 2011-2015 Average by Census TractShare of Low-Wage Jobs and Share of Affordable Rental Housing, 2016Rent Burden by Race/Ethnicity and Gender, 2016Gentrification by Census Tract, 1990 to 2000 and 2000 to 2015Homeless Counts, 2013 to 2017Homeless Counts by Race/Ethnicity, 2013 to 2017Can all residents access transportation?Households Without a Vehicle by Race/Ethnicity, 2016Do neighborhoods reflect the region’s diversity?Residential Segregation, 1990 and 2016, Measured by the Dissimilarity IndexECONOMIC BENEFITS OF EQUITYHow much higher would GDP be without racial economic inequities?Actual GDP and Estimated GDP Without Racial Gaps in Income, 2015What are the economic benefits of inclusion?Income Gains by Race/Ethnicity, 2015Source of Gains in Income with Racial Equity by Race/Ethnicity, 2015PolicyLink and PERE5
Equitable Growth Profile of the City of Long BeachPolicyLink and PEREA Foreword from East Yard Communities for EnvironmentalJusticeLong Beach is home to a rich tapestry ofcultures and history that have been woventogether out of opportunity and tragedy—thecity is home to Tongva people who are theoriginal inhabitants of this land and still gounrecognized, the Japanese community whoinhabited Terminal Island until forced removaland internment during World War II, one ofthe largest Cambodian enclaves outside ofCambodia formed by refugees fleeing theKhmer Rouge, Filipinx immigrants and AfricanAmericans from the South who moved to findemployment at the now-closed Naval Base,and the large Latinx community who makesup the backbone of our service industry. It is avibrant and beautiful city that half a millionpeople call home, thanks to these workingclass and immigrant residents.From minimum-wage increases throughMeasure N, inclusion of the CommunityStability Toolkit in the Lower LA RiverRevitalization Plan, the Values Act to protectall those living in Long Beach, and youthsuccessfully moving the city to allocate 200,000 for the development of a strategicplan to establish a Long Beach Children andYouth Fund, community leaders have neverbeen afraid to take on the status quo to fightfor better living and working conditions. Wehope that this report serves as a reminder tothose of us struggling for an equitable worldthat when we fight together we take thenecessary steps to actualize a better societythat functions for all.Long Beach has evolved over many decades toform what we see now, and though thereexists a historic and continued practice ofdisplacement of marginalized peoples, it isthe power of the most disenfranchised thathas fueled progress for change in this city.Taylor ThomasResearch and Policy AnalystEast Yard Communities for EnvironmentalJustice6
Equitable Growth Profile of the City of Long BeachPolicyLink and PERE7AcknowledgmentsPolicyLink and the Program for Environmental andRegional Equity (PERE) at the University ofSouthern California are grateful to CitiCommunity Development for their generoussupport of this project. The equitable growthprofile of Long Beach, California, explores thelong-term demographic and economic trends ofthe city and dozens of equity indicatorsdisaggregated by race and ethnicity as well asgender, nativity, education, and income, andfocuses on barriers as well as opportunities tofoster inclusion. The profile is designed to be aresource for all seeking to enhance prosperity foreveryone in Long Beach, including advocacygroups, government agencies, elected officials,funders, business and civic leaders, and more. Thesummary report that accompanies this profilehighlights leading indicators and offers policyrecommendations.helped with formatting and design. The summarywas written by Mary Lee at PolicyLink with editingassistance from Kim Tabari at PERE.The profile was written by Jamila Henderson atPolicyLink; the data, charts, and maps wereprepared by Justin Scoggins at PERE, JamilaHenderson at PolicyLink, and Sabrina Kim atPERE; and Sarah Treuhaft at PolicyLink assistedwith editing while Rosamaria Carrillo at PolicyLinkAdvancement Project CaliforniaCal State Long BeachEarly Childhood Education-City Health DepartmentEast Yard Communities for Environmental JusticeEconomic & Policy Impact CenterHousing Long BeachIn addition to the data analysis contained in theprofile, the summary report draws upon insightsthat were shared during more than 20 interviewsconducted with local community leaders andresidents. Their comments helped shape the policyrecommendations included in the summary.While the profile and summary do not exhaustivelyaddress every challenge facing Long Beach, norevery asset available in the region, our hope is thatthese products can help guide efforts to build anequitable and inclusive city. We would like to give aspecial thanks to the following groups thatparticipated in interviews, attended meetings, orprovided feedback on the profile and summary:Human Relations CommissionKhmer Girls in ActionLatinos in ActionLegal Aid Foundation of Los AngelesLocal Initiatives Support Corporation, Los AngelesLong Beach City CollegeLong Beach City Council, District 1Long Beach City Council, District 5Long Beach City Council, District 9Long Beach Community Action PartnershipLong Beach Development Services DepartmentLong Beach ForwardLong Beach Gray PanthersLong Beach Grocery Co-opLong Beach Immigrant Rights CoalitionLong Beach Office of EquityLong Beach Residents EmpoweredPeer Health ExchangePower 4 YouthRestore I.N.K.The California EndowmentThe LGBTQ Center Long BeachUnited Cambodian Community
Equitable Growth Profile of the City of Long BeachIntroductionPolicyLink and PERE8
Equitable Growth Profile of the City of Long BeachPolicyLink and PERE9IntroductionOverviewEquity – ensuring full inclusion of the entirecity’s residents in the economic, social, andpolitical life of the city, regardless ofrace/ethnicity, nativity, age, gender, sexualorientation, neighborhood of residence, orother characteristics – is an essential elementto achieving economic inclusion.Knowing how a city stands in terms of equityis a critical first step in achieving economicinclusion. To assist communities with thatprocess, PolicyLink and the Program forEnvironmental and Regional Equity (PERE)developed a framework to understand andtrack how cities perform on a series ofindicators of equitable growth.This profile was developed to help the cityof Long Beach and community partnersplan for equitable growth. In the course ofdrafting this profile, input was sought from across-section of Long Beach stakeholderswho reflected on the city’s challenges andopportunities for overcoming them.Community residents, activists, advocates,elected officials, and civic leaders all sharedtheir insights and ideas. We hope that it isbroadly used by advocacy groups, electedofficials, planners, business leaders, funders,and others working to build a stronger andmore equitable city.Long-Standing Barriers to Opportunity inLong BeachEnsuring that policies and systems serve toincrease inclusion and remove barriers isparticularly important given the history ofcity and regional development in the UnitedStates. Regions and cities are highlysegregated by race and income. According toa 2009 analysis, this is particularly true in theLos Angeles metro area, which includes LongBeach. Out of the 100 largest U.S. metroareas, the Los Angeles metro area ranked inthe top 15 on measures of segregationbetween Whites and Blacks and Whites andLatinx residents.1 Today’s cities arepatchworks of concentrated advantage anddisadvantage, with some neighborhoodshome to good schools, bustling commercialdistricts, services, parks, and other crucialingredients for economic success, while otherneighborhoods provide few of thoseelements.As a result of historical government policiesand practices, some neighborhoods havephysical conditions that promote positivehealth outcomes, while others may makeresidents sick. For example, exposure to toxicand environmental hazards is greater forpeople of color than their White counterparts.Long Beach has some of the worst airpollution in the nation, caused in large part bythe very industries and land uses that spurredthe city’s economy decades ago. Dieselexhaust from trucks, ships, and trains alsopose extreme health hazards, and oil refininghas compromised water quality. Exposure totoxins is compounded by the fact thathousing for low-income residents and peopleof color is typically adjacent to theseproblematic usage areas.These historic patterns of inequity andexclusion were often created and maintainedby public policies at the federal, state,
Equitable Growth Profile of the City of Long BeachPolicyLink and PERE10IntroductionOverview(continued)regional, and local levels. From redlining toexclusionary zoning practices and more,government policies have fostered racialinequities in health, wealth, andopportunity. Reversing the trends andshifting to a more inclusive city requiresdismantling barriers and enacting proactivepolicies that expand opportunity. Equitycan be achieved through policy and systemschanges that remove barriers and buildopportunity. Equity addresses bothstructural drivers, like the inequitabledistribution of power and opportunity, andthe environments of everyday life – wherepeople are born, live, learn, work, play,worship, and age.2About the DataThe data presented here are drawn from aregional equity database that covers thelargest 100 cities and largest 150 regions inthe United States. This databaseincorporates hundreds of data points frompublic and private data sources includingthe U.S. Census Bureau, the U.S. Bureauof Labor Statistics, the Behavioral Risk FactorSurveillance System (BRFSS), and theIntegrated Public Use Microdata Series(IPUMS). See the “Data and methods” sectionfor a more detailed list of data sources.Note that while we disaggregate mostindicators by major racial/ethnic groups (i.e.,White, Black, Latinx, Asian or Pacific Islander,and Mixed/other), figures for the Asian orPacific Islander and Latinx populations as awhole often mask a wide variation ineducational and economic indicators. Pleasenote that we use Latinx as the gender-neutralalternative to Latino and Latina, and have useda similar approach for Filipino/a. There is oftentoo little data to break out indicators for theNative American population. Each of theracial/ethnic groups mentioned above ismutually exclusive (unless noted otherwise).Mixed/other refers to all people (not ofHispanic origin) who identity as two or moreraces (“Mixed race”) or who identify as a singlerace other than those listed above (“Other”).In some instances, we disaggregate the data byrace/ethnicity and gender (or another breakdownin addition to race/ethnicity). At times we reporton people of color (POC), which includes allracial/ethnic groups who do not identify as nonHispanic White. There is no perfect model forclassifying individuals by race/ethnicity. Race is asocial construct, not a biological one, and anequitable society would not have majordifferences across racial groups. See the “Dataand methods" section for more details onracial /ethnic origin.We recognize that inequities exist across manycharacteristics in addition to race/ethnicity andnativity, including income, gender, age, ability,sexual orientation, and neighborhood.Unfortunately, because we are working withsurvey data and seek to provide data for cities,we are limited in the extent to which we candisaggregate the data.1 Michigan Population Studies Center, Race Segregation for 100 Largest MetroAreas (2018), on.html.2Rachel Davis, Diana Rivera, and Lisa Fujie Parks, Moving fromUnderstanding to Action on Health Equity: Social Determinants of Health Frameworksand THRIVE (Oakland, CA: The Prevention Institute, y-social-determinants-healthframeworks-and.
Equitable Growth Profile of the City of Long BeachPolicyLink and PEREIntroductionWhat is an equitable city?Cities are equitable when all residents – regardless ofrace/ethnicity, nativity, neighborhood, age, gender, sexualorientation, or other characteristics – can fully participate inthe city’s economic vitality, contribute to its readiness for thefuture, and connect to its assets and resources.Strong, equitable cities: Possess economic vitality, providing highquality jobs to their residents and producingnew ideas, products, businesses, andeconomic activity so the city remainssustainable and competitive. Are ready for the future, with a skilled,ready workforce, and a healthy population. Are places of connection, where residentscan access the essential ingredients to livehealthy and productive lives in their ownneighborhoods, reach opportunities locatedthroughout the city (and beyond) viatransportation or technology, participate inpolitical processes, and interact with otherdiverse residents.11
Equitable Growth Profile of the City of Long BeachPolicyLink and PERE12IntroductionWhy equity matters nowThe face of America is changing.Our country’s population is rapidlydiversifying. Already, more than half of allbabies born in the United States are people ofcolor. By 2030, the majority of young workerswill be people of color. And by 2044, theUnited States will be a majority people-ofcolor nation.Yet racial and income inequality is high andpersistent.Over the past several decades, long-standinginequities in income, wealth, health, andopportunity have reached unprecedentedlevels. Wages have stagnated for the majorityof workers, inequality has skyrocketed, andmany people of color face racial andgeographic barriers to accessing economicopportunities.Racial and economic equity is necessary foreconomic growth and prosperity.Equity is an economic imperative as well as amoral one. Research shows that inclusion anddiversity are win-win propositions for nations,regions, communities, and firms.For example: More equitable regions experience stronger,more sustained growth.1 Regions with less segregation (by race andincome) and lower income inequality havemore upward mobility.2 The elimination of health disparities wouldlead to significant economic benefits fromreductions in health-care spending andincreased productivity.3 Companies with a diverse workforce achievea better bottom line.4 A diverse population more easily connectsto global markets.5 Less economic inequality results in betterhealth outcomes for everyone.6Cities play a critical role in shifting toinclusive growth.Local communities are where strategies arebeing incubated to foster equitable growth:growing good jobs and new businesses whileensuring that all – including low-incomepeople and people of color – can fullyparticipate as workers, consumers,entrepreneurs, innovators, and leaders.1Manuel Pastor, “Cohesion and Competitiveness: Business Leadership forRegional Growth and Social Equity,” OECD Territorial Reviews, CompetitiveCities in the Global Economy, Organisation For Economic Co-Operation AndDevelopment (OECD), 2006; Manuel Pastor and Chris Benner, “Been Down SoLong: Weak-Market Cities and Regional Equity” in Retooling for Growth:Building a 21st Century Economy in America’s Older Industrial Areas (New York:American Assembly and Columbia University, 2008); Randall Eberts, GeorgeErickcek, and Jack Kleinhenz, “Dashboard Indicators for the Northeast OhioEconomy: Prepared for the Fund for Our Economic Future” (Cleveland, OH:Federal Reserve Bank of Cleveland, ors-for-the-northeast-ohio-economy.aspx.2 RajThe way forward is with an equity-drivengrowth model.To secure America’s health and prosperity, thenation must implement a new economicmodel based on equity, fairness, andopportunity. Leaders across all sectors mustremove barriers to full participation, connectmore people to opportunity, and invest inhuman potential.Chetty, Nathaniel Hendren, Patrick Kline, and Emmanuel Saez, “Where isthe Land of Economic Opportunity? The Geography of IntergenerationalMobility in the U.S.,” Quarterly Journal of Economics 129 (2014): ssets/documents/mobility geo.pdf.3Darrell Gaskin, Thomas LaVeist, and Patrick Richard, The State of UrbanHealth: Eliminating Health Disparities to Save Lives and Cut Costs (New York, NY:National Urban League Policy Institute, 2012).4Cedric Herring, “Does Diversity Pay? Race, Gender, and the Business Case forDiversity,” American Sociological Review 74 (2009): 208-22; Slater, Weigandand Zwirlein, “The Business Case for Commitment to Diversity,” BusinessHorizons 51 (2008): 201-209.5 U.S.Census Bureau, “Ownership Characteristics of Classifiable U.S. ExportingFirms: 2007,” Survey of Business Owners Special Report, June 2012.6Kate Pickett and Richard Wilkinson, “Income Inequality and Health: A CausalReview,” Social Science & Medicine 128 (2015): 316-326.
Equitable Growth Profile of the City of Long BeachPolicyLink and PEREIntroductionEquity indicators frameworkThe indicators in this profile are presented in five sections. The first section describes the city’sdemographics. The next three sections present indicators of the city’s economic vitality,readiness, and connectedness. The final section explores the economic benefits of equity. Beloware the questions answered within each of the five sections.Demographics:Who lives in the city, and how is thischanging? Is the population growing? Which groups are driving growth? How diverse is the population? How does the racial/ethnic compositionvary by age?Economic vitality:How is the city doing on measures ofeconomic growth and well-being? Is the region producing good jobs? Can all residents access good jobs? Is growth widely shared? Do all residents have enough income tosustain their families? Are race/ethnicity and nativity barriers toeconomic success? What are the strongest industries andoccupations?Readiness:How prepared are the city’s residents for the21st century economy? Does the workforce have the skills for thejobs of the future? Are all youth ready to enter the workforce? Are residents healthy? Do they live inhealth-promoting environments? Are health disparities decreasing? Are racial gaps in education decreasing?Connectedness:Are the city’s residents and neighborhoodsconnected to one another and to the region’sassets and opportunities? Do residents have transportation choices? Can residents access jobs and opportunitieslocated throughout the region? Can all residents access affordable, quality,convenient housing? Do neighborhoods reflect the city’sdiversity? Is segregation decreasing?Economic benefits of equity:What are the benefits of racial economicinclusion to the broader economy? What are the projected economic gains ofracial equity? Do these gains come from closing racialwage or employment gaps?13
Equitable Growth Profile of the City of Long BeachIntroductionGeographyThis profile describes demographic, economic,and health conditions in the city of LongBeach, California, portrayed in black on theadjacent map. Long Beach is located in thesouthern part of Los Angeles County, adjacentto Orange County. Long Beach is also situatedin the Los Angeles metropolitan statisticalarea, which includes Los Angeles and Orangecounties.Unless otherwise noted, all data follow thecity geography. Some exceptions, due to lackof data availability, will be noted. Informationon data sources and methodology can befound in the “Data and methods” section.PolicyLink and PERE14
Equitable Growth Profile of the City of Long BeachDemographicsPolicyLink and PERE15
Equitable Growth Profile of the City of Long BeachPolicyLink and PERE16DemographicsSummaryWho lives in the city and how is this changing?The city of Long Beach is diverse, with nearly threequarters of the city’s residents people of color. TheLatinx population is driving growth, followed by Asiansor Pacific Islanders, and those of Mixed race. Immigrantscomprise about one-quarter of the city's population.Youth are largely people of color (86 percent) while onlyabout half of seniors are people of color (47 percent).This difference in the proportion of youth and seniors ofcolor is important, as a large gap (racial generation gap)corresponds with lower investments in educationalsystems and infrastructure to support youth.1 This 39percentage-point racial generation gap has improvedhowever, declining 5 percentage points since 2000.1JulienLafortune, Jesse Rothstein, and Diane Whitmore Schanzenbach, “School Finance Reform and the Distribution ofStudent Achievement,” IRLE Working Paper No. 100-16 (Berkeley, CA: Institute for Research on Labor and Employment,2016), Share of the populationmade up of people of color:72%Growth in the Latinxpopulation since 2000:21%Racial generation gap:39percentagepoints
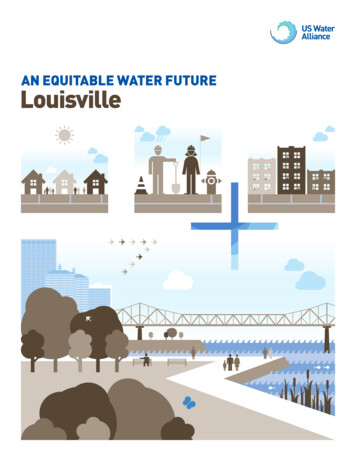
Equitable Growth Profile of the City of Long BeachPolicyLink and PERE17DemographicsWho lives in the city and how is it changing?The city of Long Beach is diverse, with nearly three-quartersof the city’s residents people of color. The Latinx population isthe largest racial/ethnic group (42 percent of the city’spopulation) followed by Whites (28 percent). Immigrants, largelyLatinx and Asian or Pacific Islander, are about one-quarter of thecity’s population.Race/Ethnicity and Nativity,20168%0.4% 3%26%6%2%16%12%Source: Integrated Public Use Microdata Series.Note: Data represents a 2012 through 2016 average.0.4%27%
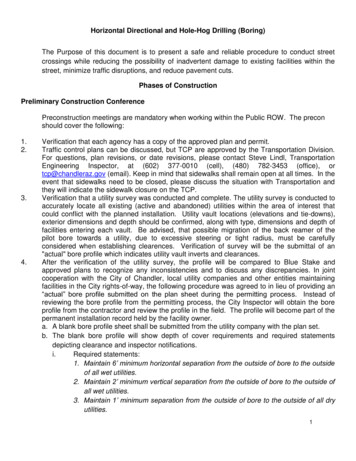
Equitable Growth Profile of the City of Long BeachPolicyLink and PERE18DemographicsWho lives in the city and how is it changing?Most neighborhoods in Long Beach are majority people ofcolor. This is a change since 1990, when there were far moreneighborhoods where only about one in 10 residents werepeople of color.People of Color by CensusTract, 1990 and 20161990Sources: U.S. Census Bureau, GeoLytics, Inc.Note: Data for 2016 represents a 2012 through 2016 average. The gray area in the center of the map corresponds to the cityof Signal Hill and is excluded from this analysis.2016
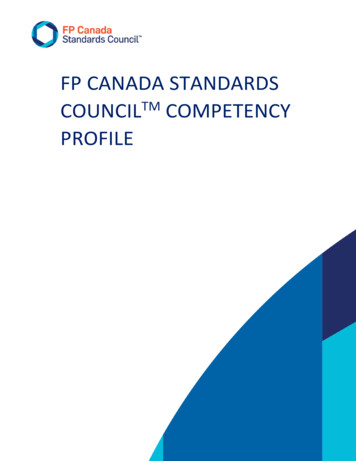
Equitable Growth Profile of the City of Long BeachPolicyLink and PERE19DemographicsWho lives in the city and how is it changing?The Latinx population, Asians or Pacific Islanders, and thosewho identify as Mixed race had the fastest populationgrowth since 2000. Whites, Blacks, and Native Americans andAlaska Natives experienced population decline between 2000and 2016.Growth Rates of MajorRacial/Ethnic Groups,2000 to 2016All2%White-15%-12%BlackLatinx21%Asian or Pacific IslanderNative American and Alaska Native-12%Mixed/otherSource: U.S. Census Bureau.Note: Data for 2016 represents a 2012 through 2016 average.7%7%
Equitable Growth Profile of the City of Long BeachPolicyLink and PERE20DemographicsWho lives in the city and how is it changing?The Latinx population grew by 34,000 since 2000, while theAsian or Pacific Islander and Mixed-race populations grew by3,900 and 970, respectively. The White populationexperienced the largest decline, decreasing by 22,700 since2000.Change in Population forMajor Racial/Ethnic Groups,2000 to ce: U.S. Census Bureau.Note: Data for 2016 represents a 2012 through 2016 average.LatinxAsian orPacificIslander966Native Mixed/otherAmerican-213
Equitable Growth Profile of the City of Long BeachPolicyLink and PERE21DemographicsWho lives in the city and how is it changing?Long Beach became a majority people-of-color city severaldecades ago. While Whites declined as a share of the populationsince 1980, the Black population share remained relativelystable. The Latinx and Asian or Pacific Islander share grewsubstantially since 1980.Racial/Ethnic Composition,1980 to 28%20002010201624%36%13%14%68%50%1980Source: U.S. Census Bureau.Note: Data for 2016 represents a 2012 through 2016 average.1990
Equitable Growth Profile of the City of Long BeachPolicyLink and PERE22DemographicsWho lives in the city and how is it changing?People of color have fueled population growth over the lastfew decades. There are higher concentrations of the Latinxpopulation in the north and southwest parts of the citycompared to 1990.Race/Ethnicity Dot Map byCensus Tract, 1990 and 20161990Source: U.S. Census Bureau, GeoLytics, Inc.Note: Data for 2016 represents a 2012 through 2016 average. The gray area in the center of the map corresponds to the cityof Signal Hill and is excluded from this analysis.2016
Equitable Growth Profile of the City of Long BeachPolicyLink and PERE23DemographicsWho lives in the city and how is it changing?The racial generation gap in the city is shrinking. Today, 86percent of the city’s youth are people of color, comparedwith 47 percent of seniors. The
immigrants in Long Beach reveals deep and persistent racial and economic inequities in employment, wages, education, health, housing, and transportation. The city's prosperity hinges upon the well-being of this growing, diverse population, and it will take deliberate and intentional action to expand opportunities in Long Beach.