Transcription
Downloaded from orbit.dtu.dk on: Jun 15, 2022Streamlining Smart Meter Data AnalyticsLiu, Xiufeng; Nielsen, Per SievertsPublished in:Proceedings of the 10th Conference on Sustainable Development of Energy, Water and Environment SystemsPublication date:2015Document VersionPublisher's PDF, also known as Version of recordLink back to DTU OrbitCitation (APA):Liu, X., & Nielsen, P. S. (2015). Streamlining Smart Meter Data Analytics. In Proceedings of the 10th Conferenceon Sustainable Development of Energy, Water and Environment Systems International Centre for SustainableDevelopment of Energy, Water and Environment Systems.General rightsCopyright and moral rights for the publications made accessible in the public portal are retained by the authors and/or other copyrightowners and it is a condition of accessing publications that users recognise and abide by the legal requirements associated with these rights. Users may download and print one copy of any publication from the public portal for the purpose of private study or research. You may not further distribute the material or use it for any profit-making activity or commercial gain You may freely distribute the URL identifying the publication in the public portalIf you believe that this document breaches copyright please contact us providing details, and we will remove access to the work immediatelyand investigate your claim.
Streamlining Smart Meter Data AnalyticsXiufeng Liu and Per Sieverts NielsenTechnical University of Denmark{xiuli, pernn}@dtu.dkAbstract. Today smart meters are increasingly used in worldwide. Smart meters are the advanced meters capable of measuring customer energy consumption at a fine-grained time interval, e.g., every 15 minutes. Thedata are very sizable, and might be from different sources, along with the other social-economic metrics such asthe geographic information of meters, the information about users and their property, geographic location andothers, which make the data management very complex. On the other hand, data-mining and the emerging cloudcomputing technologies make the collection, management, and analysis of the so-called big data possible. Thiscan improve energy management, e.g., help utilities improve the management of energy and services, and helpcustomers save money. As this regard, the paper focuses on building an innovative software solution to streamline smart meter data analytic, aiming at dealing with the complexity of data processing and data analytics.The system offers an information integration pipeline to ingest smart meter data; scalable data processing andanalytic platform for pre-processing and mining big smart meter data sets; and a web-based portal for visualizing data analytics results. The system incorporates hybrid technologies, including big data technologies Sparkand Hive, the high performance RDBMS PostgreSQL with the in-database machine learning toolkit, MADlib,which are able to satisfy a variety of requirements in smart meter data analytics.Keywords: Streamline, Software Platform, Smart meter data, Data Analytics1INTRODUCTIONToday smart meters are increasingly used in worldwide for the ability of providing timely reading, automating metering without customer promises, producing fine-grained data, and more.Smart meters collect energy consumption data at a time interval, usually every 15 minutes orhourly. Smart meter data analytics system is an ICT-based platform for analyzing the collectedmeter readings, which nowadays has become an indispensable part for utilities running smartgrid. Smart meter data analytics can help utilities better understand customer consumption patterns, provision energy supply to peak demand, detect energy theft, and provide personalizedfeedback to customers. Also, government can make the decision for future smart grid development based on analytic results. For customers, smart meter data analytics can help them betterunderstand their own energy consumption, save energy, and reduce their bills. Smart meter analytics thus is seen so important that the market has been growing rapidly, which is expectedto reach over four billion dollar by year 2020 [19]. Various algorithms for smart meter dataanalytics have been proposed, mainly in the smart grid literature, such as the ones for electricity consumption prediction, consumption profile extractions, clustering similar consumers,and personalized feedback to consumers on how to adjust their habits and reduce their bills.Nevertheless, there has been lacking smart meter analytics applications in reality until in therecent that some database vendors starts to offer smart meter analytics software, e.g., SAP andOracle/Data Raker. So did several startups in this area, e.g., C3Energy.com and OPower.com.Furthermore, some utilities such as California’s PG&E4 also start to provide on-line portalswhere customers can view their electricity consumption and compare it with their neighbourhood’s average. However, these systems and tools focus on simple aggregation and simple waysof visualizing consumption. The details of their implementations are not disclosed. It is unclearon how to build a practical and scalable analytics system to handling smart meter data, whichare characterized by big volume and big velocity.In this paper we present a software platform for streamlining smart meter data analytics. Thisplatform is built based on our benchmark work for smart meter data analytics technologies [30],
and extended from our prototype smart meter data analytics system, SMAS [29]. This platformaims at providing a solution for facilitating the whole process of smart meter data analytics,including data ingestion, data transformation, loading, analyzing, and visualization. Utilities orcustomers can get the final information through these stages. We adopt a hybrid architecture inthe system design, in which the primary building blocks consist of Spark and Hive in the dataprocessing layer, and PostgreSQL with MADlib [18] in the analytics layer. The design considers the support for high performance analytics queries, i.e., through RDBMS, and the supportfor big data analytics, i.e., through Spark and Hive. We decouple the system architecture intothree layers, including data ingestion layer, processing layer, and analytics layer, which make iteasy for users’ implementation and extension. Smart meter data goes through the three layersfrom data sources to be presented in a web portal. The processing layer is an open platform thatcan integrate various user-defined processing units, such as the units for data transformation,data anonymization, and anormal data detection. While, the analytics layer is also open to theextension of different analytics algorithms. The analytics layer currently supports multiple typesof algorithms, including time-series analytics at different temporal aggregations (e.g., hourly,daily, or weekly), load dis-aggregation, consumption pattern discovery, segmentation, forecasting and consumer feedback. Consequently, in this paper we make the following contributions:1) we propose a hybrid architecture of combining the best of different technologies for streamlining smart meter data analytics; 2) we implement the open data platform that can be easilyextended by using different data processing units and analtyics algorithms; and 3) we implement smart meter data analytics system of supporting both supply- and demand-side analytics,which can help utilities better to manage energy supply and help consumers save energy.The rest of this paper is structured as follows. Section 2 summarizes the related work; Section 3 presents the design principles of the system; Section 4 gives an overview of the system;Section 5 and 6 present data processing layer and analytics layer of the system, respectively;Section 7 concludes the paper with directions for future work.2RELATED WORKSystems and Platforms for Smart Meter Data Analytics. The traditional technologies, such as R(S-PLUS), Matlab, SAS, SPSS and Stata, which support numeric computing and comprehensive statistical analysis can be used in smart meter data analytics. The recent trend of analyticstechnologies is to support in-memory, in-database, and in parallel on a cluster. Main-memorybased systems, such as KDB [16] and SAP HANA [13], and the in-database machine learningtoolkit, e.g., PostgreSQL/MADlib [18] are the good options to smart meter analytics. Paralleldistributed platforms such as Hive (built on top of Hadoop) or Spark are the two distinct distributed computing frameworks that are able to handle big data analytics in a cluster. In thispaper, we implemented our system with a hybrid architecture of using Hive, Spark and PostgreSQL/MADlib. The system combines the best of each technology, which is able to do dataanalytics in-database, in-memory and in parallel.The systems or prototypes for smart meter data analytics emerge in both industry andacademia. The industry companies that we mentioned in Section 1 developed smart meter analytic software, but the implementation of the systems and analytics algorithms used are unclear,which may be due to the license issue. Nezhad et al. developed a smart meter dashboard in theirresearch work, called SmartD [20], which is orthogonal to the work of the analytics layer ofour system, but ours provides more comprehensive functionalities, and the whole software architecture is the complete solution of supporting data ingestion, transformation, analyzing andvisualization. Liu et al. use analytic procedures in Hive to process smart grid data on cloud stor-
age, and use an RDBMS to cope with daily data management transactions on the informationof meter devices, users, organizations, etc [31]. This is somewhat similar to our architecture,but our main focus is to streamline the whole process of smart meter analytics by taking advantage of different technologies. Furthermore, our platform is open to the extension of addingmore data processing units and algorithms. Besides, the work [31] primarily studies how to efficiently retrieve smart meter data from Hive, and focuses on simple operational queries ratherthan the deep analytics that we address in our system. Beyond electricity sector, smart meteranalytics systems and applications were also developed in the water sector, e.g., WBKMS [25],a web-based application for providing real-time information of water consumption; and Autoflow [21], a tool for categorising residential water consumption. We are currently developingwater data analytics algorithms, which will be integrated into the analytics layer of our system.These existing works provide useful information to our implementation.Benchmarking Smart Meter Data Analytics. Arlitt et al. implements a toolkit, called IoTAbench, to benchmark the analytics algorithms of Internet of Thing (IoT). They use synthetic electricity data, and evaluates six queries for smart meter data analytics algorithms on HP Verticacluster platform. Benchmarking time series data mining is also discussed in [17], where different implementations of time series similarity search, clustering, classification and segmentationwere evaluated. Anil benchmarks data mining operations for power system analysis [5], whichanalyzes voltage measurements from power transmission lines. However, all of these worksonly focus on benchmarking analytics algorithms. In our previous work [30], we benchmarkfour representative analytics algorithms for smart meter data, as well as five technologies withdifferent categories, including Matlab, KDB, PostgreSQL/MADlib, Spark and Hive. They represent the technologies of the traditional (Matlab), in-memory (KDB and Spark), in-database(PostgreSQL/MADlib), in-memory distributed (Spark) and Hadoop based (Hive). The work isthe foundation to implement this system, i.e., providing the reference of choosing the technologies.Smart Meter Data Analytics Algorithms. Two broad applications of smart meter data analytics are widely studied, which are consumer and producer-oriented. Consumer-oriented applications aim to provide feedback to end-users on reducing electricity consumption and savingmoney (see, e.g., [10, 19, 23]). Producer-oriented applications are for utilities, system operatorsand governments, which provide information of consumers, such as their daily habits for thepurposes of load forecasting and clustering/segmentation (see, e.g., [1, 2, 4, 7, 11, 12, 14, 15, 19,20]). From a technical standpoint, both of the above classes of applications perform two typesof operations: extracting representative features (see, e.g., [7, 10, 12, 14]) and finding similarconsumers based on the extracted features (see, e.g., [1, 11, 23, 24, 27]). Household electricity consumption can be broadly decomposed into the temperature-sensitive component (i.e.,the heating and cooling load) and the temperature-insensitive component (other appliances).Thus, representative features include those which measure the effect of outdoor temperature onconsumption [3, 10, 23] and those which identify consumers’ daily habits regardless of temperature [1, 7, 12], as well as those which measure the overall variability (e.g., consumptionhistograms) [2]. Some of the above existing algorithms have been integrated into our system,as well as new implemented algorithms, which are used to study variability of consumption,load profiling, load segmentation, pattern discovery, load dis-aggregation, and load similarity toother consumers.3DESIGN PRINCIPLESWe now describe the high-level design principles for this smart meter data analytics system.
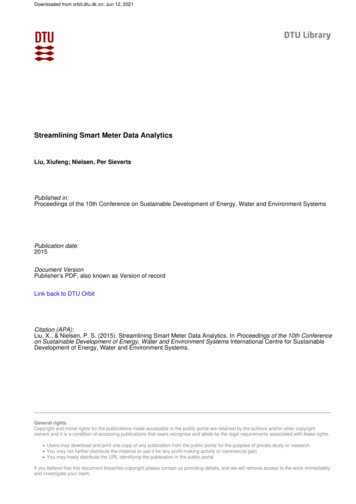
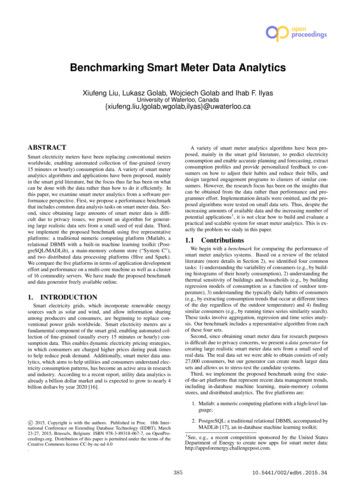
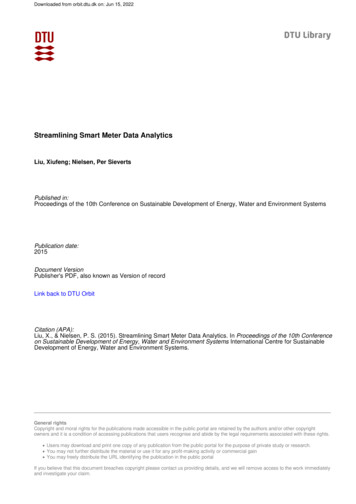
Scalability. The system will be able to deal with fast-increasing volume of smart meterdata, with at a high frequency, e.g., 15 minutes, 30 minutes or hourly. It may adopt the current technologies such as MapReduce to scale big data analytics. Data mining and machinelearning algorithms thus have to be transformed as MapReduce programs to be parallelizedin a cluster environment. The system should be capable of running at both batch and streammode to cater for real-time data streams and big data sets. Efficiency. The system will support low latency queries, and better service quality by givingusers great browsing and analysis experience. To enable this, in-memory based databases,high performance NoSQL databases (with trading off consistency for availability, faulttolerance and performance), or traditional relational database management systems withtheir support low latency queries will be exploited. The selected data storage system shouldbe able to support common operations over time series data such as temporal range queries. Availability. In order to capture near real time data and provide data service and analytics,the system must be highly available. To enable this, this system should support running thea cluster environment, e.g., a private or public cloud, which offer fault tolerance as a serviceto the system which requires reliability and availability. Realtime and batch data ingestion. The system will implement two data ingestion mechanisms, realtime and batch data ingestion. Real-time data ingestion will integrate the datastream into the system directly from smart meters, which will provide near realtime analytics results to customers, while batch ingestion will be used to the scenarios that data needsto be handled in bulk mode, e.g., the data uploaded by users, or data from legacy systems. Solution. The system will provide a complete solution to smart meter data analytics, whichincludes data ingestion, transformation, loading, data analytics and visualization. The system will aim at streamlining smart meter data analytics, and supporting big data.4SYSTEM OVERVIEWAccording to the design principle in the above section, we design a smart meter analytic systemwith the architecture shown in Fig. 1. The architecture is divided into three layers, data ingestionlayer, processing layer and analytics layer. Each layer represents a separate functional systemto meet the overall requirement of streamlining smart meter data analytics. The left-most is thedata ingestion layer which consists of integrating real-time data stream from smart meters, andthe data from heterogeneous repositories in bulk mode. The objective of this layer is to acquirethe data from data sources, which are delivered to the processing layer for any necessary datacleansing or transformations.The middle in the architecture is the processing layer, which can handle the ingested data indifferent data processing systems, such as Spark, Hive, Linux Shell, Python or RDBMS SQLEngine (we will discuss it further in Section 5). Data is processed through workflows, each ofwhich consists of multiple processing tasks that are executed in the corresponding underlyingdata processing systems. All the workflows are scheduled to be executed only once or repeatedly at a specific time interval, such as minutely, hourly, daily, weekly or monthly. In fact, theprocessing layer can manage different workflows for processing the data from different sources.A workflow is made of multiple connected worklets, each of which is used for a particular processing task and can be executed on a underlying data processing system. For example, a batchprocessing workflow might consist of the worklet for extracting data from a source system andwriting to staging area; the worklet of running data cleansing on Spark, i.e., read data fromstaging area, process, and write the final results to an analytics database; and the worklet of
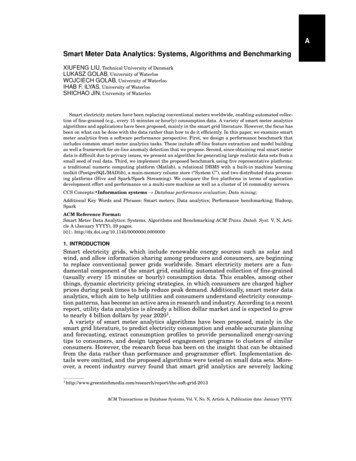
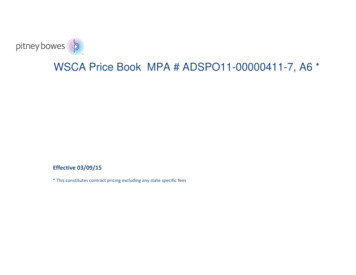
Fig. 1. The system architecture of smart meter data analytics systemhousekeeping when the job has finished, e.g., removing the data from staging area, and sendingan email for the notification.The right-most in the architecture is the analytic layer for smart meter data implementedin our previous work [29]. The analytics layer consists of a high performance database, analytics libraries, web application and report engine which are together to serve users’ analyticqueries. This system is a web-based application of using Tomcat as the application server,Highcharts (www.highcharts.com) as the visualization engine, PostgreSQL as the database,and MADlib [18] as the in-database analytic library. We implement various algorithms usingMADlib analytics functions as well as Pl/PgSQL. The implemented algorithms include thosefor load analysis, pattern discovery, segmentation, forecasting and feedback services. With thesealgorithms, users can do both supply- and demand-side data analytics, which will be discussedin Section 6.We exploit this hybrid architecture for our system in order to combine the best of eachcomponents, i.e., OLTP capability (by PostgreSQL), big data capability (by Hive and Spark),and realtime streaming ability (by Spark). Since RDBMS is more suitable for online analyticswith its powerful OLTP and indexing abilities, we use PostgreSQL to manage the latest smartmeter data, e.g., the data aged less than two years, social-economic data, and statistics data. Itis because smart meter data typically has a big size, but is rarely updated; social-economic data,such as the information of customer, property, and geographic locations, etc., is typically small,but may be updated frequently. Statistics data is the analytics results from batch jobs, whichmay be much smaller than the size of the original time-series data. Therefore, in this systemarchitecture, we use Hive as the archival database for storing history data, e.g., older than twoyears. The history data can be run by the analytics algorithms in batch jobs in Hive, and theresults are updated to PostgreSQL.5DATA PROCESSING LAYERThe data processing layer is shown in Fig. 2. The core components of this layer consist of the jobscheduler implemented using Quartz library [22], and the data processing algorithms runningin this platform. The algorithms can be run on Spark, Hive, Linux Shell, SQL Engine or Pythonenvironment. The data processing algorithms are the functional modules implemented for acertain purpose, such as data cleansing, data transformation, data anonymization, streaming
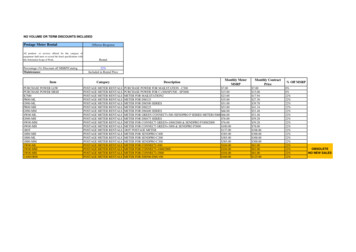
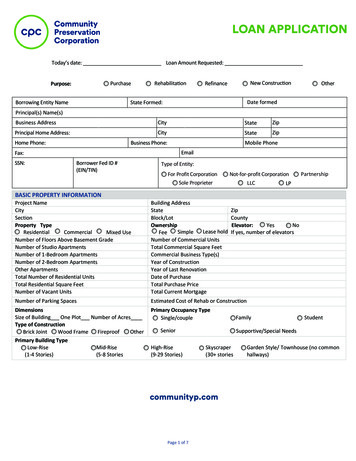
processing, anormal data detection, etc. The sources and the sinks represent the places where ajob reads the data from and writes the final results to, respectively. Since this platform is an opendata platform, it supports various data sources and targets in the underlying, which is simply toimplement the corresponding read and write interfaces.Fig. 2. The building blocks of data processing layer5.1Data Stream ProcessingThis data platform uses Spark for stream data processing (see Fig. 3). The data extractor isscheduled by the system scheduler running periodically to “pull” the data from the externalsources, e.g., extracting data from sensors or smart meters for every 15 minutes. In fact, thisplatform can extract data from any sources as long as the corresponding extractors are implemented. For security reason, some data sources require user authentication for the reading, andtherefore, the authentication needs to be specified in the data extractor program. The extracteddata are created as a distributed data sets (RDDs) in Spark, which are fault-tolerant collectionsof objects partitioned across cluster nodes that can be acted on in parallel. RDDs can be applied by the operations, called transformations, including map, filter, groupBy, and reduce, etc.The programs for processing data are developed by making use of these operators. Multipledata processing programs can constitute into a workflow, a functional module for a particularrequirement, e.g., data imputation or anonymization. The final cleaned and well-formatted dataare kept temporarily in an in-memory table in Spark, which is also a RDD but given the name ofeach attribute to improve the interoperability of Spark through SQL. When the data resides inthe in-memory table, users can do ad-hoc interactive queries by typing SQL statements througha web-based user interface, and the results will be shown in a table or graphs in the user interface. Through the interactive queries, users can check the analytics results instantly so as toverify the implemented programs of workflows. For more complex analytics requirements, andthe persistence of the data to PostgreSQL, we use BigSQL [9], an open source middleware thatcan query the data in Spark and Hive from PostgreSQL through foreign data wrapper (FDW).5.2Batch ProcessingThe data processing layer supports Hive as batch processing system for big data. Hive is an opensource SQL-based distributed warehouse system built on top of Hadoop framework [26]. Hiveis an SQL-to-MapReduce translator with an SQL dialect, HiveQL, for querying data stored in
Fig. 3. The building blocks of data processing layera cluster. Since it is typically complicated for users to implement a MapReduce program onHadoop, Hive simplifies this process by the SQL abstraction. Hive can automatically translateSQL statements into MapReduce jobs, and run on Hadoop. This greatly lowers the barrier ofusing Hadoop, and thus people who are familiar with SQL can easily write queries that willbe run on Haddoop. Hive is suitable for the situation where large-scale data is analyzed, fastresponse time is not required, and no frequent data updates are done. With these characteristics,Hive is employed to the batch processing in our platform. Thus, the data from legacy systems,archival data, or other large-sized data sets residing in Hadoop distributed file system (HDFS)can be processed in Hive by analytic queries in SQL, and/or by user-defined functions (UDFs).The final results of analtyics are written into the tables in Hive, which can be imported into thedatabase in the analytics layer, or still kept and maintained in Hive, which can also be queriedfrom PostgreSQL through the connector, BigSQL.5.3Job SchedulingAs mentioned earlier, the data processing layer supports different workflows running on thesame platform, which are scheduled by the job scheduler. A workflow may consists of multiple worklets which are the programs of Spark, Hive, Python or Linux Shell. To better controlthe scheduling of workflow and the consumption of computing resources, we implement twoscheduling algorithms to control the jobs, including deterministic scheduling and delay scheduling algorithms. The deterministic scheduling algorithm schedules the workflows running at theexact time specified by users. With this algorithm, the scheduling for workflows is deterministic and remains the same for repeated executions. The workflows that are implemented inthe Python and Shell script, and execute on a single server are scheduled by the deterministicscheduling algorithm. If a workflow consists of Hive or Spark programs that require to run on acluster environment, the workflow will be scheduled by the delay scheduling algorithm, whichensures no more than one jobs submitted to the same cluster at any point of time. The reasonis that Spark or Hive programs run on top of Java virtual machine (JVM) in the underlyingdistributed systems, which requires some amount of memory. It is easy to run out of the mainmemory if multiple tasks are running simultaneously on a node. In the delay scheduling algorithm, we use a queue to accommodate the jobs of workflows, which are ordered by the timeset by users. If two scheduling times are identical, the scheduler uses a first-in-first-out (FIFO)algorithm to submit the job to the cluster. Therefore, the execution time of some workflows maybe not the time specified by users, but at a later time.6DATA ANALYTICS LAYERAs shown in Fig. 1, the building blocks of data analytics layer consists of PostgreSQL, the indatabase machine learning toolkit, MADLib, the algorithms for smart meter data analytics, andvisualization. This layer was implemented in our previous work [29]. We now describe how weuse these building blocks in smart meter data analytics, and the functionalties provided by thislayer.
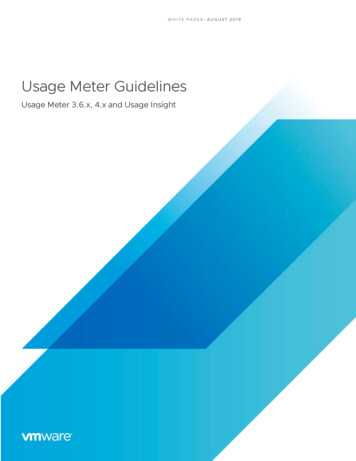
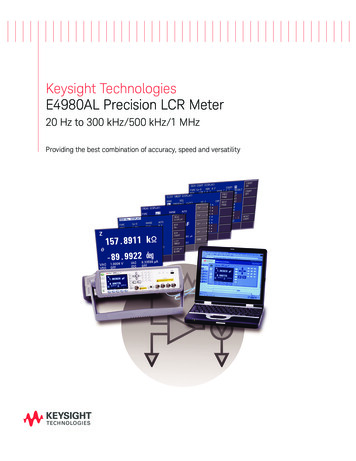
6.1Analytics AlgorithmsIn traditional execution of analytics using SAS, R, Matlab and Proc-SQL there is significant datamovement from database into the analtyic tools. Thus, the part of the workload related to datamovement is often quite substantial. One of new trends of analytics technology developmentis pushing analytic algorithms into database, which aims at removing the overhead of datamovement. MADlib is such a tool for doing in-database analytics for the open source databasesystem, PostgreSQL. The analytics layer is composed of the two core building blocks, MADLiband PostgreSQL. MADlib offers various off-the-shelf analytics functions, including the ones forlinear, logistic, multinomial logistic regression, elastic-net regularization for linear and logisticregressions, k-means, association rules, cross validation, matrix factorization methods, LDA,SVD and PCA, ARIMA, and many other statistical functions. The analytic functions are usedthrough a pure SQL interface. In this system, all our analytics algorithms are implemented asstored procedures in PostgreSQL that use Pl/PgSQL and the analytics functions of MADlib.In smart grid management, utilities must be provisioned for peak demand, therefore it isimportant for utilities to identify consumers with highly variable consumption and offer themincentives to smooth out their demand. In the analytics, utilities can run histogram on the hourlyconsumption of each customer to learn the variability of a customer (see Fig. 4).Fig. 4. Consumption variability analyticsFig. 5. Thermal sensitivity analyticsIn the analytics, we can characterize the effect of external temperature on the electricityconsumption of each customer. For example, in winter and summer, consumption rises as temperatures become more extreme due to heating and cooling. Consider the scatter plot shown inFig. 5, with temperature on the X-axis and consumption on the Y-axis. Each point on the scatterplot corresponds to a particular hourly consumption value and the corresponding temperatureat that hour (for the same customer). We implemented a recent algorithm [10] that computesa piece-wise linear regression model to characterize. The piece-wise linear regression modelthe temperature sensitivity of each customer. The algorithm computes two regression models:one corresponding to the 90th percentile consumption at each temperature and one corresponding to the 10th percentile at each temperature. As shown in Fig. 5, these models reveal severalinteresting features for each customer. For example, the slope of the 90th percentile line corresponding to high temperature is the cooling gradient, and the slope of the line corresponding tolow temperature is the heating gradient. Furthermore, the height of the 10th percentile lines attheir lowest point is the base load, which corresponds to load due to appliances that are alwayson, such as a refrigerator.Another interesting algorithm is for extracting daily consumption patterns that occur regardless of the external temperature, as illustrated in Fig. 6. On the left, we show a fragment of thehourly consumption time series for some consumer over a period of several days. Since smartmeters report the total electricity consumption of a household, we can only observe the totalconsumption time series (the upper black curve). The goal of the algorithm is to determine,
for each hour, how much load is due to temperature (i.e., heating and cooling), and how muchload is due to daily activity independent of temperature (the lower blue curve). Once this isdetermined, the algorithm fits a time series auto-regression model and computes the averagetemperature-independent consumption at each hour of the day, illustrated on the right of Fig. 6(the X-axis is the hour of the day and the Y-axis is the average consumption). Since weekdayand weekend activities may differ, it is useful to separately compute the typical weekday andweekend profiles for each consumer.Fig. 6. Daily load profile analyticsIn addition, we have implemented
The system incorporates hybrid technologies, including big data technologies Spark and Hive, the high performance RDBMS PostgreSQL with the in-database machine learning toolkit, MADlib, which are able to satisfy a variety of requirements in smart meter data analytics. Keywords: Streamline, Software Platform, Smart meter data, Data Analytics