Transcription
Using Cellometer Vision andCyto-ID Stain for AutophagyDetection in Living CellsNexcelom Bioscience LLC. 360 Merrimack Street, Building 9 Lawrence, MA 01843T: 978.327.5340 F: 978.327.5341 E: info@nexcelom.com www.nexcelom.com1001258 Rev. A
Using Cellometer Vision and Cyto-ID Stain for AutophagyDetection in Living CellsIntroductionOur understanding of autophagy has expanded tremendously in recent years, largely due tothe identification of the many genes involved in the process, and the use of GFP-LC3 fusionproteins to visually monitor autophagosomes and autophagic activity both biochemically and microscopically [1, 2]. Recently, a novel fluorescent probe, Cyto-ID Green autophagy dye,has been developed to facilitate the investigation of the autophagic process [3-5]. In thisstudy, a novel method was performed using the Cellometer image cytometry in combinationwith Cyto-ID Green autophagy dye for detecting autophagy in live cells. First, Cyto-IDGreen autophagy dye was validated by observing co-localization of the dye and RFP-LC3 inHeLa cells using fluorescence microscopy. Next, image- based and flow cytometry-basedmethods are benchmarked for measuring macroautophagic signals in nutrient-starved Jurkatcells. Autophagic signals of starved Jurkat cells induced with an autophagy inhibitor werealso quantified and compared using the two instrument platforms [6]. In order to establish thefeasibility of employing the imaging-based workflow for drug discovery applications, a timecourse study of the induction of autophagy in Jurkat (suspension) and PC-3 (adherent) cellstreated with rapamycin was undertaken [7, 8], demonstrating the ability to detect autophagywith a similar sensitivity as the starvation model. Finally, direct dose-response comparisonsof two small molecule autophagy inducers, rapamycin and tamoxifen, were performed [9].Materials and MethodsImage-Based Cytometry Instrumentation and Disposable Counting ChamberThe Cellometer Vision instrumentation has been described previously [10]. The systemutilizes bright-field (BR) and dual-fluorescent (FL1 and FL2) imaging modes toquantitatively analyze and measure the fluorescence intensities of target cells. Bright-fieldimaging uses a white light- emitting diode (LED) and fluorescent imaging uses two differentmonochromatic LEDs (470 and 525 nm) as the excitation light sources. The monochromaticLEDs are combined with two specific filter optics modules VB-535-402 (475/535 nm) andVB-595- 502 (525/595 nm). The software analyzes three image channels and generates afluorescent data set that is automatically exported to FCS Express 4 Flow Cytometry. In thiswork, FL1 and FL2 images were specifically analyzed for Cyto-ID Green autophagy dye andpropidium iodide fluorescence, respectively.Cell lines and reagents preparationThe Jurkat cell line was cultured and grown to log phase in RPMI medium. PC-3 cells werecultured and grown to 70% confluence in F-12K medium in a 24-well plate. HeLa cells were2
cultured in Eagle’s MEM with low glucose. The cell culture was maintained in an incubatorat 37 C and 5% CO2.Cyto-ID Green autophagy dye was provided as a component of a kit. The probe is a cationicamphiphilic tracer (CAT) dye that rapidly partitions into cells in a similar manner as manycationic drugs. The dye is taken up by passive diffusion across the plasma membrane bilayerand does not require protein binding or transporter activity. The excitation and emissionmaxima of the dye are 463 and 534 nm, respectively. Propidium iodide was used as is forfluorescently staining nonviable Jurkat cells, in order to exclude the necrotic cells during dataanalysis.For performance of starvation and recovery experiments, Earle’s balanced salts solution wasused as the nutrient-deprived media. For autophagic flux experiments, chloroquine (CQ) anddimethyl sulfoxide (DMSO) were obtained, and the CQ was diluted directly in the DMSObefore use. For drug treatment, the rapamycin was diluted directly into ethanol to a finalconcentration.Cyto-ID Green autophagy dye staining procedure for autophagy detectionCyto-ID Green solution was prepared by mixing the dye with 1 assay buffer. The cellsample was centrifuged, and the dye was pipetted in for image-based or flow cytometry,respectively. The sample was shielded from direct light and incubated for 30 min at 37 C,followed by a wash and resuspension in 1 assay buffer before imaged-based or flowcytometric analysis. A slight modification was made in the standard protocol in thatpropidium iodide was added to the protocol.Starvation and recovery experimentsJurkat cells were collected from the culture media and centrifuged. The control tube wasresuspended in RPMI, while the cells in the second tube were incubated with EBSS media toinduce amino acid starvation. The cells in both tubes were transferred to cell culture flasks.After 2 h, each cell sample was collected and stained following the procedure describedabove. The stained cells were then analyzed by image-based and flow cytometry. Nutrientstarved Jurkat cells were then resuspended in RPMI media for a 1-h recovery period. Afterrecovery, the staining procedure was repeated and the cells were analyzed again by imagebased and flow cytometry.Time-course measurement of rapamycin-induced autophagyIn order to show the capability of image-based cytometry for dose-response analysis,rapamycin was selected to induce autophagy in Jurkat cells. Five rapamycin solutions wereprepared using RPMI media from 0.01 to100 µM final concentration. The Jurkat cells wereresuspended in each rapamycin solution, including a control with only RPMI medium. Eachsample was incubated in cell culture flasks before Cyto-ID Green and propidium iodidestaining. Analysis was performed at 4, 8 and 18 h using the image-based cytometer.To demonstrate the capability of image-based cytometry for autophagy detection in adherentcells, PC-3 cells were treated with rapamycin at 1, 10 and 100 µM. After 4 h treatment,3
rapamycin-containing media was aspirated off and trypsinized. Cells were then resuspendedin the Cyto-ID Assay buffer before performing autophagy staining. Fluorescencemeasurements were performed using the image-based cytometer.Comparison of dose-response profiles of rapamycin and tamoxifenFive solutions were prepared using RPMI media from 0.01 to 100 µM final concentration ofrapamycin and tamoxifen. The Jurkat cells were resuspended in each solution, includingcontrols with only RPMI medium supplemented with 1% ethanol or DMSO (vehiclecontrols for rapamycin or tamoxifen, respectively). Each sample was incubated in cell cultureflasks before Cyto-ID Green and propidium iodide staining. Fluorescence analysis wasperformed after 18 h of incubation using image-based cytometry.Image-based cytometric analysisVB-535-402 and VB-595-502 were used to detect Cyto-ID Green autophagy dye andpropidium iodide, respectively. Each sample analysis was performed in duplicate.Flow cytometric analysisFlow cytometry was used for comparison with the image-based cytometry method forautophagy detection. Experiments were performed using a FACS Calibur bench- top flowcytometer equipped with a blue (488 nm) and violet (407 nm) laser. Cyto-ID Greenfluorescence was measured in the FL1 channel (530 nm) with blue laser excitation. The flowcytometry data was exported and analyzed in FCS Express 4 Flow Cytometry software andeach sample was analyzed in duplicate.4
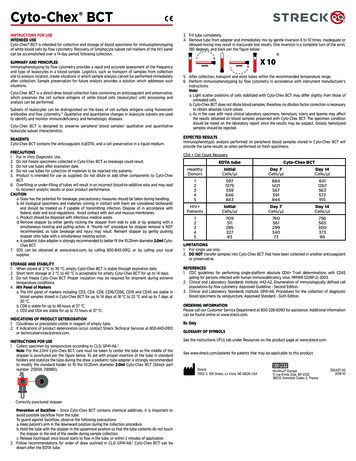
ResultsFigure 1. Data analysis for autophagy detection. (A and B) The fluorescent and bright-field images showed bright green fluorescentspots inside the Jurkat cells that represented Cyto-ID Green-stainedautophagosomes/autolysosomes. Samples were also stained with propidium iodide,shown in the fluorescent image as orange signal, which allowed for the exclusion ofdead cells from data analysis. (C) The fluorescence of propidium iodide was plotted with respect to Cyto-ID Green,and the propidium iodide-positive Jurkat cell signals were removed to allow analysisof only the viable cells in the Cyto-ID Green fluorescence histogram (D).5
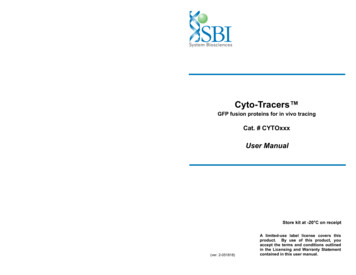
Figure 2. Validation of Cyto-ID Green autophagy dye using fluorescence microscopy. The starvation experiment with HeLa cells stained with Cyto-ID and Hoechst showedan obvious increase in the Cyto-ID fluorescence signals. Importantly, little to nostaining of lysosomes in the control cells was observed. For the rapamycin treatment experiment, the control and the sample with 3-MAdisplayed low green fluorescence as expected, while the sample treated withrapamycin in the absence of 3-MA showed an increase in green fluorescence,indicating higher levels of autophagy. HeLa cells were transfected with RFP-LC3 and treated with tamoxifen. Underfluorescence microscopy, the green fluorescence was found to be associated withpunctate structures that co-localized with the red fluorescence of RFP-LC3. Note thatRFP-LC3 was not uniformly expressed in all cells, due to the limited transfectionefficiency.6
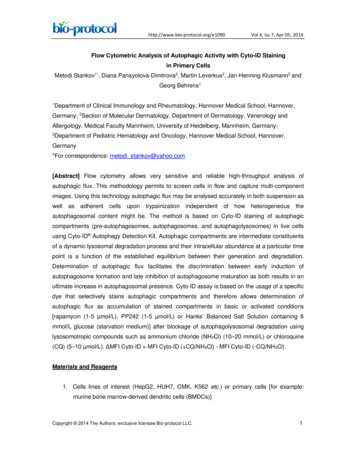
Figure 3. Comparison of starvation and recovery assay using image-based and flowcytometry. Starvation was induced by incubating Jurkat cells in EBSS media for 2 h. Here,bright-field and fluorescent images of control, recovery and nutrient-starved Jurkatcells are shown. The fluorescent images show strong fluorescence in the nutrientstarved Jurkat cells compared with the control and recovered samples. However, itwas difficult to visually distinguish the fluorescence intensities between the controland recovered samples without examining the fluorescence histograms. A comparison of fluorescence histogram results obtained with the Cellometer andFACS Calibur cytometers is shown here. Profiles from the three samples wereoverlaid on the same histogram plot to facilitate changes in fluorescence. The peaksin the plot showed comparable response trends using both instrumentations, where thecontrol group showed the lowest fluorescent intensity, followed by the recoverygroup, while the nutrient-starved group displayed the highest fluorescence intensityvalues.7
Figure 4. Comparison of rapamycin and tamoxifen dose response effects. (5A) Calculated AAF values for drug dose response effects in Jurkat cells. Thecalculated AAF values for rapamycin showed approximately 20% increase inautophagy at 18 h incubation. The 4 and 8 h samples were comparable, indicatingrapamycin required more than 8 h of incubation in order to induce noticeableautophagy. (5B) Both visually and analytically, rapamycin showed higher autophagic signalsthan tamoxifen after 18 h incubation. It was interesting to note that tamoxifen inducedcytotoxicity at the highest concentration in contrast to rapamycin.8
Figure 5. Time-dependent dose response effects in rapamycin-induced autophagy. (6) Rapamycin-induced autophagy in PC-3 cells. Bright-field (top) and fluorescent(middle) images of PC-3 cells induced with 0, 1, 10 and 100 µM of rapamycin for 4 h.The fluorescent images clearly showed the increase in fluorescence and population ofCyto-ID Green autophagy dye-stained PC-3 cells, confirmed by the fluorescencehistogram (bottom), showing increase in average fluorescence intensity as rapamycinconcentration increased.9
Conclusion The ability to efficiently measure and analyze autophagy in living cells is ofparticular importance when screening for compounds that can potentially modify adisease state.Here, Cyto-ID Green was validated using fluorescence microscopy to demonstrate thecolocalization of RFP-LC3 and Cyto-ID Green in a starvation model using HeLa cells.In order to develop the novel autophagy detection method, image-based cytometrywas compared with conventional flow cytometry in the measurement of autophagy innutrient-starved Jurkat cells. Both methods showed a strong increase in autophagy innutrient-starved cells, which decreased for cells that had been allowed to recover byreturning them to standard media.An essential aspect in developing a rapid autophagy detection method is todemonstrate its ability to analyze samples under drug discovery conditions. Thiscapability was established to measure autophagic levels of Jurkat cells induced withrapamycin at various concentrations. Since rapamycin required at least 12 h ofincubation in order to observe autophagy induction, the goal was to demonstrate theability to measure dose response effects as a function over a relatively long timeperiod. Overall, image-based cytometry was able to detect the differences inautophagic levels across the various incubation periods.Since many autophagy studies involve the use of adherent cells, the human prostatecancer cell line, PC-3 was selected to benchmark the capability of image-basedcytometry. The resolution of Cellometer Vision was sufficient to image and measurefluorescent autophagosomes (puncta), as indicated in both fluorescent imagescaptured by the system and fluorescence intensity histograms generated.In addition to measuring time-dependent dose response of rapamycin, it was alsoimportant to demonstrate the ability to compare autophagic effects of multiplecompounds, which can prove useful in a drug discovery campaigns. Tamoxifen wasemployed as an alternative to rapamycin in this context. The analysis revealed that atthe same concentration, rapamycin induced a higher level of autophagy thantamoxifen. However, 100 µM tamoxifen actually proved to be somewhat cytotoxic,leading to Jurkat cell death after 18 h incubation.In this experiment, image-based cytometry was able to verify the cytotoxicity effectof tamoxifen at high concentration, which proved to be useful in eliminatinguncertainties from results that only plotted as scatter plots or histograms.Image-based cytometry has been shown to generate comparable results as standardflow cytometry for fluorescent-based cellular analysis [10, 12].Image-based cytometry may offer certain advantages in detection and analysis ofresponse in cell-based assays:o For example, cell sample volume requirements typically ranges from 10 to 40µl for image-based cytometers, which means the number of cells used aresignificantly reduced compared with a typical flow cytometer, which requiresvolumes of 300 to 500 µl.10
o The ability to capture images allows researchers to visually inspect acquiredfluorescent data, such as data generated from starvation and recoveryexperiments. This can prove useful in order to identify cytotoxicity as acomplicating side effect of a drug treatment regime.o Since the disposable counting slides are plastic, autofluorescence can occurwith the excitation and emission of Cyto-ID Green autophagy dye, which maygive rise to high background signals. However, the software can automaticallyremove the background signal to obtain the actual target fluorescence.o While the fluorescence exposure times used with the Cellometer Vision arelonger than instruments using high power lasers or LEDs, fluorescence photobleaching becomes less of an issue when performing cell-based assays.References1.Klionsky, D.J., A.M. Cuervo, and P.O. Seglen, Methods for monitoring autophagy from yeast to human.Autophagy, 2007. 3: p. 181-206.2.Mizushima, N., T. Yoshimori, and B. Levine, Methods in mammalian autophagy research. Cell, 2010.140(3): p. 313-326.3.Klappan, A.K., et al., Proteasome inhibition by quercetin triggers macroautophagy and blocks mTORactivity Histochemistry and Cell Biology, 2011. 137(1): p. 25-36.4.Lee, J.S. and G.M. Lee, Monitoring of autophagy in Chinese hamster ovary cells using flow cytometry.Methods, 2011. 56: p. 375-382.5.Warenius, H.M., et al., Selective anticancer activity of a hexapeptide with sequence homology to a nonkinase domain of Cyclin Dependent Kinase 4 Molecular Cancer, 2011. 10: p. 72.6.Levy, J.M.M. and A. Thorburn, Targeting autophagy during cancer therapy to improve clinical outcomes.Pharmacology & Therapeutics, 2011. 131: p. 130-141.7.Tallóczy, Z., et al., Regulation of starvation- and virus-induced autophagy by the eIF2α kinase signalingpathway PNAS, 2002. 99(1): p. 190-195.8.Tanemura, M., et al., Rapamycin Induces Autophagy in Islets: Relevance in Islet Transplantation.Transplantation Proceedings, 2009. 41(1): p. 334-338.9.Gozuacik, D. and A. Kimchi, Autophagy as a cell death and tumor suppressor mechanism. Oncogene,2004. 23: p. 2891-2906.10. Chan, L.L., et al., Cellometer vision as an alternative to flow cytometry for cell cycle analysis,mitochondrial potential, and immunophenotyping. Cytometry A, 2011. 79(7): p. 507-17.11. Hollo, Z., et al., Calcein accumulation as a fluorometric functional assay of the multidrug transporter.Biochim. Biophys. Acta, 1994. 1191(2): p. 384-388.12. Chan, L.L., et al., A rapid detection method for apoptosis and necrosis measurement using theCellometer imaging cytometry. Apoptosis, 2011. 16(12): p. 1295-303.11
Cyto-ID Green solution was prepared by mixing the dye with 1 assay buffer. The cell sample was centrifuged, and the dye was pipetted in for image-based or flow cytometry, respectively. The sample was shielded from direct light and incubated for 30 min at 37 C, followed by a wash and resuspension in 1 assay buffer before imaged-based or .