Transcription
Discrete Dynamics in Nature and Society, 2002 Vol. 7 (1), pp. 7–17Modelling Desert Dune Fields Based on Discrete DynamicsSTEVEN R. BISHOPa,*, HIROSHI MOMIJIb, RICARDO CARRETERO-GONZÁLEZa,† and ANDREW WARRENbaCentre for Nonlinear Dynamics and its Applications, University College London, Gower Street, London WC1E 6BT, UK; bDepartment of Geography,University College London, 26 Bedford Way, London, WC1H 0AP, UK(Received 10 May 2001)A mathematical formulation is developed to model the dynamics of sand dunes. The physical processesdisplay strong non-linearity that has been taken into account in the model. When assessing the successof such a model in capturing physical features we monitor morphology, dune growth, dune migrationand spatial patterns within a dune field. Following recent advances, the proposed model is based on adiscrete lattice dynamics approach with new features taken into account which reflect physicallyobserved mechanisms.Keywords: Desert dune field; Modelling; Discrete dynamics; Lattice; Non-linearityINTRODUCTIONMathematical modelling is now a common tool in manyfields of study. In some areas reconstruction techniques areused to develop a model from known data to improve ourunderstanding of physical interactions, while othersemploy models to predict future states, for example,possible hazards. In the geoscientific field, the usefulnessof mathematical modelling has been widely recognisedthrough its applications to such topics as hill slopeevolution, river morphology and sea level change (see forexample Woldenberg (1985) and Anderson (1988)). Herewe are interested in the morphology, dune growth,downwind migration and spatial patterns which form in asand field, where we aim to qualitatively and quantitatively mimic real dunes and also to identify the physicalfeatures which play the most important role.Dune fields show fascinating features which attract theresearch attention of many scientists. For geographers adune field is of prominent interest since it is a typicallandform where aeolian processes dominate. Such aeolianlandforms are estimated to cover about one-fourth of theearth surface (Livingstone and Warren, 1996 p1).Furthermore, dune fields are also found on Mars (Greeleyand Iversen, 1985 and Edgett and Malin, 2000) and Venus(Greeley et al., 1992). For physicists the dynamic, selforganised patterns in which we can see, for example,regular spacing with embedded defects, are veryattractive. In terms of physics, a dune field is a typicalnon-linear open system (for an introductory review ofthis viewpoint see Werner (1999)). While in engineering,a knowledge of the formation of dune fields is stillimportant today because we are now hoping to exploitthese vast areas of land for example by introducingnetworks of roads and pipelines.Although vegetation and pre-existing topography playsignificant roles in dune formation in some areas (see forexample Cooke et al. (1993)), we simplify the problemhere by restricting our attention to dunes in a perfectly dryand initially almost flat desert. These dunes are called freedunes. In such a dune field, any landform is a result ofrecurring interaction between wind flow over the dunefield, topography, and gravity. Despite much field work(for example Kocurek et al. (1992)), only a few modellingattempts have succeeded even in reproducing a singledune.A typical dune field extends for hundreds of kilometres,and takes many thousands of years to form, so that thestudy of dune-scale geomorphology cannot rely on welldefined experiments. The alternative is to assume a set ofplausible physical processes based on observations, createa model, and then compare simulated results to nature.Analytical results are typically not available. Difficulties arise due to the strong non-linearity involved in thesystem, which includes wind flow over a dune fieldexpressed by the Navier – Stokes equation, sand transport*Corresponding author. Tel.: 44-020-7679-7729. Fax: 44-020-7380-0986. E-mail: s.bishop@ucl.ac.uk†Department of Mathematics and Statistics, Simon Fraser University, Burnaby, BC, V5A 1S6, CANADAISSN 1026-0226 q 2002 Taylor & Francis LtdDOI: 10.1080/10260220290013462
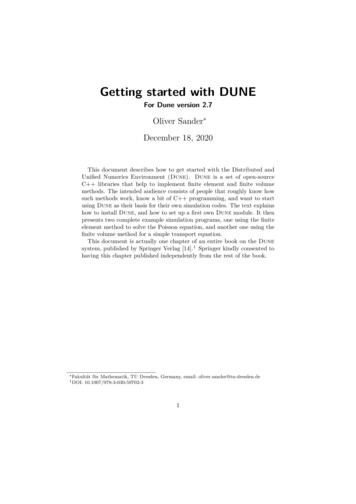
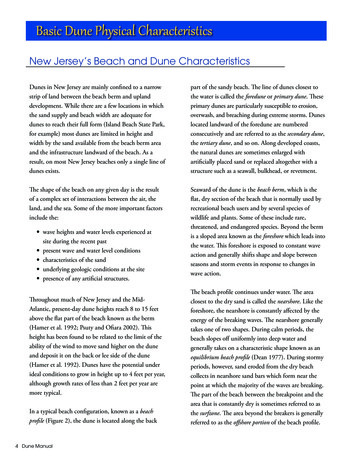
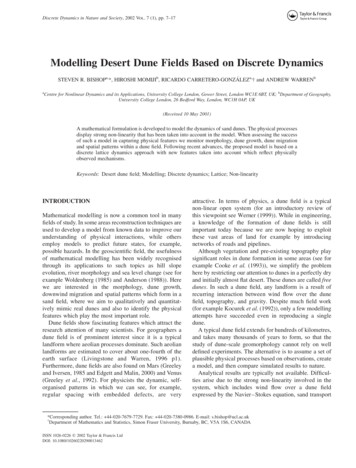
8S. R. BISHOP et al.FIGURE 1 Schematic views of typical dunes: (a) dome dune, (b) barchan dune, (c) transverse dune, (d) linear dune, (e) star dune and (f) network dune.((a)–(e) after McKee, 1979; (f) after Cooke et al., 1993). Arrows show the predominant wind directions.induced by wind and sudden deformation by gravityknown as avalanching, the latter leading to non-smoothdynamics. Since the work of Bak et al. (1987),avalanching has been intensively studied in relation toSelf-Organised Criticality (SOC) (Bak, 1996). Yet, somecharacteristic features of dunes, such as strong asymmetricprofile, need theory which goes beyond linear analysis.To describe the evolution of such a system starting fromfirst principles we have to consider momentum conservation of the system comprised of air and sand grains.However no such equation is yet available. Even if we canconsider wind flow and sand transport separately, it isextremely difficult to solve the Navier –Stokes equation,even in the case of an isolated single dune on a flat surface(Howard and Walmsley, 1985; Wippermann and Gross,1985; Zeman and Jensen, 1988; Weng et al., 1991; Stam,1997; van Dijk et al., 1999). In the case of a dune fieldcomprising many dunes with different shapes, it is almostimpossible to calculate the wind flow with the sameaccuracy as in the case of a single dune. Furthermore, wehave to solve these equations under moving boundaryconditions as dunes grow, in a three-dimensional space(x, y, z ).Tracking dune evolution by calculating wind flow overa dune field each time is therefore practically impossible.To simulate dune fields, our approach is throughphenomenological models based not on detailed physicalprocesses, but on simplified rules which, neverthelesscorrectly reflect observations.Significant progress has been made by the introductionof two models by Nishimori and Duchi (1993), Nishimoriet al. (1998), and Werner (1995) (also see Momiji et al.,2000 for a review). They both assume that a dune field canbe considered as an accumulation of sand “slabs”(artificially introduced sand blocks) piled in a twodimensional horizontal lattice, and that the movement of
MODELLING DESERT DUNE FIELDSthese slabs can be used to simulate wind directional sandtransport and deformational shaping by gravity. These canbe considered to be the minimal model for describing adune field. A similar model for a coastal dune fieldcomprising alternating sequences of dunes and vegetationcovered areas was developed by de Castro (1995).Both Nishimori’s and Werner’s models succeeded inreproducing some types of dunes, and explaining therelation between dune shape and its formative environment. Incorporating other plausible physical mechanismsinto these minimal models one by one, and comparingresults with observations, it is thought to be possible toclarify the physical processes involved in a dune fieldsystem, and to develop a more general model thatresembles processes in nature. Unlike Nishimori’s model,Werner’s model takes into account the time scaledifference between bulk sand transport and avalanching.In this paper, to aid the reader, dunes and dune fieldgeomorphology and related aeolian processes are brieflyreviewed. A model is proposed which extends Werner’swork, introducing physically motivated modificationsmaking the model results more realistic.DUNE FIELD GEOMORPHOLOGY AND AEOLIANPROCESSESClassification of Simple (elementary) DunesDespite the complexity of wind patterns in nature there aresome recurring features of dune fields that are found inmany different desert regions. Free dunes can be classifiedinto three basic groups, depending on the alignments oftheir crest to the net sand transport, namely transverse,linear and star dunes. Net sand transport is normal to thecrests for transverse dunes, parallel to the crests for lineardunes, and towards a central node for star dunes. Withineach of these three categories there can be furthersubdivisions.Transverse DunesDome dune: an isolated, usually transverse dune withno slip face (Fig. 1(a)).Barchan dune: a free transverse dune with a crescenticplan-shape in which the crescent opens downwind (Fig.1(b)).Transverse dune: dune ridges with crests transverse tothe dominant wind, which migrate, for the most part, in thedirection of the dominant wind (Fig. 1(c)).Reversing dunes: transverse dunes that reverse in thedirection as the wind changes through 1808.Linear Dunes (Fig. 1(d))Seif dune: a sinuous, sharp-crested, linear dune.Sand ridge: partly vegetated linear dune, usually largethan a seif.9Star DunesStar dune: a large pyramidal or dome-like dune witharms (Fig. 1(e)).Network dune: result of the overlap of a number oftransverse dune systems, each aligned to a different windin a complex annual regime (Fig. 1(f)).Dune Dynamics by Wind and by GravityWind flow over a terrain can be characterised by the windshear velocity (u*). An increase in shear velocity againstdistance is observed in field experiments for the windwardslope of barchan dunes and of transverse dunes (see forexample Lancaster et al. (1996) and Frank and Kocurek(1996b)). The wind flow pattern over an isolated gentlehill surrounded by a plane surface is predicted by theJackson– Hunt theory (Jackson and Hunt, 1975). Thistheory’s most important result is that there is an increase inshear velocity over the windward slope and a decline overthe leeward slope. However the applicability of this theoryis limited. For example it cannot predict the reverse flowin the lee of the slip face.Sand motion is triggered and maintained by wind shearstress working on the sand surface. The dominating modeof sand transport for dune dynamics is a ballistic sandgrain motion called saltation, where the typical leap isorder of centimetres. In saltation-dominated sand transport, the sand flux (q ) is approximately proportional to thecube of the wind shear velocity ðu3* Þ (Bagnold, 1941). Inthe lee of the dune, avalanching occurs when the slopeexceeds a certain angle, typically taken as 338 for dry sand.This sand transport induced by gravity forms a slip facewith a straight cross section. Theory and laboratoryexperiments suggest that this slip face is indeed not asmooth but a complicated surface, which is a consequenceof avalanches of all sizes (Bak et al., 1987; Bak, 1996). Ifthe sand is wet, coherent slumping occurs, where a largearea of the slip face surface slides down simultaneously(Cooke et al., 1993 Figure 23.22).Transverse dunes and barchan dunes are known tomigrate downwind ( x direction, say) without changingtheir shape. Field data show that the lower the dune, thequicker it migrates (a summary can be found in Cookeet al. (1993) Figure 23.24). This inverse relation betweendune migration speed (cd) and dune height (H ) wasexamined using a dune field model by Nishimori et al.(1998), and has been theoretically derived by Momiji andWarren (2000).Forming Environment of Each Type of DuneThe particular dune type which forms in any particularvegetation-free environment is primarily determined bythe wind regime. Fryberger (1979) categorised annualwind patterns into three main regimes; “unimodal”,“bimodal” and “complex”. In “unimodal” regimes windsblow from almost the same direction throughout the year.
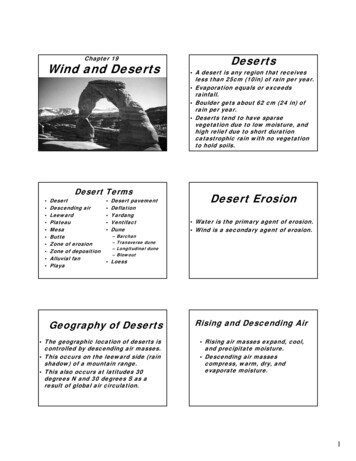
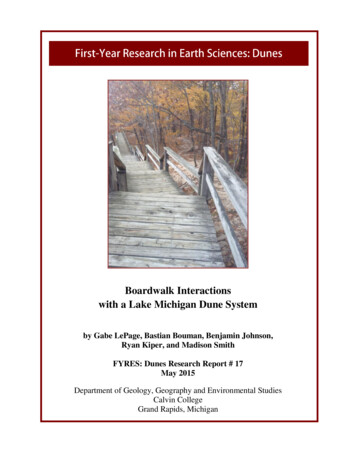
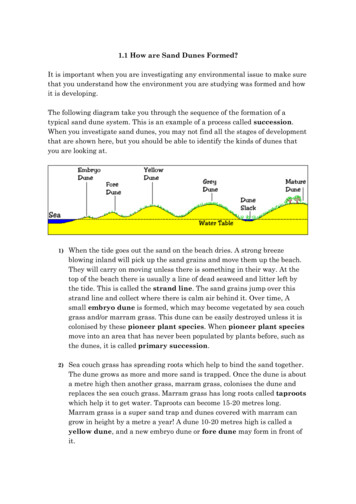
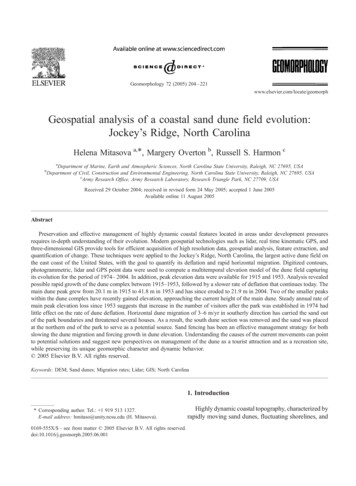
10S. R. BISHOP et al.proportional to the number of sand slabs piled on eachlattice site (h(i, j )):hði; jÞ ¼ hði; jÞ 3;FIGURE 2 Dune type diagram with regard to sand availability andwind direction variability (after Livingstone and Warren (1996) Figure5.22). “B”, “I”, “L” and “T” denote respective barchan dunes, isolateddunes linear dunes and transverse dunes, which are simulated in thisstudy.In “bimodal” regimes the seasonal wind distributioncomprises two directions or modes. In “complex” regimesthe wind distribution comprises either more than twomodes or no distinct mode. A relation between bedformalignment and directionally varying flows was proposedby Rubin and Hunter (1987). They speculated thatbedforms are aligned such that the gross normal sandtransport throughout the cycle of wind variation ismaximum. This relation was supported with fieldobservations of aeolian dunes by Lancaster (1991).The second important factor in determining the dunetype is the amount of sand available for dune building.Wasson and Hyde (1983) developed a diagram of dunetypes with respect to wind variability and sand availability.Later this diagram was refined by Livingstone and Warren(1996 Figure 5.22), schematically reproduced here asFig. 2 in this paper. The classifications contained in thisdiagram are on the whole accepted by many researchers.where 1/3 is slab aspect ratio. Periodic boundaryconditions are adopted so that the small simulated areamay be repeatedly copied to represent the whole dune fieldlike a mosaic.The first step in the algorithm is to randomly choose asite (i, j ), from which a single slab is considered to beeroded and then transported downwind in the x direction.The distance moved is a specific number of lattice sitesL(i, j ). L(i, j ) is a site-dependent, rounded-down integer,whose definition is given below. The transported slab isthen deposited on top of the slab pile at the new site (i L(i,j ), j ) with a probability (P ). If the slab is not deposited atthis site, it is transported farther (bouncing ) to the site(i L(i, j ) L(i L(i, j ), j ), j ), and is deposited again with acertain probability. This procedure continues until the slabis eventually deposited at a site. Based on Bagnold’sobservation that saltating sand grains are more likely tobounce on a stony surface than on a sandy surface(Bagnold, 1941 pp36 –37), the deposition probability atsites with at least one slab is set higher ðPs ¼ 0:6Þ than theprobability at sites without a slab ðPns ¼ 0:4Þ: Furthermore, the concept of a shadow or lee zone downwind ofdunes is introduced (Fig. 3(b)), in which no erosion occursand the deposition probability is unity at any site withinthe lee zone, i.e. Ps ¼ Pns ¼ 1:0: This shadow zone istaken as 158 from the dune crest, corresponding to the reattachment point downwind which is roughly four times aslong as the dune height from the dune (Frank and Kocurek,1996a). Together with this wind-directional transport,avalanching occurs at the place of the steepest descent ifthe number of slabs between any neighbouring sitesdiffers by three, which is equivalent to the angle of reposeof 33.78 for the nearest neighbouring sites and 25.28 for thesecond nearest, respectively (Fig. 3(c)).The increase in shear velocity over a dune can beformulated by adding terms to the original transportlength, which are related to the surface height:(Lði; jÞ ¼MATHEMATICAL MODELLING OF A DUNEFIELDTo model the formation and migration of free dunes weconsider a model based on a discrete three-dimensionalspace. Consider a two-dimensional lattice labelled (i, j )(Fig. 3(a)); dune height is measured obliquely out of thepage. This portion of space is assumed to be a typicalsection within a dune field.To achieve good results using modest computationaltime we use simplified algorithms to monitor state spacevariations. Here we assume that the dune field consists ofthree-dimensionally discrete sand slabs (Fig. 3(a)).Consequently the height (h(i, j )) is discrete andL0 þ C 1 ðhði; jÞ 2 href Þ þ C 2 ðhði; jÞ 2 href Þ2ðhði; jÞ href ÞL0 þ C 1 ðhði; jÞ 2 href Þðhði; jÞ , href Þ;ð1Þwhere L0, C1 and C2 are constants, (i, j ) is theerosion/ongoing “bounce” site and href is the referencenumber of slabs. The linear term C1 in Eq. (1) controls thewindward surface slope and produces an asymmetric duneprofile as in nature, whereas the non-linear term regulatesdune height (Momiji et al., 2000. The reference number ofslabs (href) is defined here ashref ðtÞ ¼ havg 212L2sðLs 21;LXs 21Þði;jÞ¼ð0;0Þjhði; j; tÞ 2 havg j;
MODELLING DESERT DUNE FIELDSwhere Ls Ls ; is the lattice size. The second term of theright-hand side of this equation expresses how many slabsat a site on average incorporate dunes construction botherosionally and depositionally. In the simulation timedenoted by t is the number of lattice sites that have been11polled for slab erosion divided by the number of surfacelattice sites ðLs Ls Þ:Figure 4 shows how the lattice is adjusted to model adune field with bi- or multi-directional wind. When thewind is initially blowing parallel to the i axis, and then
12S. R. BISHOP et al.FIGURE 3 Lattice model configuration and algorithms: (a) winddirectional sand transport, (b) shadow zone and (c) avalanching. In theshadow zone no erosion occurs and the deposition probability is 1.0.changes its direction with angle of u from i axis, the latticeis rotated by an angle u keeping the topographyunchanged:i ¼ ðinew 2 Ls 2Þ cos u 2 ðjnew 2 Ls 2Þ sin u þ Ls 2j ¼ ðinew 2 Ls 2Þ sin u þ ðjnew 2 Ls 2Þ cos u þ Ls 2FIGURE 4 Modelling scheme for a dune field where the wind changesdirection. The lattice is rotated in response to the wind directional change.After the rotation, neighbouring sites are checked to see if they break theangle-of-repose criterion.an optimal rotation (pivot) centre for each wind-directionchange, which is usually different from ðLs 2; Ls 2Þ; sucha difference in number of slabs can be reduced to the orderof 0.1% with modest additional computational time. Thisis a practical remedy. An ideal solution is to use aninfinitely large lattice (i.e. Ls ! 1) to increaseuniformity in spatial distribution of dunes.hðinew ; jnew Þ ¼ hði; jÞ:Consequently, the wind always blows parallel to the iaxis. After the rotation, we check whether anyneighbouring sites break the angle-of-repose criterion.The drawback of this scheme is that the number of slabs isnot conserved. If the average number of slabs (havg) issmall, the situation is worse. In the case of havg ¼ 2:0 thedifference between the initial and the final numbers ofslabs after t ¼ 1500 is about 10%. However, if we chooseSIMULATION RESULTS AND DISCUSSIONPattern and Sand AvailabilityTable I shows parameters used in the simulations thatfollow. In the model, sand availability is defined as theaverage number of slabs per site (havg) taken over all sites.In Fig. 5 we show the results of a simulation of t ¼ 1500TABLE I Simulation parametersParameterlattice size:slab aspect ratioangle of reposeto the nearest neighbourto the second nearest neighbourshadow zone angletransport length at the reference heightshear-velocity-increase:linear coefficientnon-linear coefficienterosion probability:outside shadow zonein shadow zonesdeposition probability:outside shadow zone:with at least a slabwithout a slabin shadow zonesValueLs Ls ¼ 1024 10241/3¼ffiffi 33:78tan21 ð2 3Þ ptan21 ð2 3 2Þ ¼ 25:28158L0 ¼ 5 (unless specified in the text)C1 ¼ 0:4C2 ¼ 0:002same at every site0.0Ps ¼ 0:6Pns ¼ 0:4Ps ¼ Pns ¼ 1:0
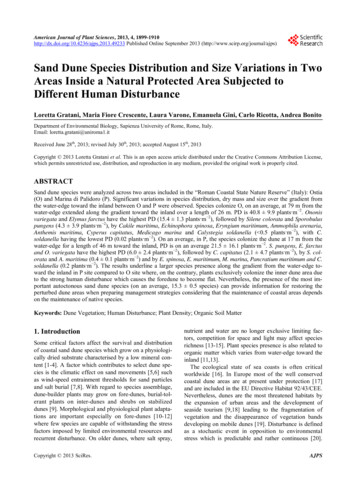
MODELLING DESERT DUNE FIELDS13FIGURE 5 Different types of dune simulated with various sand availabilities (havg); (a) 2.0, (b) 7.0 and (c) 20.0. All simulations started with an almostflat surface. The contour interval is h ¼ 5:beginning with an almost flat surface. As havg increases,the dune field changes from no pattern ðhavg # 1:1Þ tobarchan dunes shown in Fig. 5(a) for havg ¼ 2:0; then tolaterally connected barchan dunes (Fig. 5(b), havg ¼ 7:0),and finally to transverse dunes (Fig. 5(c), havg ¼ 20:0Þ.The laterally connected barchan dunes are more sinuousthan the transverse dunes formed in an infinitely deep sandfield. The change from barchan dunes to transverse dunesin response to the increase of sand availability coincideswith field observations (Livingstone and Warren 1996Figure 5 22, Fig. 2 in this paper).Characteristics of each pattern can be extracted through jÞÞ: The Fourierthe Fourier transform ðhði; jÞ ! hði;components which are not thought to contribute to the 0Þ are all excluded. As sandpattern h(0,j) and hði;availability increases, the wavelength in the i directiondecreases. For an infinitely deep sand field, the first peak is78.8, and the second is 102.4. Transverse dune systemsformed in an infinitely deep sand field are more regularthan that with inter-dune bare surfaces. The intensity ratioof the first peak to the second peak is higher when havg 20:0 than when havg ¼ 10:0:There is a sudden transition from no pattern to a patternof isolated dunes without distinct asymmetry or a slip face,namely dome dunes. This transition was checked by using15 different sets of simulations. Table II shows theresulting maximum number of slabs (hmax), for sandavailability (havg) values of 1.1 and 1.2. In all simulationswith an average number of slabs per site (havg) of 1.1, nopattern was formed, whereas for havg of 1.2, isolated dunesformed in all simulations. The threshold thus lies betweenhavg of 1.1 and 1.2. As sand availability increases furtherto havg ¼ 2:0; these dome dunes gradually change tobarchan dunes.If, rather than starting with an almost flat surface, westart with an initial surface consisting of barchan dunes,
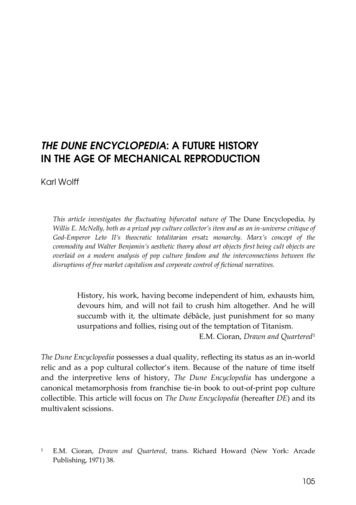
14S. R. BISHOP et al.TABLE II Maximum dune height when sand availabilities are below and above the thresholdSimulation123456789101112131415hmaxðhavg ¼ 1:1Þhmaxðhavg ¼ they remain as features even when the sand availability isless than the previously determined threshold.In the following numerical experiments, the simulationtime (t ) is 3000, the first half ðt # 1500Þ of this time beingfor the initial barchan dunes creation. At t ¼ 1500 half ofthe slabs at every site were removed, and then simulationswere resumed. That is at t ¼ 1500 we reduced the barchandunes to half their height, with a corresponding reductionin the steepness of the windward surfaces. The initial sandavailability ðhavg ðt # 1500ÞÞ was varied from 1.2 to 2.0.Table III shows the sand availabilities (havg) for t # 1500and for t 1500; the resulting maximum number of slabs(hmax) and the patterns at t ¼ 3000: “N” and “D” representno pattern and the pattern with (barchan) dunes,respectively. Dunes did not disappear completely, evenwith the sand availability less than the threshold.However, many of these dunes are not stronglyasymmetric in their wind-directional shape, and do nothave distinct slip faces. In the region below the threshold,the system can be said to be bistable, i.e. both no patternand the pattern with isolated (dome/barchan) dunes canexist, depending on the initial surface morphology. Tocheck if there is another threshold in sand availability,below which initially placed barchan dunes disappear,more simulations are necessary.without interaction with neighbouring dunes, a barchandune cannot maintain its shape during its downwindmigration.The dune labelled * in Fig. 6 is about 30 slabs( ¼ 10 l.u.; lattice units) high, and migrates about 500 l.u.in a period of t ¼ 100: A 10-m barchan dune is known tomigrate typically 20 m annually Cooke et al., 1993, Figure23.24). Considering both these dynamics, temporal andspatial scales in the model can be estimated as follows:1 l:u: ¼ 1 m4t ¼ 1 year:ð2ÞTable IV shows the relation between dune pattern andthe slab transport length (L0) at the reference height. Sandavailability (havg) is 2.0. When the wind is too strongðL0 ¼ 50Þ; an almost flat surface appears. On the otherhand, when the wind is weak ðL0 ¼ 2Þ; the dunes are low.Both these results support earlier analyses (Momiji andWarren, 2000; Momiji and Bishop, 2001). Sand flux (q )on the level surface can be related to the slab transportlength (L0) at the reference height as follows (Nishimoriet al., 1998, Momiji et al., 2000):q ¼ ½L30 3 ½g ½L0 ½t ;Dune Migration and Scales in the ModelTo estimate the scaling of length and time in our model weconsider the downwind migration of barchan dunes. Wefix the sand availability (havg) at 2.0. Figure 6(a) shows abarchan dune field which appeared from an almost flatsurface after t ¼ 1500: While Fig. 6(b) shows the fieldwith all other dunes removed except the one marked with a* in Fig. 6(a). To view migration of the complete dunefield, in Fig. 6(c) we plot the field t ¼ 100 later, i.e. t ¼1600: Whereas in Fig. 6(d) we plot the correspondingmigration of the isolated dune of Fig. 6(b) after a furthert ¼ 100: From (a) and (c), the barchan dunes are found tobe migrate downwind without changing their individualshapes or the alignment (the two dunes at the bottom showa partially connected transient form). This is cooperativemotion, and as seen in the migration from (b) to (d),ð3Þwhere g is the bulk sand density (1961 kg m23) for quartzsand with the lowest porosity in theory (0.26, see forexample Pye and Tsoar (1990)), which gives the highestestimation for the sand flux (q ). From Eqs. (2) and (3),the sand flux (q ) for L0 ¼ 1 is calculated as 8:3 1025 kg m21 s21 ; which is less than 10% of valuesobserved for a reversing dune by Walker (1999). Table IVpredicts that if the sand flux is small enough, no dunesemerge, i.e. a threshold in sand flux exists. When L0 ¼ 3dune migration speed is about 60% of that when L0 ¼ 5:Patterns in a bi-directional Wind RegimeOnce we know the time scale in the model, we cansimulate a dune field in which the wind direction changesseasonally, a common situation in nature. Figure 7 showsTABLE III Conservation of the initial dune pattern below the threshold in sand availability ("N" and "D" represent no pattern and the pattern with(barchan) dunes, respectively)havg(t # 1500)1.21.31.41.51.61.71.81.92.0havg(t 0.7925D0.8227D0.7524D0.9527D
MODELLING DESERT DUNE FIELDS15FIGURE 6 Downwind migration of barchan dunes. (a) Barchan dune field appeared from a almost flat surface after t ¼ 1500: (b) A selected barchandune from (a). All others are removed. (c) Barchan dune field of t ¼ 100 after (a). (d) The barchan dune of t ¼ 100 after (b).the relation between the dune type and the formativeenvironment, the latter is comprised of an annual winddirectional change and sand availability. Wind directionchanges every half a year ðt ¼ 2Þ: Sand availability and theangle between two directions of wind (havg, u ) are (a)(100.0, 608), (b) (100.0, 1208), (c) (2.0, 608) and (d) (2.0,1208). In a dune filed with a limited amount of sand,different types of barchan dunes appear, depending on theangle between two wind directions (u ). When the angle is608, barchan dunes similar to transverse dunes appear,whereas when the angle is 1208, barchan dunes similar tostar dunes with three crest lines appear. In a dune fieldwith ample sand, the dune type changes significantly asthe angle changes. When the angle is 608, transverse dunesappear, whereas when the angle is 1208, linear dunesappear. The same transition between transverse dunes andlinear dunes associated with wind directional change wasalso found in the modelling studies of Werner (1995) andNishimori et al. (1998) and was theoretically predicted byRubin and Hunter (1987).Figure 2 shows the summary of dune types against sandavailability and wind directional change. Simulated resultsare embedded in the empirical diagram compiled byTABLE IV Dune pattern and the slab transport length (L0) at thereference heightL0Dune patternhminhmax012345102550No patternNo patternLow transverse dunesBarchan dunesBarchan dunesBarchan dunesdome-like barchan dunesA few dome dunesNo pattern11000000045734404031158
16S. R. BISHOP et al.FIGURE 7 Dune types and wind directional change. Sand availability and angle between two directions of wind (havg, u ) are (a) (100.0, 608), (b)(100.0, 1208), (c) (2.0, 608) and (d) (2.0, 1208).Livingstone and Warren (1996 Figure 5.22). For aninfinitely deep sand field, the model correctly matchesnature. In a dune field with a limited amount of sand, thesimulated results resemble the empirically compiledknowledge, yet more theoretical and field studies arecalled for especially for strongly bi-directional windenvironments.Considering the difficulties in calculating wind flow over acomplex desert dune field, these simple and phenomenological models are thought to be very promising minimalmodels. It is shown that by introducing physics-basedmodifications into the algorithm, dunes more resemblingnature are produced.ReferencesCONCLUSIONBuilding on previous studies, this paper reports development of mathematical models that simulate desert dunefields based on discrete dynamics. Two simplifiedmechanisms have been employed: the sand transportinduced by wind and gravitational shaping. Thesimulations vividly demonstrate certain aspects of dunefields, and these are consistent with field observations.Anderson, M.G., (Ed.) (1988) Modelling Geomorphological Systems(John Wiley and Sons, Chichester), p 458.Bagnold, R.A. (1941) The Physics of Blown Sand and Desert Dunes(Methuen, London), p. 265.Bak, P. (1996) How Nature Works (Springer, New York), p. 212.Bak, P., Tang, C. and Wiesenfeld, K. (1987) “Self-organised criticality.An explanation of 1/f noise”, Physical Review Letters 59, 381 –384.Cooke, R.U., Warren, A. and Goudie, A.S. (1993) Desert Geomorphology (UCL Press, London), p. 526.de Castro, F. (1995) “Computer simulation of the dynamics of a dunesystem”, Ecological Modelling 78, 205–217.
MODELLING DESERT DUNE FIELDSEdgett, K.S. and Malin, M.C. (2000) “New views of Mars eolian activity,materials, and surface properties: three vignettes from the MarsGlobal Surveyor Mars orbital camera”, Journal of GeophysicalResearch 105, 1623–1650.Frank, A. and Kocurek, G. (1996a) “Toward a model for airflow on the leeside of aeolian dunes”, Sedimentology 43, 451–458.Frank, A.J. and Kocurek, G. (1996b) “Airflow up the stoss slope of sanddunes: limitations of current understanding”, Geomorphology 17,47– 54.Fryberger, S.G. (1979) “Dune forms and wind regime”, In: McKee, E.D.,ed, A Study of Global Sand Seas United States Geological Survey,Profession
Dome dune: an isolated, usually transverse dune with no slip face (Fig. 1(a)). Barchan dune: a free transverse dune with a crescentic plan-shape in which the crescent opens downwind (Fig. 1(b)). Transverse dune: dune ridges with crests transverse to the dominant wind, which migrate, for the most part, in the direction of the dominant wind (Fig .