Transcription
American Journal of Plant Sciences, 2013, 4, 1899-1910http://dx.doi.org/10.4236/ajps.2013.49233 Published Online September 2013 (http://www.scirp.org/journal/ajps)Sand Dune Species Distribution and Size Variations in TwoAreas Inside a Natural Protected Area Subjected toDifferent Human DisturbanceLoretta Gratani, Maria Fiore Crescente, Laura Varone, Emanuela Gini, Carlo Ricotta, Andrea BonitoDepartment of Environmental Biology, Sapienza University of Rome, Rome, Italy.Email: loretta.gratani@uniroma1.itReceived June 28th, 2013; revised July 30th, 2013; accepted August 15th, 2013Copyright 2013 Loretta Gratani et al. This is an open access article distributed under the Creative Commons Attribution License,which permits unrestricted use, distribution, and reproduction in any medium, provided the original work is properly cited.ABSTRACTSand dune species were analyzed across two areas included in the “Roman Coastal State Nature Reserve” (Italy): Ostia(O) and Marina di Palidoro (P). Significant variations in species distribution, dry mass and size over the gradient fromthe water-edge toward the inland between O and P were observed. Species colonize O, on an average, at 79 m from thewater-edge extended along the gradient toward the inland over a length of 26 m. PD is 40.8 9.9 plants·m 2. Ononisvariegata and Elymus farctus have the highest PD (15.4 1.3 plants·m 2), followed by Silene colorata and Sporobuluspungens (4.3 3.9 plants·m 2), by Cakile maritima, Echinophora spinosa, Eryngium maritimum, Ammophila arenaria,Anthemis maritima, Cyperus capitatus, Medicago marina and Calystegia soldanella ( 0.5 plants·m 2), with C.soldanella having the lowest PD (0.02 plants·m 2). On an average, in P, the species colonize the dune at 17 m from thewater-edge for a length of 46 m toward the inland, PD is on an average 21.5 16.1 plants·m 2. S. pungens, E. farctusand O. variegata have the highest PD (6.0 2.4 plants·m 2), followed by C. capitatus (2.1 4.7 plants·m 2), by S. colorata and A. maritima (0.4 0.1 plants·m 2) and by E. spinosa, E. maritimum, M. marina, Pancratium maritimum and C.soldanella (0.2 plants·m 2). The results underline a larger species presence along the gradient from the water-edge toward the inland in P site compared to O site where, on the contrary, plants exclusively colonize the inner dune area dueto the strong human disturbance which causes the foredune to become flat. Nevertheless, the presence of the most important autoctonous sand dune species (on an average, 15.3 0.5 species) can provide information for restoring theperturbed dune areas when preparing management strategies considering that the maintenance of coastal areas dependson the maintenance of native species.Keywords: Dune Vegetation; Human Disturbance; Plant Density; Organic Soil Matter1. IntroductionSome critical factors affect the survival and distributionof coastal sand dune species which grow on a physiologically dried substrate characterised by a low mineral content [1-4]. A factor which contributes to select dune species is the climatic effect on sand movements [5,6] suchas wind-speed entrainment thresholds for sand particlesand salt burial [7,8]. With regard to species assemblage,dune-builder plants may grow on fore-dunes, burial-tolerant plants on inter-dunes and shrubs on stabilizeddunes [9]. Morphological and physiological plant adaptations are important especially on fore-dunes [10-12]where few species are capable of withstanding the stressfactors imposed by limited environmental resources andrecurrent disturbance. On older dunes, where salt spray,Copyright 2013 SciRes.nutrient and water are no longer exclusive limiting factors, competition for space and light may affect speciesrichness [13-15]. Plant species presence is also related toorganic matter which varies from water-edge toward theinland [11,13].The ecological state of sea coasts is often criticalworldwide [16]. In Europe most of the well conservedcoastal dune areas are at present under protection [17]and are included in the EU Directive Habitat 92/43/CEE.Nevertheless, dunes are the most threatened habitats bythe expansion of urban areas and the development ofseaside tourism [9,18] leading to the fragmentation ofvegetation and the disappearance of vegetation bandsdeveloping on mobile dunes [19]. Disturbance is definedas a stochastic event in opposition to environmentalstress which is predictable and rather continuous [20].AJPS
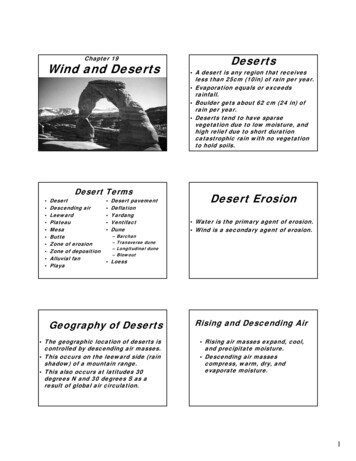
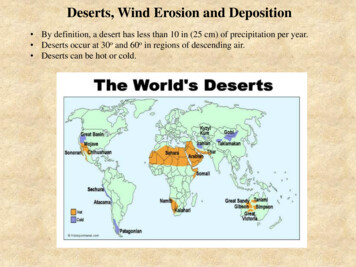
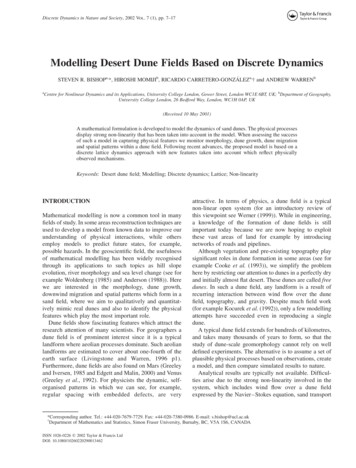
1900Sand Dune Species Distribution and Size Variations in Two Areas Inside a Natural ProtectedArea Subjected to Different Human DisturbanceMost common environmental stress factors are droughtand soil nutrient deficiency [21]. Among human disturbance, infrastructure development is widespread oncoasts in Europe. Furthermore, landscape fragmentationdisrupts large scale geo-morphological processes [22]and mechanical damages through trampling reduce oreven destroy vegetation [13]. Increased knowledge ofplant species response to stress factors (i.e. climate, soil,anthropogenic interference) aims at the long-term landuse planning to ensure sustainability of coastal resourceswhile providing management flexibility for the future[23].The main objective of this research was to compare thespecies presence in two areas included in a natural protected area developing along the Tyrrhenian coast nearRome and subjected to a different human disturbance.Considering the importance of biological diversity maintenance [24-27], we analyzed variations in sand dunespecies presence, dry mass and size over the gradientfrom the water-edge toward the inland.2. Methods2.1. The Study AreaThe study was carried out in the year 2012 in the RomanCoastal State Nature Reserve (Italian decree of 1996)which extended for ca 43 Km along the Tyrrhenian coastnear Rome (Italy). Two areas were selected: Ostia(41 41'00"N 12 22'39"E) and Marina di Palidoro(41 54'43"N 12 08'47"E) (Figure 1). Despite the twoareas being under protection, in recent years they weresubjected to human disturbance. In particular, Ostia (O)was a small populated city (85,301 people/km2, datafrom Rome Municipality for the year 2010) where numerous buildings and bathing establishments were builtin the last 50 years. Two sub-areas were selected formeasurements: O1 (41 40'58"N, 12 22'40"E) near a gully,extending along the coast line for ca 200 m, and O2(41 40'37"N, 12 23'14"E) near a bathing establishment,extending along the coastline for ca 400 m. At both O1and O2 the sand dune appeared flat up to 70 - 80 m fromthe water-edge, followed by a mobile dune area characterised by a moderate slope of ca 6%, which finishedwith the fixed dune colonized by Mediterranean shrubs.The distance from the water-edge to the shrubby layerwas 109 m and 100 m in O1 and O2, respectively. Dunespecies were present at 85 and 73 m from the water-edgein O1 and O2, respectively.Marina di Palidoro (P) was characterized by a lowerhuman disturbance than O because of few buildings andbathing establishments. Two sub-areas were selected in Pfor measurements: P1 (41 55'06"N, 12 08'17"E) near thehospital Bambino Gesù, extending along the coast linefor ca 1600 m, and P2 (41 54'43"N, 12 08'46"E) near ablock of flats, extending along the coast line for ca 700 m.In P1 and P2 the drift line and the foredune extendedalong the gradient from the water-edge toward the inlandfor ca 33 m and 41 m, respectively, was characterized bya moderate slope (ca 2%). Then it was followed by amobile dune area extending for ca 20 m and 32 m in P1and P2, respectively, and by the fixed dune with Mediterranean shrubs. The distance from the water-edge to theFigure 1. The two studied areas along the Thyrrenian coast near Rome, Ostia (O, 41 41'00"N, 12 22'39"E) and Marina diPalidoro (P, 41 54'43"N, 12 08'47"E), and the considered sub-areas (O1, O2, P1 and P2) are indicated.Copyright 2013 SciRes.AJPS
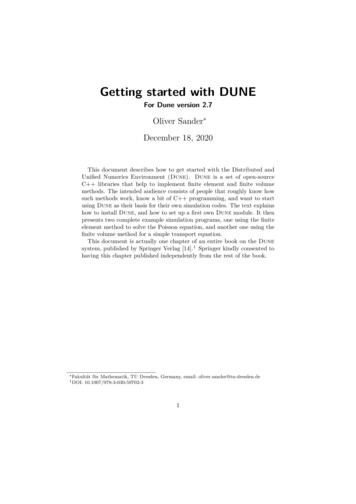
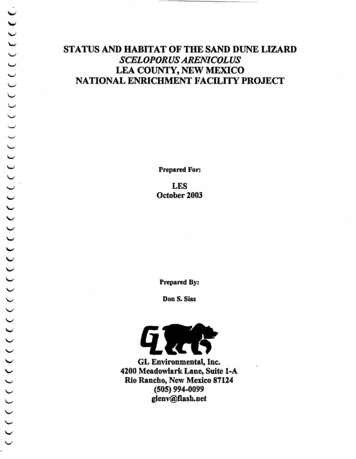
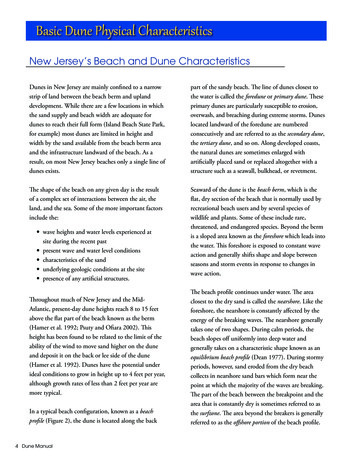
Sand Dune Species Distribution and Size Variations in Two Areas Inside a Natural ProtectedArea Subjected to Different Human Disturbanceshrubby layer was 53 m and 73 m for P1 and P2, respectively. Species were present at 20 and 15 m from the water-edge, in P1 and P2 respectively.A transect oriented from the water-edge toward theinland was established in each of the selected sub-areas(O1, O2, P1, P2) for vegetation sampling. Along eachtransect, plots (10 10 m each) were established, 3 mapart, starting from the water-edge to the inland (i.e.Mediterranean shrubby). Plot numbers were establishedin relation to the extension in length of the dune fromwater edge toward the inland and to species presence. Ineach sub-area the first plot was established where thefirst species presence occurred. In particular, two plotswere established in O1 (O1a, and O1b at 85 and 98 m fromthe water edge, respectively), O2 (O2a, O2b at 73 m and 86m from the water edge, respectively), and in P1 (P1a andP1b at 20 and 33 m from the water-edge, respectively),and four plots in P2 (P2a, P2b, P2c and P2d at 15, 28, 41 and54 m from the water-edge, respectively).2.2. Climate and MicroclimateThe selected areas were characterised by a Mediterranean1901type of climate. At O, the total annual rainfall was 589mm, the mean minimum air temperature of the coldestmonths (January and February) was 4.8 C and the meanmaximum air temperature of the warmest months (Julyand August) was 29.1 C (data from the MeteorologicalStation of Pratica di Mare, for the years 2000-2012)(Figure 2). At P, the total annual rainfall was 556 mm,the mean minimum air temperature of the coldest months(January and February) was 3.2 C and the mean maximum air temperature of the warmest months (July andAugust) was 29.6 C (data from the Meteorological Station of Fiumicino, for the years 2000-2012) (Figure 2).The dominant winds were from W and the others from Sand SE. The mean yearly winds speed was 16.6 knotsand 18.7 knots at O and P, respectively [28].Microclimate was measured in the considered sub-areas at 20, 40, 60, 80, 100 m from the water-edge towardthe inland, periodically (twice a month) during the studyperiod. In each sampling occasion, air temperature (T, C), relative air humidity (RH, %), total irradiance (I,μmol photon m 2·s 1) and wind speed (W, m/s) were recorded at 50 cm from the sand level. On each samplingoccasion, measurements were carried out at 12:00 a.m.Figure 2. Climate diagrams of Ostia (O) and Marina di Palidoro (P) (data from the Meteorological Station of Pratica di Mareand of Fiumicino, respectively, for the period 2000-2011). Total monthly rainfall (R, mm, columns), mean monthly air temperature (T, C, lines), annual mean temperature (Tann.mean) and total annual rainfall (Rtot) are shown.Copyright 2013 SciRes.AJPS
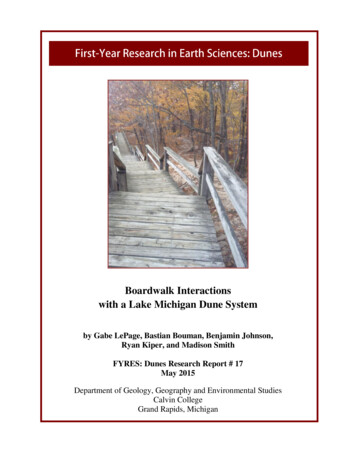
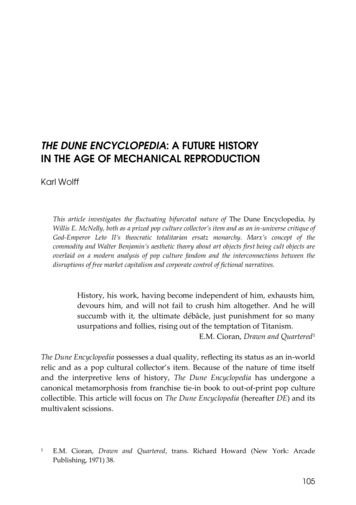
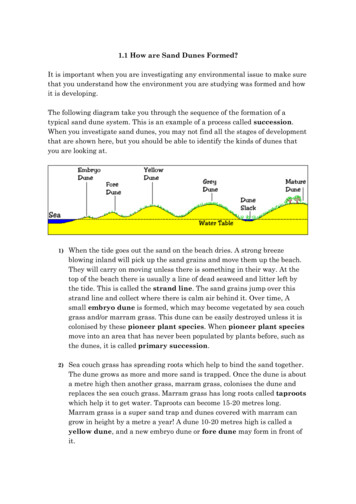
1902Sand Dune Species Distribution and Size Variations in Two Areas Inside a Natural ProtectedArea Subjected to Different Human DisturbanceAir temperature and air humidity were measured by athermo-hygrometer (HD8901, Delta Ohm, I), total irradiance by a radiometer (LI-185B with a 190SB Quantum Sensor, LI-COR, USA) and wind speed by an anemometer (LUTRON AM-4201).2.3. Sand CharacterizationTriplicate sand samples were collected in the consideredsub-areas at 20, 40, 60, 80, 100 m from the water-edge,for determination of sand water content (SWC, %), pH,soil organic matter (SOM, %) content and total nitrogen(N, %) content. All sand samples were collected at theend of May (at least 5 days after the last rainfall) at adepth of 40 cm by a drill. Sand samples were transportedimmediately to the laboratory. Sand samples were airdried at room temperature and then passed through 2 mmsieve. SWC was determined on sand samples (500 g each)as fresh sand minus dry sand divided by dry sand percent,calculated after oven-dried at 90 C to a constant mass. ThepH was measured with a glass electrode in a suspensionof sand in deionized water. SOM was determined colorimetrically with potassium dichromate, according to [29]and the N content by Kjeldahl method, according to [30].2.4. Plant Species Presence and Plant TraitsSpecies presence was recorded in the considered plotsfrom May to June, corresponding to the maximum plantbiomass [31,32]. The number of plants per species wascounted in each plot to calculate plant density (PD, individuals·m–2).Measurements of plant traits were carried out on representative plant species (5 plants per species in each plot)at the beginning of June. It included plant height (H, m),total plant volume per plot (V, cm3·m–2), total plant areaper unit of covered area at sand level (PA, cm2·m–2) andtotal aboveground plant biomass (TPB, g·m–2). Plantmaterial was harvested, oven dried and then weighed toobtain dry mass (DM, g), according to [33]. TPB perspecies was calculated by multiplying DM and PD. Hwas defined as the maximum vertical distance from thesand level to the highest point of the plant. V was calculated by the volume of a cylinder, according to [34].2.5. Statistical AnalysisThe main gradients in species composition were extracted by ordination (principal coordinate analysis,PcoA) which was performed on the plot-to-plot dissimilarity matrix and calculated with the Jaccard coefficientfor species presence and absence data.Differences of the means for the considered traits weretested by one-way ANOVA, and Tukey test for multiplecomparisons. Kolmogorov-Smirnov and Levene testsCopyright 2013 SciRes.were used to verify the assumption of normality and homogeneity of variances, respectively.All statistical tests were performed by using Statistica6.0 (Statsoft, USA). All data were shown as mean S.D.3. Results3.1. Microclimate and Sand CharacterizationThe microclimate of the considered sub-areas (P1 and P2and O1 and O2) is shown in Figure 3. In all the considered sub-areas, T increased by 15% from water-edge tothe inland, while RH and I decreased by 13%, 6% respectively (mean of P1, P2, O1 and O2). The wind (W)action decreased, on an average, 56% from water-edgetoward the inland, both in O and P sub-areas.The O and P sand characterization is shown in Figure4. In the considered sub-areas, SWC and pH decreasedon an average, 18% and 11% from the water-edge towardthe inland, respectively, while SOM and N content increased more than 100% and 113%, respectively (meanof O and P).3.2. Plant TraitsData on species presence, PD, H, V, PA and TPB in theconsidered plots are shown in Table 1. The number ofspecies was larger in P (15.5 0.5, mean of P1 and P2plots) than in O (14.5 0.5, mean of O1 and O2 plots). Alarger PD was monitored in P1b, and P2c, (37.7 3.1plants·m–2, mean value) and in O1b and O2b (48.8 0.15plants·m–2, mean value) than in the other plots (22.1 14.3 plants·m–2, mean value). Crucianella maritima (PD 0.53 plants·m–2, mean value) was monitored only in P2d.The plots farer from the water-edge had a higher H thanthose closer to it. In particular, H was on an average 59%higher in O1b than in O1a and 70% higher in O2b than inO2a. H was 41% higher in P1b than in P1a, and 74% higherin P2c and P2d than in P2a and P2b. On an average, PA was82% larger in O1b than in O1a and 94% larger in O2b thanin O2a. PA was 266% larger in P1b than in P1a, and 577%larger in P2c and P2d than in P2a and P2b. TPB ranged from1145.8 g·m–2 (in O) to 1413.0 g·m–2 (in P) and it was thehighest in O2b (304.9 g·m–2) among O plots, and in P2d(394.4 g·m–2) among P plots.As regards to the species, E. farctus had the highestTPB and V (141.6 62.2 g·m–2 and 19837 8885cm3·m–2 respectively, mean of the considered P and Oplots) and Chamaesyce peplis the lowest one (0.008 0.010 g·m–2 and 1.9 2.1 cm3·m–2 respectively, mean ofthe considered P and O plots).3.3. Principal Coordinate AnalysisPCoA extracted two factors accounting for 53.33% of theAJPS
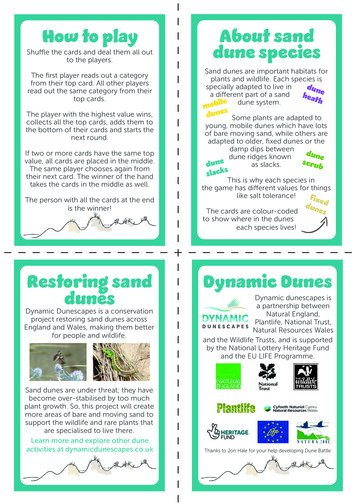
Sand Dune Species Distribution and Size Variations in Two Areas Inside a Natural ProtectedArea Subjected to Different Human Disturbance1903Figure 3. Air temperature (T, C), relative air humidity (RH, %), total irradiance (I, μmol photons m–2·s–1) and wind speed(W, m·s–1) measured at 50 cm from the sand level, at 12:00 a.m., in the considered sub-areas at Ostia (O1, O2) and at Marinadi Palidoro (P1 and P2). Measurements were carried out at 20, 40, 60, 80, 100 m from water-edge. Mean values standarddeviation are shown. For each sub-area different letters indicate significant differences among the distances over the gradientfrom the water-edge toward the inland.Copyright 2013 SciRes.AJPS
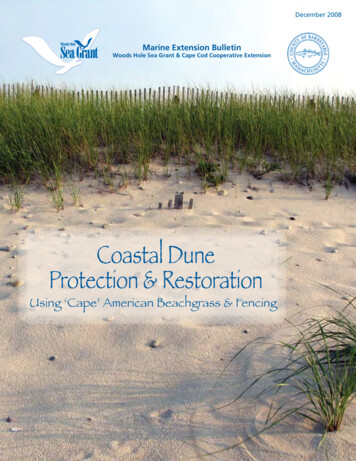
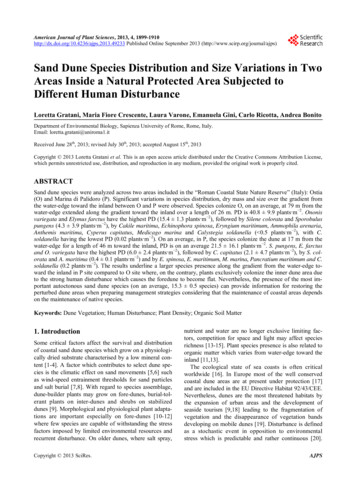
1904Sand Dune Species Distribution and Size Variations in Two Areas Inside a Natural ProtectedArea Subjected to Different Human DisturbanceFigure 4. Sand water content (SWC, %), pH, soil organic matter (SOM, %) and total nitrogen content (N, %) collected in theconsidered sub-areas in Ostia (O1, O2) and Marina di Palidoro (P1 and P2) at 20, 40, 60, 80, 100 m from water-edge. Meanvalues standard deviation are shown. For each distance over the gradient from the water-edge toward the inland sub-areadifferent letters indicate significant differences among the sub-areas.Copyright 2013 SciRes.AJPS
Sand Dune Species Distribution and Size Variations in Two Areas Inside a Natural ProtectedArea Subjected to Different Human Disturbance1905Table 1. Data on species presence, plant density, plant height, plant area, plant volume and total plant biomass of theconsidered plots used in this study. For each species different letters indicate significant differences among the plots.Distance (m)PlotSpecies85 - 9598 - 10873 - 8386 - 9620 - 3033 - 4315 - 2528 - 3841 - 5154 - 64O1aO1bO2aO2bP1aP1bP2aP2bP2cP2d 2PD (plant·m ) 2PD (plant·m ) 2 2PD (plant·m )PD (plant·m )Cakile maritima Scop.0.01 a--0.01 a0.02 a-0.88 b-0.02 a-Echinophora spinosa L.0.05 a0.12 b0.07 a0.11 b0.02 a0.07 a-0.02 a0.16 c0.25 dEryngium maritimum L.Elymus farctus (Viv.) Runemarkex MelderisAmmophila arenaria (L.) Link-0.01 a-0.10 b0.07 ab0.03 a-0.15 c-0.15 c18.60 a12.09 b20.70 a14.00 b11.85 b5.15 c-9.00 d13.15 b5.04 c-1.16 a-0.80 ac-0.14 b--0.54 c-Anthemis maritimaL.0.26 a0.39 b0.14 a0.58 b0.05 c1.36 d--0.18 a0.59 b-0.59 ab-0.31 a-0.79 b---11.75 cOnonis variegataL.0.14 a28.3 b-29.40 b-13.25 c---6.02 dMedicago marinaL.-0.15 a0.02 b0.02 b-0.04 b---0.12 aCyperus capitatus Vand.---------0.53Calystegia soldanella(L.) R. Br.0.02a----0.03 a---0.06 bSporobolus pungens(Schreb.) Kunth16.55a2.85 b7.85 c1.20 d-13.00 e-0.15 f25.75 g5.50 cSilene colorataPoir.0.71a3.10 b0.04 c2.45 b-0.92 d---1.43 e-0.01a-0.01 a0.03 ac0.71 b--0.01 a0.05 cSalsola kaliL.0.12a-0.01 b-0.02 b-0.07 c0.12 a0.04 bc-Chamaesyce peplis (L.) Prokh.0.01a-0.01 a-0.01 a---0.08 31.46Cakile maritima Scop.22.0 a16.5 d-19.3 dEchinophora spinosa L.Crucianella maritimaL.Pancratium maritimumL.H (cm)H (cm)--40.6 a36.5 a29.5 b-22.5 a-H (cm)35.0 bH (cm)11.5 c--29.1 b10.8 c21.0 d-28.5 b26.6 b17.2 e26.4 b21.8 ac19.3 c-12.3 d-24.9 abEryngium maritimum L.Elymus farctus (Viv.) Runemarkex MelderisAmmophila arenaria (L.) Link43.0 a43.0 a40.5 a64.8 b43.7 a43.5 a-53.7 c44.0 a41.0 a-92.5 a-105.0 b-28.0 c--108.1 b-Anthemis maritimaL.16.3 a16.9 ab19.5 b14.6 a13.1 a17.4 ab--20.2 b13.3 a-39.0 a-37.8 a-36.0 a---44.5 bOnonis variegataL.10.1 a11.5 a-9.5 a-9.5 a---11.5 aMedicago marinaL.-12.4 a7.8 b9.3 b-12.6 a---15.6 aCrucianella maritimaL.---------18.2Cyperus capitatus Vand.3.5 a----3.5 a---6.5 bSporobolus pungens(Schreb.) Kunth19.0 ac19.0 ac17.0 a16.0 a-10.5 b-10.1 b11.0 b21.5 cSilene colorataPoir.14.0 a15.5 a20.0 b14.5 a-14.0 a---20.0 b-15.5 a-17.0 a10.6 b28.5 c--38.0 d41.7 dSalsola kaliL.10.4 a-9.8 a-2.3 b-2.0 b2.3 b2.4 b-Chamaesyce peplis (L.) Prokh.4.0 a-4.5 a-2.0 b---2.4 tegia soldanella(L.) R. Br.Pancratium maritimumL.PA (cm2·m 2)Cakile maritima Scop.15.00 aEchinophora spinosa L.136.45 a 321.71 bPA (cm2·m 2)13.35 a4.00 b-352.00 c-99.63 c 158.77 d3.14 e22.02 f-4.50 e-49.28 d672.00 a 423.15 b 724.50 a 490.00 b 414.75 b180.25 c-315.00 d 460.25 b 176.40 c3.38 b--181.03 cAnthemis maritimaL.413.90 a 524.19 b 358.68 a 654.05 c 187.08 d 1415.94 e--626.01 c 887.86 f--Copyright 2013 SciRes.-28.08 ab-231.43 b-10.59 c29.05 a-81.63 d232.55 g 109.86 c22.79 c-4.02 a-PA (cm2·m 2)Eryngium maritimum L.Elymus farctus (Viv.) Runemarkex MelderisAmmophila arenaria (L.) LinkCyperus capitatus Vand.--PA (cm2·m 2)20.00 a14.64 a-37.68 b--104.26 e564.00 cAJPS
1906Sand Dune Species Distribution and Size Variations in Two Areas Inside a Natural ProtectedArea Subjected to Different Human DisturbanceContinuedOnonis variegataL.41.99 a707.50 b-735.00 b-331.25 c---138.00 dMedicago marinaL.-507.74 a12.56 b97.50 c-104.8 c---495.73 a---------498.450.29 a----1.05 a---11.00 b22.80 b62.80 c9.60 d-104.00 e-1.20 f206.00 g44.00 c4.26 a18.60 b0.21 c14.70 b-5.49 a---8.55 d-1.63 a-2.72 a1.47 a101.52 b--14.23 c65.89 d0.82 a-0.08 b-0.10 b-1.48 c0.96 a0.38 d-Crucianella maritimaL.Calystegia soldanella(L.) R. Br.Sporobolus pungens(Schreb.) Kunth 136.80 aSilene colorataPoir.Pancratium maritimumL.Salsola kaliL.Chamaesyce peplis (L.) Prokh.Total0.16 a-0.29 a-0.28 a---2.12 70.941804.203104.01V (cm3·m 2)V (cm3·m 2)330.0 a467.1 b46.0 c-5808.0 d-1571.3 e-Echinophora spinosa L.5543.3 a 11742.2 b 2941.2 c 4626.5 d33.8 e461.5 f-128.3 g6194.0 h1892.8 i495.8 c606.9 e-2598.5 fEryngium maritimum L.Elymus farctus (Viv.) Runemarkex MelderisAmmophila arenaria (L.) Link204.8 d-28896.0 a 18195.5 b 29342.3 a 31752.0 a 18106.8 b 7840.9 c-Anthemis maritimaL.6736.7 a 8862.5 b 7008.6 a 9569.7 b-90.5 a-V (cm3·m 2)Cakile maritima Scop.--V (cm3·m 2)2686.7 a--6114.4 b2100.0 a-94.5 b-19576.7 c-12629.8 e 11801.1 e---1095.1 ab-552.7 b-1356.5 a---25098.0 c425.6 a8136.3 b-6982.5 b-3146.9 c---1587.0 dMedicago marinaL.-6315.7 a97.3 b901.9 c-1320.4 d---7736.9 aCrucianella maritimaL.---------9090.7Cyperus capitatus Vand.Ononis variegataL.Calystegia soldanella(L.) R. Br.1.0 a----3.7 a---71.5 b433.2 b1067.6 c153.6 d-1092.0 c-12.1 e2266.0 f946.0 c59.6 a288.3 b4.2 c213.2 b-76.9 a---171.0 dSporobolus pungens(Schreb.) Kunth 2599.2 aSilene colorataPoir.2447.6 c 24605.4 d-16915.5 b 20251.0 b 7232.4 c-25.2 a-46.2 a15.6 a2893.3 b--540.7 c2747.5 bSalsola kaliL.8.6 a-0.8 b-0.2 b-3.0 c2.3 c0.9 b-Chamaesyce peplis (L.) Prokh.0.6 a-1.3 a-0.6 a---5.1 17665.063035.370973.5Pancratium maritimumL.TotalTPB (g·m 2)TPB (g·m 2)Cakile maritima Scop.0.250 a--0.222 aEchinophora spinosa L.4.107 a9.683 b2.999 c4.779 a-0.257 a-14.808 bTPB (g·m 2)0.067 bTPB (g·m 2)-5.870 c0.120 e1.460 c-1.361 d-0.662 f-0.120 e7.000 g3.307 cEryngium maritimum L.Elymus farctus (Viv.) Runemarkex MelderisAmmophila arenaria (L.) Link0.678 ac-3.155 d-6.671 e216.318 a 140.607 b 240.741 a 162.820 b 137.816 b 59.895 c-104.67 d 152.935 b 58.615 cAnthemis maritimaL.27.417 a 34.724 b 23.760 a 43.325 c-20.308 a-13.984 a-2.360 c--126.574 d-12.393 d93.795 e--41.468 c58.814 f--69.560 c-10.294 d33.947 a-3.463 ab-1.806 a-4.647 b-Ononis variegataL.2.872 a48.393 b-50.274 b-22.658 c-Medicago marinaL.-34.770 a0.860 b6.677 c-7.177 c------------41.3350.007 a----0.025 a---0.262 bCyperus capitatus Vand.Crucianella maritimaL.Calystegia soldanella(L.) R. Br.Sporobolus pungens(Schreb.) Kunth 15.391 a2.651 b7.301 c1.116 d-12.090 e-0.140 f23.948 g5.115 bc0.234 a1.023 b0.012 c0.809 bd-0.630 de---0.470 ae-2.614 a-4.375 b2.316 a163.306 c--0.047 cd-0.006 a-0.006 a-0.084 b0.063 bcSilene colorataPoir.Pancratium maritimumL.Salsola kaliL.22.888 d 105.987 e0.022 d-Chamaesyce peplis (L.) Prokh.0.002 a-0.003 a-0.003 a---0.023 .954108.150376.218394.378Copyright 2013 SciRes.AJPS
Sand Dune Species Distribution and Size Variations in Two Areas Inside a Natural ProtectedArea Subjected to Different Human Disturbancetotal variance. Factor 1 and 2 accounted for 34.80% and18.53% of the total variance, respectively. The first factor reflected the turnover of the vegetation along thesea-inland vegetation zonation, with higher scores of thefactor indicating species closer to the water-edge. Variation in species composition among plots was greater inthe longer and less disturbed transect of P (P2) as underlined by a greater dispersion of the plots in this sub-areaalong the second ordination axis (Figure 5).4. DiscussionThe natural vegetation of the Tyrrhenian coast whichincludes “The Roman Coast State Nature Reserve” untilthe years 1970-1980 was characterised by differentvegetation bands. In particular, after the aphytoic dunearea, the first community on the strandline was characterized by Ca. maritima, E. peplis and Salsola kali, followed by a second community on the foredune with E.farctus, S. pungens, and C. capitatus. The third community which contributed to dune consolidation was characterized by A. arenaria, E. spinosa, O. variegata, E.maritimum and M. marina and the inner community byCr. maritima and P. maritimum, followed by the Mediterranean maquis [9,35].In stressful environments, species are patchily distributed [36-38], however, spatial species aggregation may alsobe caused by within-community environmental heterogeneity and preference for common micro-habitats [39].1907Our results on the whole show significant variations ofspecies presence and density between Ostia and Marinadi Palidoro in response to the different human disturbance. The strong human disturbance at Ostia is the result of the large presence of beach establishments, numerous buildings, the intense use of mechanical means toclean the area and a strong human trampling all year long,which have largely altered the sand dune, and in particular the foredune. In response to these factors, speciescolonize the dune area, on an average, at 79 m from thewater-edge (mean of O1 and O2) extending along the gradient toward the inland over a length of 26 m (meanvalue). PD is 40.8 9.9 plants·m–2 (mean of all the considered O plots). In particular, O. variegata and E. farctus have the highest PD (15.4 1.3 plants·m–2 meanvalue), followed by S. colorata and S. pugens (4.3 3.9plants·m–2, mean value), by Ca. maritima, E. spinosa, E.maritimum, A. arenaria, A. maritima, C. capitatus, M.marina and C. soldanella (lower than 0.5 plants·m–2). C.soldanella is a prostrate plant with long rhizomes thatsurvives seawater inundation better than many other species [40] which causes the aerial parts to die but the buried rhizome may survive. This species co-occurs with E.farctus in many other foredune areas in Europe [41]. Hand TPB vary from 18.3 m to 31.6 m and from 266.7g·m–2 to 305.0 g·m–2, respectively.The lower human disturbance at P in respect to O, determines the species presence, on an average, at 14.5 mfrom the water-edge extending along the gradient towardFigure 5. Ordination diagram of the considered plots for Ostia (sub-areas O1 and O2) and Marina di Palidoro (sub-areas P1and P2). The variance associated to the first two axes of the principal coordinate analysis is 34.80% and 18.53%, respectively.Copyright 2013 SciRes.AJPS
1908Sand Dune Species Distribution and Size Variations in Two Areas Inside a Natural ProtectedArea Subjected to Different Human Disturbancethe inland for a length of 61 m (mean value) and PD is21.5 16.1 plants·m–2 (mean of all the considered Pplots). In particular, S. pungens, E. farctus and O. variegata have the highest PD (6.0 2.4 plants·m–2, meanvalue), followed by C. capitatus (2.1 4.7 plants·m–2,mean value), by S. colorata and A. maritima (0.4 0.1plants·m–2, mean value) and by E. spinosa, E. maritimum,M. marina, P. maritimum and C. soldanella (lower than0.2 plants·m–2). E. farctus and A. arenaria are rhizomatous species, with this last being the most importantsand-fixing species with positive effects on sand stability[18,34,42] and the mycorrhizal symbiosis playing an important role in the growth [43,44].The results underline the larger species presence alongthe gradient from the water-edge toward the inland in Pcompared to O where, on the contrary, plants exclusivelycolonize the inner areas due to the strong human disturbance which causes the fore-dune to become flat. Moreover, P2, characterised by a relatively lower disturbancethan P1, has a 72% higher PD and a species distributionover a longer strip from water-edge toward the inland (53and 73 m in P1 and P2, respectively). The study underlines the ability of the considered sand dune species tocolonize the inner patch where microclimate and soilconditions are more favourable (by a 56% lower windaction and 12% higher SOM content, mean of the considered O and P plots) than the areas closer to the wateredge. In response to the more favourable conditions, Hincreases by 62% in the plots further from the wateredge.species grow at O1, O2, P1 and P2, respectively) can provide information for restoring the perturbed dune areaswhen preparing management strategies. In particular, A.arenaria could have a positive effect on sand dune stabilization by contributing to plant colonization under favourable conditions [48]. It must be emphasized thatspecies diversity and recovery capacity depend mostly onthe undisturbed sand deposits in the foredunes by thelimitation of human trampling and use of mechanicalmeans and infrastructure development. This could favorsand deposits and consequently the species shift from theinland toward the water-edge, thus maintaining thecoastal areas and their ecosystem services.REFERENCES[1]G. M. da Silva, P. Hesp, J. Peixoto and S. R. Dillenburg,“Foredune Vegetation Patterns and Alongshore Environmental Gradients: Mocambique Beach, Santa Catarina Island, Brazil,” Earth Surface Processes and Landforms,Vol. 33, No. 10, 2008, pp. 1557-1573.http://dx.doi.org/10.1002/esp.1633[2]A. Debez, K. B. Hamed, C. Grignon and C. Abdelly,“Salinity Effect on Germination, Growth, and Seed Production of the Halophyte Cakile maritime,” Plant andSoil, Vol. 262, No. 1-2, 2004, pp. 4.47247.67[3]F. A. Donnelly and N. W. Pammenter, “Vegetation Zonation on
the sand dune appeared flat up to 70 - 80 m from the water-edge, followed by a mobile dune area charac- terised by a moderate slope of ca 6%, which finished with the fixed dune colonized by Mediterranean shrubs. The distance from the water-edge to the shrubby layer was 109 m and 100 m in O. 1. and O. 2, respectively. Dune