Transcription
GEOMOR-02904; No of Pages 14ARTICLE IN PRESSGeomorphology xxx (2009) xxx–xxxContents lists available at ScienceDirectGeomorphologyj o u r n a l h o m e p a g e : w w w. e l s ev i e r. c o m / l o c a t e / g e o m o r p hLong-time evolution of models of aeolian sand dune fields: Influence of duneformation and collisionSerina Diniega a,⁎, Karl Glasner b, Shane Byrne cabcProgram in Applied Mathematics, The University of Arizona, 617 N. Santa Rita Ave., P.O. Box 210089, Tucson, AZ, 5 85721-0089, USADepartment of Mathematics, University of Arizona, USADepartment of Planetary Sciences, University of Arizona, USAa r t i c l ei n f oArticle history:Received 18 July 2008Received in revised form 8 December 2008Accepted 6 February 2009Available online xxxxKeywords:Sand duneDune fieldDune field modelDune collisionCoarseningCoalescencea b s t r a c tTheoretical models which approximate individual sand dunes as particles that move and interact via simplerules are currently the only viable method for examining whether large dune fields will evolve into apatterned structure. We find that these types of simulations are sensitive to the influx condition andinteraction function, and are not necessarily robust under common assumptions. In this paper, we reviewcontinuum dune models and how they connect to models of dune fields that approximate dunes asinteracting particles with collision and coalescence dynamics. This type of simple dune field model isexamined under different boundary and initial conditions. We identify different long-term behaviorsdepending on model parameters as well as the way in which dunes are initialized and collide. A “rule” forpredicting the end state of a modelled dune field is derived, based on the statistics of a uniform influx dunesize distribution and the interaction function. Possible future adjustments to the multiscale model, such asthe use of a Gaussian influx dune size distribution, and their effect on the prediction rule are also discussed. 2009 Elsevier B.V. All rights reserved.1. IntroductionMany dune fields appear to exhibit regular patterns (Bishop, 2007),indicating they may evolve through a process of self-organization(Werner, 1995; Kocurek and Ewing, 2005). Continuum dune modelswhich examine the evolution of one or a few dunes, however, showthat individual dunes are unstable with respect to changes in the sandflux, which implies that dunes in a field, evolving only through sandflux, should eventually coalesce into a small number of large dunes(Hersen et al., 2004). Thus, steady-state fields of similarly sized andsize-limited dunes should not form, unless other stabilizing processesare also at work. For example, variations in wind strength anddirection can destabilize large dunes and may play a major role for sizeselection in dune fields (Elbelrhiti et al., 2005). However, suchprocesses are often stochastic or dependent strongly on localenvironmental conditions, and, thus, are difficult to incorporate intogeneric analysis or simulation of dune fields.One mechanism that has been proposed to regulate dune size andspacing, and that depends on sand and dune dynamics broadlycommon to all dune fields, is dune collision. When dunes collide, sandis redistributed between the dunes. As long as the net sand exchangeis from the large to the small dune, it would be possible for a dune fieldto evolve into a patterned structure after many collisions (Hersen and⁎ Corresponding author. Tel.: 1 520 326 0481; fax: 1 520 626 5048.E-mail addresses: serina@math.arizona.edu (S. Diniega),kglasner@math.arizona.edu (K. Glasner), shane@lpl.arizona.edu (S. Byrne).Douady, 2005). To evaluate this premise, one might consider applyinga continuum model to a field consisting of hundreds of dunes. Becauseof the large temporal and spatial scales involved and currenttechnology limitations, however, this is not feasible.To understand how a dune field evolves through collisions, amultiscale approach is needed. This involves using a continuum modelto investigate the evolution of single dunes and the interaction of two(or a few) dunes. The large scale model is then constructed byregarding dunes as particles, and using the continuum model resultsto construct phenomenological rules to prescribe the motion andinteraction of the particles.Various studies of transverse (Parteli and Herrmann, 2003; Leeet al., 2005) and barchan (Lima et al., 2002) dune fields have utilizedthis type of approach. These studies make predictions about dunespacing and size trends, and compare results with observed dunefields. Our purpose here is to generalize these models to determinehow robust the conclusions are.The results of this study will: (i) aid dune field modelers as theydesign their models, (ii) aid planetary scientists and geologists inbetter interpreting the results of dune field models by helping themunderstand how structural elements can (perhaps unintentionally)influence results, and (iii) emphasize that more observational andexperimental data about dune formation and interaction is needed tohelp constrain/calibrate dune field models.This paper consists of two parts: we first describe how to build amultiscale model by using a continuum dune model (Section 2.1, 2.2)to examine the effects of dune collisions (Sections 2.3, 2.4). Compiling0169-555X/ – see front matter 2009 Elsevier B.V. All rights reserved.doi:10.1016/j.geomorph.2009.02.010Please cite this article as: Diniega, S., et al., Long-time evolution of models of aeolian sand dune fields: Influence of dune formation andcollision, Geomorphology (2009), doi:10.1016/j.geomorph.2009.02.010
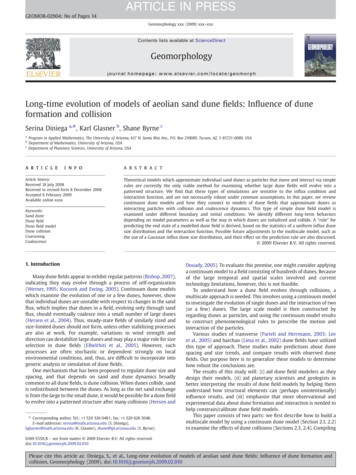
ARTICLE IN PRESS2S. Diniega et al. / Geomorphology xxx (2009) xxx–xxxthe results of many dune collision simulations, we create aninteraction function to predict the results of any dune collision fromthe sizes of the colliding dunes. Although the derived interactionfunction yields only coalescence-dominated dynamics (Section 2.5),its construction and overall form serves as the basis of how a genericinteraction function should appear. Finally, we define the variousassumptions and parameters which go into our collision-dynamicsdune field model (Section 3).In the second part of this paper, we first outline the differentoutcomes of dune field models (Section 4.1). We then test for theinfluence that various components of a dune field model have on thoseoutcomes: exact interaction function form (Section 4.2), boundarytype (Section 4.3), and initial/influx conditions (Section 4.4). Afteridentifying the two important parameters, a statistical analysis of theprobability that any single interaction will result in more similarlysized dunes yields predictions about whether a dune field model willresult in a regular pattern (Section 4.5). Finally, results are summarizedand physical implications are discussed (Section 5).Fig. 1. Schematic diagram showing the variables that are computed in a continuumdune model: dune topography separation bubble/shadow zone saturated sand flux(via shear stress calculation) actual sand flux dune topography. This diagram is theresult of a simulation run, with the vertical scale of each parameter exaggerated forclearer superposition.2. Continuum models and dune collisionsThe multiscale approach used in this study involves two scales:(i) the continuum dune model is used to observe the behavior of oneor a few dunes; (ii) these observed behaviors are then used as thebases of phenomenological rules governing the migration andinteraction of particle dunes in the dune field model. Thus, althoughthe main focus of this paper is on results of the large scale (dune field)model, to validate this approach we will first outline the smaller-scale(continuum dune) model and its use in investigating dune collisions.2.3.2.1. Continuum modelingThe seminal work of Sauermann et al. (2001) is the basis for mostcurrent continuum models of the formation and evolution of sanddunes. This study constructed a two-dimensional model whichconsidered the evolution of a wind-driven sand flux layer over adune, and exchanges between this layer and the dune itself. Its mainimprovement over previous models (Stam, 1996) was the inclusion ofa spatial delay (the saturation length) over which the sand fluxevolved toward the carrying capacity of the wind. The inclusion of thisspatial delay, which had first been observed and measured by Bagnold(1941), fixed the unphysical anchoring/lengthening of the foot of thedune seen in previous models, as well as provided a characteristiclength scale related to minimal dune size. Later refinementsconsidered linearized versions of the equations (Kroy et al., 2002;Andreotti et al., 2002b) as well as extension to 3-dimensions (Hersen,2004).Although these continuum models have been successfully used inmany studies of isolated dune formation (Section 2.2), one drawbackto the continuum models is the large number of constitutive equationsthat must be specified. In developing our own two-dimensionalcontinuum dune model, we have endeavored to identify theingredients which have a significant quantitative effect on results.With respect to these ingredients (which are outlined below,illustrated in Fig. 1, and given in equation-form in Appendix A), ourmodel deviates little from assumptions used in other continuum dunemodels:1. The profile of the near-surface airflow is entirely a function oftopography. This profile takes into account airflow separation inregions downwind of sharp changes in slope (sometimes called‘shadow zones’), such as in the lee of the crest of the dune. In theseshadow zones, slow air recirculation is not strong enough totransport sand; sand free falls, forming a slip face. The boundary ofthe shadow zone, the ‘separation bubble,’ extends downwind fromthe crest of the dune to the point where it is assumed that aeolian4.5.sand transport resumes (Sauermann et al., 2001). While the preciselocation of flow separation can only be found through fluid dynamiccalculations over the detailed dune topography, it is sufficient tophenomenologically approximate this region (Sauermann et al.,2003). We take this route in our continuum model and base ourseparation bubble shape on studies of airflow over simple dune-likegeometries (Schatz and Herrmann, 2005).Using this airflow profile, the shear stress exerted by the wind ontothe dune's surface is calculated. The most common approach tocomputing the shear stress is a linearized approximation for smalltopography gradients, resulting in a straightforward analyticalexpression (Jackson and Hunt, 1975). In the shadow zones, thenear-surface wind is negligible so the shear stress is generallyassumed to be zero.The wind′s shear stress is used to calculate the saturated sand flux,which is the equilibrium amount of sand the wind could move ifthe wind velocity and topography were homogenous. The actualflux experiences a downwind spatial delay (called the saturationlength) in comparison to the saturated flux. This calculation alsotakes into account the lack of sand deposition or erosion on hard,non-erodible surfaces like bedrock.The dune topography changes via mass conservation with the sandflux.An avalanche-type process forces the dune topography slope to‘instantaneously’ adjust to be at or below the angle of repose. Insome models (Kroy et al., 2002), this is done by running a separatesimulation update after each time-iterative update on the topography, which drops the slope down to or below the angle ofrepose. In this model, the dune slope is updated concurrently withthe mass conservation step by including ‘diffusion’ of the dune inthe mass conservation equation. The diffusion coefficient is set verylarge when the slope of the dune exceeds the angle of repose, andvery small otherwise, with exact values of the diffusion coefficientchosen based on related timescales, to preserve the ‘instantaneous’nature of avalanches compared to all other processes.2.2. Evolution of isolated dunesContinuum dune models have been used to quantitively connectdune characteristics to environmental conditions (like sand supplyand wind strength) and physical processes (like saltation). Forexample, studies of isolated dune evolution are able to replicatereasonable dune profiles of many sizes and types (e.g., the twodimensional profiles shown in Fig. 2, three-dimensional barchanshapes created by (Hersen, 2004)) through consideration of howmuch sand is available and how the sand is transported. Observedrelations, like the inverse relationship between dune height andvelocity (Bagnold, 1941), are also replicated and explained.More recently, the models have been used to study the influencesof wind and sand flux on details of dune morphology (Herrmann et al.,2005; Parteli et al., 2006a) and the influence of vegetation andinduration in stabilizing dunes (Herrmann et al., 2008). Additionally,Please cite this article as: Diniega, S., et al., Long-time evolution of models of aeolian sand dune fields: Influence of dune formation andcollision, Geomorphology (2009), doi:10.1016/j.geomorph.2009.02.010
ARTICLE IN PRESSS. Diniega et al. / Geomorphology xxx (2009) xxx–xxx3Fig. 2. Sample steady-state two-dimensional terrestrial aeolian dune profiles calculatedthrough numerical simulations. Different dune cross-sectional areas are shown, from aroughly minimal sized transverse dune (dunes with height less than 1 m consist of aconvex windward slope with no slipface) to a dune 14 m in height. Note that the verticalaxis is exaggerated — the average windward slope for these profiles is 8–16 .many studies have examined the characteristic scaling of duneformation and evolution in different environments, such as underwater or on Mars (Claudin and Andreotti, 2006; Parteli and Herrmann,2007).2.3. Dune interactionsTo connect the two scales (dune evolution and dune fieldevolution), we initialized our continuum dune model with twodunes of specified size, the smaller located upwind of the larger. Theinitial dune profiles were steady-state profiles calculated duringsimulations of isolated dune formation. The initial dune spacing waschosen by testing for the minimal distance at which no changes in sizeoccurred immediately in the downwind dune because of the presenceof the upwind dune (because of changes in its shear stress and, thus,sand flux calculation). To eliminate a dependence on the sand influxrate (which does appear to influence dune migration and morphology), periodic boundary conditions were used.In these simulations, the upwind (and smaller, thus faster) dunecatches up to the downwind dune. As the shadow zone of the upwinddune impinges upon the foot of the downwind dune, sand in the footof the downwind dune is not transported by the wind and so is leftbehind and is eventually absorbed by the upwind dune. As thedownwind dune loses sand, its profile gradually becomes shorter,which causes its velocity to increase. Similarly, the upwind dune gainssand, becomes taller, and decreases its velocity. Eventually, theupwind dune begins to climb the downwind dune and the twodunes would lose their distinct shapes and form an amorphous twohumped dune-complex. Sand continues to be exchanged and thehumps change in height (the upwind hump grows and the downwindhump shrinks) while moving toward, then (once the downwind humpwas the smaller of the two) away from each other (Fig. 3).Simulations were run with combinations of dunes with cross-sectionalareas of 10–400 m2 (corresponding to initial heights of 1–15 m),and dune pairs were categorized by the resultant type of interaction(Fig. 4).We noted two qualitatively distinct outcomes: (1) coalescenceresulted when the downwind hump subsided into the dune complex,resulting in one unified dune, and (2) ejection occurred when thedownwind hump managed to separate completely, resulting in anexchange of material between the colliding dunes. In a small numberof cases, the downwind hump managed to separate but was too smallto remain stable and so would eventually disappear. We initiallyexamined this case separately, but because it occurred in only a smallnumber of cases, we reclassified it as an extreme case of ejection.Fig. 3. Schematic diagram illustrating a dune collision. The topography/dune profiles areoutlined in black, and the separation bubble is outlined in gray. The horizontal arrowsshow relative dune motion and the vertical arrows show changes in dune height. Fromtop to bottom: 1. The upwind (smaller) dune approaches the downwind dune.2. Eventually its separation bubble impinges upon the foot of the downwind dune,arresting that sand. 3. As the upwind dune continues to move toward the downwinddune, it gains sand that the downwind dune leaves behind. 4. As the upwind dunegrows and the downwind dune shrinks, their relative crest height reverses, allowing thedownwind dune to migrate faster than the upwind dune. 5. If the downwind dune losesall of its sand before it can migrate away, then we have coalescence. Otherwise, we havean ejection case.Plotting the different types of dune interactions as a function of thesizes of the colliding dunes (downwind cross-sectional area: Abefore vs.upwind cross-sectional area: abefore b Abefore, Fig. 4), it can be seen thatthe boundary between coalescence and ejection cases (i.e., theintermediary disappear cases) roughly follows a straight line passingthrough the origin. Along that line the size ratio between the twodunes before interaction is constant: r (a/A)before 1/3. From this, weFig. 4. Plot of the different types of dune interactions as a function of the sizes of thedunes before collision: the area of the downwind dune (A) vs. the area of the upwind/smaller dune (a). Note that the boundary between coalescence and ejection roughlyfollows a straight line through the origin with slope of roughly 1/3. This implies that ifthe dune size ratio before collision: (a/A)before is smaller than 1/3, then coalescenceoccurs. Conversely, if (a/A)mbefore N 1/3, then two dunes result.Please cite this article as: Diniega, S., et al., Long-time evolution of models of aeolian sand dune fields: Influence of dune formation andcollision, Geomorphology (2009), doi:10.1016/j.geomorph.2009.02.010
ARTICLE IN PRESS4S. Diniega et al. / Geomorphology xxx (2009) xxx–xxxcan see that if we consider a pair of dunes such that the line from thatpoint (A,a) to the origin is less steep than that boundary (equivalently,the size ratio of the two dunes is between 0 and 1/3), coalescenceoccurs. Conversely, when the line between a point and the origin issteeper than the boundary (or the size ratio is between 1/3 and 1), thecollision results in two dunes or ejection. Thus, it is appears that thesize ratio (r) between the dunes is what determines a collision result,not the individual sizes of the dunes.To understand in more detail what will result when two dunescollide, we also compute the size ratio of the dunes after collision ( f(r) (adownwind/Aupwind)after; where adownwind, after 0 if the dunes coalesce),and plotted this against the size ratio before dune collision (r). Resultantdunes which disappear are treated as very small ejection dunes becausethe sizes are measured as soon as the dune-complex separates into twodunes. As can be seen in Fig. 5, the data falls roughly on a single curve andindicates that the relevant quantities are the ratios of dune sizes beforeand after collision. We call this relationship the interaction function f/(r).When the ratio r is smaller than about 1/3, f 0 indicating coalescence. Inthe limit where very similarly sized dunes collide, f(r) increases andappears to 1.Similar results have been found elsewhere in the literature. Forexample, studies of discrete numerical simulations of interactingthree-dimensional barchan dunes (Katsuki et al., 2005) and laboratoryexperiments of subaqueous barchan dune collisions (Endo et al., 2004)yield results which support our hypothesized interaction functioncharacteristics. Additionally, a study by Durán et al. (2005) usingcontinuum numerical simulations of three-dimensional barchan duneinteractions found an interaction function (Fig. 6) which also consistsof a continuous relation between size ratios before and after collision,with f(0) 0 and f( 1) 1.2.4. Dependencies of the interaction functionAs explained in Section 2.3, the balance between the timescaleover which the upwind dune merges with the downwind dune andthe rate at which the downwind dune shrinks (and migrates faster) iswhat determines the end result of a collision.For example, the timescale over which the dunes merge is veryshort if dunes initially have very different sizes, as the relative velocitybetween the dunes is large. The dunes will merge together before thedownwind dune can shrink sufficiently to escape, which is why f(0) 0.Fig. 6. This plot was derived for three-dimensional barchan dune collisions by Duránet al. (2005) and shows volume ratios of colliding barchan dunes before vs. aftercollision (the dots, along with a best fit curve). It exhibits the same characteristics as theinteraction function shown in Fig. 5: a threshold between coalescence (c) vs. allejection-type interactions (b/bu/s; breeding, budding, solitary waves), a singlemonotonic curve along which all points fall and which passes through (0,0) andprobably (1,1). The straight line shown has a slope of one.Conversely, the rate at which the downwind dune shrinks is moreimportant if dunes are initially very similar in size, because the relativevelocity will be low. As they will move towards each other over a longtime period, the downwind dune will be able to slowly escape afterbecoming slightly smaller than the upwind dune. The two dunes willend up close to each other in size, so f(r) 1 as r 1.A continuum between these two effects is expected, as thetimescale over which dunes interact will increase as the disparitybetween the sizes of the two dunes increases. This yields a continuous,monotonic function. The exact form of the function will depend onfactors which set the timescale over which the dunes interact and therate of the sand exchange between the dunes.In the continuum dune model, for example, one way to change therate at which sand is exchanged is by increasing the aspect ratio of theseparation bubble. This lengthens the shadow zone of the upwinddune, causing the foot of the downwind dune to be caught in thatshadow zone and arrested sooner. The downwind dune, thus, losesmore sand before the upwind dune begins to gain sand. As the growthof the upwind dune is delayed relative to the shrinkage of thedownwind dune, the downwind dune will need to shrink more tobecome the smaller of the two. When the downwind dune is finallyejected, it will be smaller (and the upwind dune will be larger),causing the interaction function to be lower (i.e., f(r) will decreaseover all values of r where f(r) N 0). Conversely, if the length of theseparation bubble is decreased, then the interaction function will behigher. Test simulations have shown this to be the case, although theeffect was small (Fig. 7).2.5. Implications of the interaction function and crossover valueFig. 5. Plot of the area ratio of colliding dunes, before collision vs. after. Note the distinctzones of interaction results: coalescence occurs when the dune size ratio beforeinteraction is below some threshold (1/3); when the ratio is above that threshold, thenthe output size ratio generally falls along a specific curve, independent of the absolutesizes of the dunes (the outlier corresponds to the smallest dune pair sampled). In thelegend, the numbers given are the total number of simulations which yielded thatparticular type of interaction.Our derivation of an interaction function for transverse dunes(Fig. 5) is included in this study to explain the general form of aninteraction function. The specific function that was found through ourtwo-dimensional dune simulations, however, will not be used inthe remainder of this study because that functional form (where for allr, f(r) b r) yields coalescence-dominated dynamics.When f(r) b r for all values of r, then in every collision the largerdune grows and the smaller dune shrinks. As the smaller dune inevery collision shrinks and eventually coalesces with the larger dunes(for small enough r, f(r) 0), the dune field perpetually evolves into aPlease cite this article as: Diniega, S., et al., Long-time evolution of models of aeolian sand dune fields: Influence of dune formation andcollision, Geomorphology (2009), doi:10.1016/j.geomorph.2009.02.010
ARTICLE IN PRESSS. Diniega et al. / Geomorphology xxx (2009) xxx–xxx5continuum model to understand interaction of a small number ofdunes. Specifically, the interaction function is based upon the observeddynamics of colliding dunes in the continuum dune model. The dunesthemselves are treated as particles with morphologies and dynamicsapproximated using simple phenomenological relations — withoutconsideration of the detailed results of the continuum model.The focus of this study is on whether a dune field will form a stable,patterned structure, so simulations are run until it is apparent thatfield dynamics have stabilized in one of the end states (defined inSection 4.1).3.1. Approximation of single dunesFig. 7. This plot shows the best-fit interaction functions for transverse dunes, after usingdifferent separation bubble aspect ratios in the continuum dune model (e.g., aspectratio 6 corresponds to the data shown in Fig. 5). As hypothesized, an inverserelationship between f(r) and the separation bubble aspect ratio exists because of theinfluence of the ratio on how quickly the downwind dune is able to lose sand.system containing a smaller number of larger dunes. It should beapparent that this type of dune field dynamics will never yield a stablepattern of similarly sized dunes.Conversely, when f(r) N r for all values of r, then in all collisions thedunes become more similar in size. Eventually, after many collisions,the dune field will always evolve into a system of many similarly sizeddunes (with any remaining collisions occurring around r 1).As one more extreme example: if f(r) r for all values of r, thendunes will behave similar to solitons in that all interactions willpreserve the sizes of the dunes involved, as if the dunes simply passthrough each other.Most natural dune field interaction functions will not correspondwith one of these examples (in particular, see Livingstone et al. (2005)for a discussion about the unphysical nature of the soliton example).Instead, a natural dune field interaction function will probably be acombination of these extreme examples, with some regions where f(r) br, some regions where f(r) N r, and transition points where f(r) r. In thesecases, the dynamics of the dune field can be determined based on theinteraction function crossover value: the value r⁎ such that for all higherr b 1, f(r) N r. We define the crossover value as the lower bound on theregion connecting to (1,1) where f(r) N r. An interaction function may haveseveral regions where f(r) r, but only the region including (1,1) is ofinterest, as it is necessary for f(r) N r as r 1 for interactions to actuallypush the system toward a field where all dunes are about the same size.Additional lower regions where f(r) N r will affect the timescale overwhich the system evolves, but not the end state.For the first and third extreme examples discussed above ( f(r) b rand f(r) r), r⁎ 1 and the system will never have a stable patternedstructure. In the second example considered ( f(r) N r), r⁎ 0 and thesystem will always achieve a pattern of similarly sized dunes. Theinteraction function derived for barchan dunes is an example of anintermediary case (r⁎ 0.12 in Fig. 6), so this interaction function mayyield a patterned structure, and it did in Durán et al. (2005).Thus, for a dune field model to possibly form a stable patternedsystem, its interaction function needs to have r⁎ b 1. Generic interaction functions with this characteristic (in addition to those characteristics outlined in Section 2.3) will be considered in constructing thedune field model.3. Multiscale dune field modelsAs in other works (Lima et al., 2002; Parteli and Herrmann, 2003;Lee et al., 2005), we utilize a multiscale approach by using theRather than keep track of every degree of freedom in thecontinuum model, it is useful to only track dunes according to theirsize and location. To determine when dunes are close enough tointeract, we make reasonable assumptions about their morphology.Their shape is assumed scale-invariant, approximated as triangularwedges, with a stoss aspect ratio of 10 (Parteli et al., 2006b), a leeaspect ratio of 1.5 (the angle of repose), and a separation bubble withan aspect ratio of 6 (Schatz and Herrmann, 2005), as shown in Fig. 8.The dunes move with a velocity inverse to their crest height (Andreottiet al., 2002a); i.e., v k/H. The coefficient k varies between actual dunefields (Bagnold, 1941). In this study, it is arbitrarily set at 100 m2/yr.3.2. Interactions and initializationCollisions occur when the foot of the downwind dune is touched bythe separation bubble of the upwind dune. The distance betweendunes after collision is calculated the same way, with the downwinddune located just outside the separation bubble of the upwind dune.The results of dune collisions are governed by the interactionfunction, which relates the size ratio of the dunes before collision tothe size ratio of the dunes after collision (as described and derived inSections 2.3–2.5). In our dune field model, collisions occur instantaneously once dunes are close enough to interact.Initial cross-sectional areas for the dunes (for either initial or influxdunes) are taken from a specified range with uniform distribution.When we consider a semi-infinite domain with an upwind influx ofdunes, we assume a constant mass influx rate of 30 m2/yr to relateinjection frequency to dune size. In general, this corresponded to 1000 influx dunes per 1000 years for simulations run with a smallmean dune s
Long-time evolution of models of aeolian sand dune fields: Influence of dune formation and collision Serina Diniegaa,⁎, Karl Glasnerb, Shane Byrnec a Program in Applied Mathematics, The University of Arizona, 617 N. Santa Rita Ave., P.O. Box 210089, Tucson, AZ, 5 85721-0089, USA b Department of Mathematics, University of Arizona, USA c Department of Planetary Sciences, University of .