Transcription
Basics ofLight MicroscopyImaging&SPECIAL EDITION OFImaging&MicroscopyRESEARCH DEVELOPMENT PRODUCTIONwww.gitverlag.com
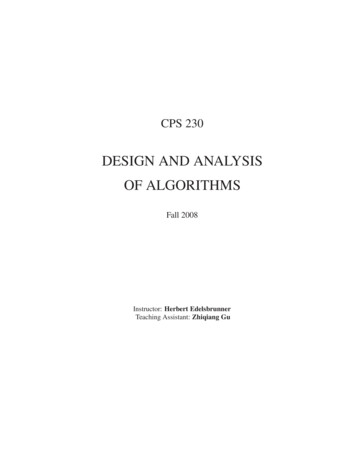
GIVE YOUR EYES TIME TO ADJUST TO THEHIGH LIGHT EFFICIENCY. OLYMPUS SZX2.If you’re used to other stereo microscopes, you’d better beprepared before you start working with the new Olympus SZX2range. The peerless resolution and exceptional light efficiencyenable you to see fluorescence with brightness and brilliancelike never before, while providing optimum protection for yourspecimens at the same time. All this makes Olympus SZX2stereo microscopes the perfect tools for precise fluorescenceanalysis on fixed and living samples. Importantly, the innovationspresent in the SZX2 series go far beyond fluorescence. Theoptimised 3-D effect offers superior conditions for specimenpreparation and precise manipulation. The unique ultra-flatLED light base provides bright and even illuminationof the entire field of view at a constant colourtemperature. Moreover, the ComfortView eyepiecesand new trinocular observation tubes make sureyour work is as relaxed as it is successful. The futurelooks bright with Olympus.For more information, contact:Olympus Life and Material Science Europa GmbHPhone: 49 40 2 37 73 54 26E-mail: mOlympusMicroscopy
IntroductionIn this wide-ranging review, Olympus microscopy expertsdraw on their extensive knowledge and many years ofexperience to provide readers with a highly useful and rareoverview of the combined fields of microscopy and imaging.By discussing both these fields together, this review aimsto help clarify and summarise the key points of note in thisstory. Encompassing the creation of highly detailed specimen views through to final image capture and processing,the story will also be backed up by useful insights, examples, as well as handy hints and tips along the way.To make it easy to dip in and dip out of this comprehensiveContentoverview, the review is clearly structured into several chap-Editorials ters. These take the reader from explanations of the physicsTrust the Colours of light, colour and resolution, through details of contrastThe Resolving Power 12and fluorescence techniques, to finish up with discussionContrast and Microscopy 22on 3D imaging. Highlighting and summarising key pointsShining Fluorescence Details 34made within this review are a series of information boxes.3D Imaging 42These also aim to provide useful insight on techniques, asContact and Acknowledgement 52well as expert advice on microscope set up.Imprint 2–3452Basics of light Microscopy & Imaging
Dear Reader“A Huge Number ofTechniques in a RelativelyShort Space”Although microscopes are becoming more and more easy to use, it still remains important to have anappreciation of the fundamental principles that determine the resolution and contrast seen in microscope images. This series of articles, by authors from Olympus, aims to provide an overview of thephysical principles involved in microscope image formation and the various commonly used contrastmechanisms together with much practically oriented advice. Inevitably it is impossible to cover any ofthe many aspects in great depth. However, their approach, which is to discuss applications and provide practical advice for many aspects of modern day microscopy, will prove attractive to many.The articles begin by setting the scene with a discussion of the factors that determine the resolvingpower of the conventional microscope. This permits the introduction of important concepts such asnumerical aperture, Airy disc, point spread function, the difference between depth of focus and depthof field and the concept of parfocality. Common contrast mechanisms such as darkfield and phasecontrast are then introduced, followed by differential interference contrast and polarisation contrastimaging. Throughout the discussion, the importance of digital image processing is emphasised andsimple examples such as histogram equalisation and the use of various filters are discussed.Tony Wilson Ph.DProfessor of Engineering ScienceUniversity of OxfordUnited KingdomThe contrast mechanisms above take advantage of the fact that both the amplitude and phase of thelight is altered as it passes through the specimen. Spatial variations in the amplitude (attenuation)and/or the phase are used to provide the image contrast. Another extremely important source of image contrast is fluorescence, whether it arise naturally or as a result of specific fluorescent labels having been deliberately introduced into the specimen. The elements of fluorescence microscopy andtechniques of spectral unimixing are discussed and brief mention is made of more advanced techniques where spatial variations in, for example, fluorescence lifetime are used to provide image contrast. Finally, techniques to provide three-dimensional views of an object such as those afforded bystereo microscopes are discussed together with a very brief mention of the confocal microscope.The authors have attempted the very difficult task of trying to cover a huge number of techniques in arelatively short space. I hope you enjoy reading these articles.“Unique presentation of technical aspectsin connection with image processing”As a regular reader of “Imaging & Microscopy,” the title of this issue, “Basics of Light Microscopy &Imaging,” must certainly seem familiar to you. From March 2003 to November 2005, we had a seriesof eleven articles with the same name and content focus.In collaboration with the authors, Dr Manfred Kässens, Dr Rainer Wegerhoff, and Dr Olaf Weidlich ofOlympus, a lasting “basic principles” series was created that describes the different terms and techniques of modern light microscopy and the associated image processing and analysis. The presentation of technical aspects and applications in connection with image processing and analysis wasunique at that time and became the special motivation and objective of the authors.For us, the positive feedback from the readers on the individual contributions time and again confirmed the high quality of the series. This was then also the inducement to integrate all eleven articlesinto a comprehensive compendium in a special issue. For this purpose, the texts and figures have beenonce more amended or supplemented and the layout redesigned. The work now before you is a guidethat addresses both the novice and the experienced user of light microscopic imaging. It serves as areference work, as well as introductory reading material.Dr. Martin FriedrichHead Imaging & MicroscopyGIT Verlag, A Wiley CompanyGermanyA total of 20,000 copies of “Basics of Light Microscopy & Imaging” were printed, more than doublethe normal print run of ”Imaging & Microscopy.” With this, we would like to underline that we are justas interested in communicating fundamental information as in the publication of new methods, technologies and applications.Enjoy reading this special issue. Basics of light Microscopy & Imaging
“You Can GetKeywords for ExpandingYour Knowledge”Alberto Diaspro Ph.DProfessor of Applied PhysicsUniversity of GenoaItalyThere is a great merit for publishing “Basics of LIGHT MICROSCOPY and IMAGING: From Colour toResolution, from Fluorescence to 3D imaging”. It is a great merit since it is very important to define, toclarify, and to introduce pivotal elements for the comprehension and successive utilisation of opticalconcepts useful for microscopical techniques and imaging. The niche still occupied by optical microscopy, within a scenario where resolution “obsession” plays an important role, is mainly due to theunique ability of light-matter interactions to allow temporal three-dimensional studies of specimens.This is of key relevance since the understanding of the complicate and delicate relationship existingbetween structure and function can be better realised in a 4D (x-y-z-t) situation. In the last years, several improvements have pushed optical microscopy, from confocal schemes [1-6] to multiphoton architectures, from 7-9 folds enhancements in resolution to single molecule tracking and imaging allowing to coin the term optical nanoscopy [7]. Advances in biological labelling as the ones promoted bythe utilisation of visible fluorescent proteins [8-12] and of overwhelming strategies like the “F” techniques (FRAP – fluorescence recovery after photobleaching, FRET – fluorescence resonance energytransfer, FCS – fluorescence correlation spectroscopy, FLIM – fluorescence lifetime imaging microscopy) [4, 13-15] collocate optical microscopy in a predominant position over other microscopical techniques. So it becomes mandatory for primers, and more in general for all those researchers looking foranswers about their biological problems that can be satisfied by using the optical microscope, to havea good starting point for finding the optimal microscopical technique and for understanding what canbe done and what cannot be done. This long note on Basics can be a good point for starting. It bringsthe reader through different concepts and techniques. The reader can get the keywords for expandingher/his knowledge. There are some important concepts like the concept of resolution and the relatedsampling problems, spectral unmixing and photon counting that are introduced for further readings.This article reports some interesting examples and a good link between the different mechanisms ofcontrast, from DIC to phase contrast until fluorescence methods. Treatment is not rigorous, but it keepsthe audience interested and is sufficiently clear. I read it with interest even if I would prefer to havemore bibliographic modern references to amplify the achievable knowledge.References[1] Amos B. (2000): Lessons from the history of light microscopy. Nat Cell Biol. 2(8), E151-2.[2] Wilson T., Sheppard C. (1984): Theory and practice of scanning optical microscopy. Academic Press, London.[3] Diaspro A. (2001): Confocal and two-photon microscopy : foundations, applications, and advances. Wiley-Liss, New York.[4] Pawley JB. (2006): Handbook of Biological Confocal Microscopy, 3rd edition, Plenum-Springer, New York.[5] Hawkes PW., Spence JCH. (2006): Science of Microscopy, Springer, New York.[6] Masters BR. (2006): Confocal Microscopy And Multiphoton Excitation Microscopy: The Genesis of Live Cell Imaging, SPIE Press Monograph Vol. PM161, USA.[7] Hell SW. (2003): Toward fluorescence nanoscopy. Nat Biotechnol. 21, 1347.[8] Jares-Erijman EA., Jovin TM. (2003): Nat Biotechnol. 21(11), 1387.[9] Tsien RY. (2006): Breeding molecules to spy on cells. Harvey Lect. 2003-2004, 99, 77.[10] Tsien RY. (1998): The green fluorescent protein. Annu Rev Biochem. 67, 509.[11] Pozzan T. (1997): Protein-protein interactions. Calcium turns turquoise into gold. Nature. 388, 834[12] Diaspro A. (2006): Shine on . proteins. Microsc Res Tech. 69(3),149[13] Periasamy A. (2000): Methods in Cellular Imaging, Oxford University Press, New York.[14] Becker W. (2005): Advanced Time-Correlated Single Photon Counting Techniques, Springer, Berlin.[15] Periasamy A., Day RN. (2006): Molecular Imaging : FRET Microscopy and Spectroscopy, An American Physiological Society Book, USA.ImprintPublished byGIT VERLAG GmbH & Co. KGSector ManagementAnna Seidingera.seidinger@gitverlag.comJournal ManagementDr. Martin Friedrichm.friedrich@gitverlag.comAuthorsDr. Rainer Wegerhoffrainer.wegerhoff@olympus-europa.comDr. Olaf Weidlicholaf.weidlich@olympus-sis.comDr. Manfred Kässensmanfred.kaessens@olympus-sis.comLayoutRuth Herrmannr.herrmann@gitverlag.comLitho and CoverdesignElke Palzerpalzer@gitverlag.comGIT VERLAG GmbH & Co. KGRösslerstrasse 9064293 DarmstadtGermanyTel.: 49 6151 8090 0Fax: 49 6151 8090 133www.gitverlag.comEditorial AssistanceLana Feldmannl.feldmann@gitverlag.comIn Cooperation withOlympus Life and Material Science Europa GmbHWendenstrasse 14–18D-20097 Hamburg, GermanyTel.: 49 40 23772-0Fax: 49 40 23 77 36 47www.olympus-europa.comProduction ManagerDietmar Edhoferd.edhofer@gitverlag.comPrinted byFrotscher DruckRiedstrasse 8, 64295 Darmstadt, Germany Circulation20,000 copiesThe publishing house is granted the exclusive right, withregard to space, time and content to use the works/editorial contributions in unchanged or edited form forany and all purposes any number of times itself, or totransfer the rights for the use of other organizations inwhich it holds partnership interests, as well as to thirdparties. This right of use relates to print as well as electronic media, including the Internet, as well as databases/data carriers of any kind.All names, designations or signs in this issue, whetherreferred to and/or shown, could be trade names of therespective owner.Basics of light Microscopy & Imaging
Trust the Colours Basics of light Microscopy & Imaging Trust the Colours
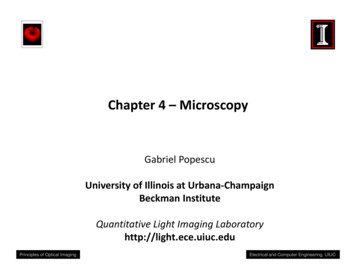
LightHow do we describe light that reachesour eyes? We would probably use twokey words: brightness and colour. Let uscompare these expressions to the waylight is characterised in natural sciences:It is looked upon as an electromagneticwave having specific amplitude and distinct wavelength. Both, the workadayand the scientist’s perspective essentiallymean the same. The wave’s amplitudegives the brightness of the light, whereasthe wavelength determines its colour.Figure 1 shows how colour and wavelength are related.by different colour models, i.e. in different colour spaces. These are what the tokens HSI, RGB, and CYMK stand for. Eachof these models gives a different perspective and is applied in fields where it canbe used more easily than the other models. But nevertheless each model describes the same physical reality.HSILet us stick to the grass and assume it isfresh spring grass. How would we describe it in everyday language? We wouldcharacterise it as green – and not as blueor orange. This is the basic hue of a col-ColourColour always arises from light. There isno other source. The human eye can perceive light in the colours of a wavelengthrange between 400 and 700 nm. But instead of having just one distinct colour,light is usually composed of many fractions with different colours. This is whata spectrum of a light implies. For example look at the spectrum of our lifesource, the central sun, which emits lightof all different colours (fig. 2).Fig. 1: Visible light spectrum.White lightAll colours of a light source superimpose.So light sources have the colour dependent on the predominant wavelength palette. A candle for example may look yellowish, because the light mainly comprises wavelengths in the 560–600 nmrange. Light from sources emitting in thewhole spectral range with somewhat comparable amounts appears as white light.Green grassWhat makes us see objects, which are notlight sources themselves? There are different processes, which happen whenlight meets physical matter. They arecalled reflection, refraction, diffractionand absorption. They all happen together,but usually one process dominates. Seefor example grass or other dense physicalmatters: What we see when observinggrass is mainly reflected light. But whydoes grass appear to be green? The reason is that grass reflects only portions ofthe white daylight. At the same time it absorbs the red and blue portions of thedaylight. Thus the green light remains.Colour modelsMuch that we know and observe relatedto colour can be mathematically describedTrust the Colours Fig. 2: Spectrum of the sun, and spectra of common sources of visible light.our. We would probably characterise itadditionally as “full” or “deep” – and notas pale. This is the saturation of a colour.Then one would describe it as bright –and not as dark. This is the brightness orintensity of a colour. Hue, Saturation,and Intensity form the HSI colour model.The Munsell Colour Tree (fig. 3) gives athree-dimensional geometrical representation of this model. Here, the hue valueis represented by an angle, the saturation by a radius from the central axis,and intensity or brightness by a verticalposition on the cylinder.RGBThe HSI model is suitable to describe anddiscern a colour. But there is another colour model, which better mirrors how ourhuman perception mechanism works.The human eye uses three types of coneBasics of light Microscopy & Imaging
tical application of the RGB model ismany-fold: For example, besides humanperception, digital cameras, monitors,and image file formats also function in away which can be described by the addition of the three primary colours.CYMThe overlap of the three primary additivecolours red, green, and blue creates thecolours cyan (C), yellow (Y), and magenta(M). These are called complementary orprimary subtractive colours, becausethey are formed by subtraction of red,green, and blue from white. In this way,yellow light is observed, when blue lightis removed from white light. Here, all theother colours can be produced by subtracting various amounts of cyan, yellow,and magenta from white. Subtraction ofall three in equal amount generatesblack, i.e. the absence of light. Whitecannot be generated by the complementary colours (fig. 4). The CYM model andits more workable extension, the CYMKmodel, find their applications in the technology of optical components such as filters as well as for printers, for example.Colour shiftcell photo receptors which are sensitiveto light, respectively in the red V(R),green V(G), and blue V(B) spectral range.These colours are known as primary colours. The clue is that all of the existingcolours can be produced by adding various combinations of these primary colours. For example, the human eye per-Fig. 3: Munsell Colour Tree.ceives an equal amount of all the threecolours as white light. The addition of anequal amount of red and blue light yieldsmagenta light, blue and green yieldscyan, and green and red yields yellow(fig. 4). All the other colours are generated by stimulation of all three types ofcone cells to a varying degree. The prac-Fig. 4: Primary colours.Let us now examine a colour phenomenon which astonishes us in daily life: thecolour shift. This also gives us the chanceto take the first step into light microscopyand look closer into its typical lightsources halogen bulb, xenon arc lampand mercury arc lamp.It is a common experience to buy apair of black trousers that is obviouslydark blue when you look at them backhome. This inconvenient phenomenon ofcolour shift is not restricted to the bluetrousers. The so-called “white light” thatis generated by a halogen bulb at a microscope, differs a lot from light from axenon burner. At first glance it is the intensity that is obviously different, buteven if you reduce the light intensity of axenon burner, the halogen light will giveyou a more yellowish impression whenprojected onto a white surface. Furthermore, dimming the halogen bulb lightcan make the colour even more red-like.This can be easily observed at the microscope if you focus on a white specimenarea and increase the light power slowly.The image observed will change from ayellow-red to a more bluish and verybright image. This means that with increasing power, the intensity or availability of different wavelengths (colours)has been changed. An additional aspectto consider here are the subsequent lightperception and interpretation. They are Basics of light Microscopy & Imaging Trust the Colours
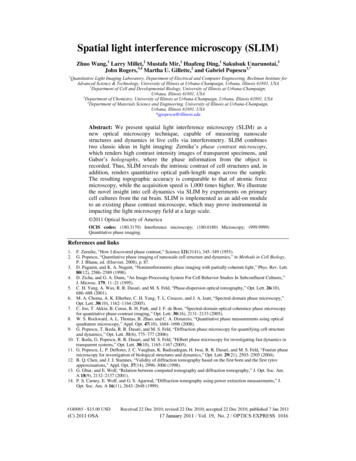
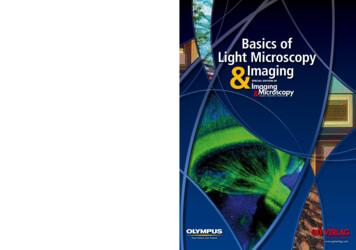
Fig. 5a-c is showing the emission spectra of three typically used light sources at a microscope: (a) the tungsten halogen bulb, TF colour temperature atdifferent power settings, (b) the mercury burner, (c) the xenon burner.done by eye and brain and result in theeventually recognised colour.But let us come back to the light generation. The overall spectrum of a lightsource at a defined power setting is described with the term colour temperature. The term colour temperature is ahelp to describe the spectrum of lightsources as if a black piece of ideal metalis heated up. If a temperature of about3500 K is reached, this metal will have ayellowish colour. This colour will changeinto a bluish white when it reaches6000K.For a 12V / 100W tungsten halogenlamp at 9 Volt the colour temperature isapproximately 3200K (fig. 5a) whereasfor a 75 W xenon burner it is 6000K. Sothe colour temperature gives us a goodhint about the overall colour shift. Yet itwill not give an idea of the individual intensities at defined wavelengths. Thisknowledge is of high importance if wehave to use a light source for example forfluorescence microscopy. In this casethe light source has to produce a sufficient intensity of light in a range of wavelengths that match the excitationrange of the fluorochrome under observation.Microscope Light SourcesTungsten – halogen bulbsNearly all light microscopes are equippedwith a halogen lamp (10W–100W) eitherfor general use, or as an addition to another light source. A wide range of optical contrast methods can be driven withthis type of light source, covering allwavelengths within the visible range butwith an increase in intensity from blue tored. Additionally, the spectral curve alters with the used power (fig. 5a). Toachieve similar looking colours in theprevalent brightfield microscopy theTrust the Colours power setting should be kept at one level,e.g. 9V (TF 3200 K; colour temperatureat 9V). This light intensity level is oftenmarked at the microscope frame by aphoto pictogram.But here a problem arises: If the lightintensity is to be kept fixed in the lightmicroscope the light might be too brightfor observation. In daily life if sunlight istoo bright sunglasses help – but theyBox 1: Centring of a mercury burnerDepending on the type (inverted or upright) and manufacturer of the microscope there will be some individual differences but the strategy remains thesame.Please also see the instruction manual of the microscope.1. Start the power supply for the burner, use a UV-protection shield andensure that a mirror-cube is in the light path.2. Locate a white paper card on the stage of the microscope and open theshutter. If the light is too bright insert optional available neutral densityfilters (e.g. ND25 – only 25 % of the light intensity will pass through).3. Bring the focus to the lowest position.4. Get a free objective position or on upright microscopes a 20x objectivein the light path.5. If available, open the aperture stop and close the field stop.6. Optimise brightness with the burner centring knobs (mostly located atthe side of the lamp house)7. From the lamp house, an image of the arc of the burner itself and themirrored image are projected on the card. To see them in focus, use acollector focussing screw (Figure A).8. If only one spot can be located or the second is not the same size, themirror (Figure B) has to be re-centred as well. At most lamp housesthere are screws at the back for screwdrivers for this option. Rotatethem until the images have the same size as shown in (Figure C).9. Locate both images parallel to each other and overlay them by using the burner centring screws(Figure D).10. Defocus the images with the collector focusing screw and open the field stop.11. Remove the white paper card and bring a homogenous fluorescent specimen into focus (e.g. try somecurry on the cover slip).12. Fine adjustment of the homogenous illumination can only be performed under observation: if necessaryreadjust the collector focusing screw so that the total field of view is equally illuminated.13. If digital acquisition is of prime interest, the fine adjustment can also be performed at the monitor, tooptimise the illumination for the size of the CCD.Basics of light Microscopy & Imaging
might not only reduce the intensity butalso let us see the world in other colours.In light microscopy there are light filtersthat only reduce the intensity. These filters are called neutral density filters (ND)or neutral grey filters. They are characterised by the light that they will transmit. Therefore, a ND50 will allow halfthe light intensity to pass throughwhereas a ND25 will reduce the intensityto 25 % without changing the colours. Ifthe spectrum is changed, we will havecolour filters. There is a huge variety ofcolour filters available but here we willonly discuss the so-called light balancingdaylight filter (LBD).This filter is used together with thehalogen light source to compensate forthe over distribution of the long (red)wavelengths. This enables us to see thecolours of a stained pathology section forexample on a neutral white backgroundin brightfield microscopy (fig. 11).Mercury Arc lampThe mercury burner is characterised bypeaks of intensity at 313, 334, 365, 406,435, 546 and 578nm and lower intensities at other wavelengths (see fig. 5b).This feature enables the mercury burnerto be the most used light source for fluorescence applications. Whenever thepeak emissions of the burner match theexcitation needs of the fluorochromes agood (depending on the specimen) signalcan be achieved. However, these benefitsare reduced by a relative short lifetime ofthe burner of about 300 hours and asmall change of the emission spectrumdue to deposits of cathode material to theTable 1: Comparison of different light sources and their colour temperature performanceLight sourceColour temperatureVacuum lamp (220 W / 220 V)Nitraphot (tungsten filament) lamp B (500 W / 220 V)Photo and cinema lamps as well as colour control lamp (Fischer)Photo and cinema (e.g., nitraphot (tungsten filament) lamp S)Yellow flash bulbClear flash bulbMoonlightBeck arc lampWhite arc lamp as well as blue flash bulbElectron flash unitSun only (morning and afternoon)Sun only (noontime)Sun and a cloudless skyOvercast skyFog, very hazyBlue northern sky at a 45 vertical angleInternational standard for average sunlight2790 K3000 K3200 K3400 K3400 K3800 K4120 K5000 K5500 K5500-6500 K5200-5400 K5600 K6000 K6700 K7500-8500 K11000 K5500 Kinner glass surface of the burner withongoing lifetime.Xenon Arc lamp (XBO)Xenon burners are the first choice lightsources when a very bright light isneeded for reflected microscopy, such asdifferential interference contrast on darkobjects, or quantitative analysis of fluorescence signals as for example in ionratio measurement. They show an evenintensity across the visible spectrum,brighter than the halogen bulb but theydo not reach the intensity peaks of themercury burners. The xenon burneremission spectrum allows the direct analysis of intensities at different fluorescenceexcitation or emission wavelengths. Thelifetime is of about 500–3000 hours depending on use (frequent on/off switching reduces the lifetime), and the type ofburner (75 or 150W). For optimisation ofillumination especially with the mercuryand xenon burners the centring andalignment is very important.Coming to the pointTo ensure that the light source is able toemit the required spectrum is one part ofthe colour story; to ensure that the objective lenses used can handle this effectively is another. When “white” light ispassing through the lens systems of anobjective refraction occurs. Due to thephysics of light, blue (shorter) wavelengths are refracted to a greater extentthan green or red (longer) wavelengths.This helps to create the blue sky but isnot the best for good colour reproductionat a microscope. If objectives did notcompensate this aberration then as outlined in fig. 6 there would be focus points Basics of light Microscopy & Imaging Trust the Colours
Fig. 6: Schematic of axial chromatic aberration.for all colours along the optical axes.This would create colour fringes surrounding the image.To reduce this effect achromatic lenscombinations have been used since the18th century. These types of lenses combine the blue and red wavelengths to onefocus point. Further colour correction atthe visible range can be achieved by adding different sorts of glass systems together to reach the so-called Fluorite objectives (the name originally comes fromthe fluorspar, introduced into the glassformulation). They are also known as Neofluar, Fluotar, or Semi-apochromat. Tocorrect the complete range from near infrared (IR) to ultraviolet (UV) the finestclass of objectives, apochromate, hasbeen designed. Beside colour correctionthe transmission power of an objectivecan also be of prime interest. This is especially the case if high power near UV isneeded at e.g. 340 nm (excitation of thecalcium sensitive dye Fura-2) or IR isneeded for 900 nm IR-DIC.The look of colourLet us now go one step further and seehow the light with its colours – after having passed the microscope – is detectedin modern camera systems. Here, digitalcameras have become standard for acquisition of colour or monochrome images in the microscopy field. But how dothese cameras work and how can it beguaranteed that the colours in the images they provide are accurate? This isof critical importance because it is a primary prerequisite for all activities suchas image documentation, archiving oranalysis.Detecting colourLight detection functions in the same wayfor both colour and monochrome cameras. Fig. 7 illustrates how CCD digitalcameras (Charged Coupled Device) function. In colour cameras, mosaic filtersare mounted over the CCD elementsFig. 8: Bayer colour filter mosaic array and underlying photodiodes.Trust the Colours Fig. 7: The principle behind how CCD cameras function.(fig. 8). These filters ensure that onlygreen, red or blue light is permitted tocome into contact with the light-sensitivepart of the single sensors or pixels (picture element). The proportion of coloursis generally two green pixels to one redand one blue pixel. The colour image isactually generated by the computer initially via complex algorithms. This involves assessing and processing the respective signals of the green, red andblue pixels accordingly. For example, asingle pixel with a bit depth of 8 becomesa 24-bit colour pixel (fig. 9).Depending on the imaging method,the reflected or transmitted light of theobject is focus
LED light base provides bright and even illumination of the entire field of view at a constant colour temperature. Moreover, the ComfortView eyepieces and new trinocular observation tubes make sure your work is as relaxed as it is successful. The future looks bright with Olympus. GIVE YOUR EYES TIME TO ADJUST TO THE HIGH LIGHT EFFICIENCY .