Transcription
Spatial light interference microscopy (SLIM)Zhuo Wang,1 Larry Millet,2 Mustafa Mir,1 Huafeng Ding,1 Sakulsuk Unarunotai,3John Rogers,3,4 Martha U. Gillette,2 and Gabriel Popescu1,*1Quantitative Light Imaging Laboratory, Department of Electrical and Computer Engineering, Beckman Institute forAdvanced Science & Technology, University of Illinois at Urbana-Champaign, Urbana, Illinois 61801, USA2Department of Cell and Developmental Biology, University of Illinois at Urbana-Champaign,Urbana, Illinois 61801, USA3Department of Chemistry, University of Illinois at Urbana-Champaign, Urbana, Illinois 61801, USA4Department of Materials Science and Engineering, University of Illinois at Urbana-Champaign,Urbana, Illinois 61801, USA*gpopescu@illinois.eduAbstract: We present spatial light interference microscopy (SLIM) as anew optical microscopy technique, capable of measuring nanoscalestructures and dynamics in live cells via interferometry. SLIM combinestwo classic ideas in light imaging: Zernike’s phase contrast microscopy,which renders high contrast intensity images of transparent specimens, andGabor’s holography, where the phase information from the object isrecorded. Thus, SLIM reveals the intrinsic contrast of cell structures and, inaddition, renders quantitative optical path-length maps across the sample.The resulting topographic accuracy is comparable to that of atomic forcemicroscopy, while the acquisition speed is 1,000 times higher. We illustratethe novel insight into cell dynamics via SLIM by experiments on primarycell cultures from the rat brain. SLIM is implemented as an add-on moduleto an existing phase contrast microscope, which may prove instrumental inimpacting the light microscopy field at a large scale. 2011 Optical Society of AmericaOCIS codes: (180.3170) Interference microscopy; (180.0180) Microscopy; (999.9999)Quantitative phase imaging.References and links1.2.3.4.5.6.7.8.9.10.11.12.13.14.F. Zernike, “How I discovered phase contrast,” Science 121(3141), 345–349 (1955).G. Popescu, “Quantitative phase imaging of nanoscale cell structure and dynamics,” in Methods in Cell Biology,P. J. Bhanu, ed. (Elsevier, 2008), p. 87.D. Paganin, and K. A. Nugent, “Noninterferometric phase imaging with partially coherent light,” Phys. Rev. Lett.80(12), 2586–2589 (1998).D. Zicha, and G. A. Dunn, “An Image-Processing System For Cell Behavior Studies In Subconfluent Cultures,”J. Microsc. 179, 11–21 (1995).C. H. Yang, A. Wax, R. R. Dasari, and M. S. Feld, “Phase-dispersion optical tomography,” Opt. Lett. 26(10),686–688 (2001).M. A. Choma, A. K. Ellerbee, C. H. Yang, T. L. Creazzo, and J. A. Izatt, “Spectral-domain phase microscopy,”Opt. Lett. 30(10), 1162–1164 (2005).C. Joo, T. Akkin, B. Cense, B. H. Park, and J. F. de Boer, “Spectral-domain optical coherence phase microscopyfor quantitative phase-contrast imaging,” Opt. Lett. 30(16), 2131–2133 (2005).W. S. Rockward, A. L. Thomas, B. Zhao, and C. A. Dimarzio, “Quantitative phase measurements using opticalquadrature microscopy,” Appl. Opt. 47(10), 1684–1696 (2008).G. Popescu, T. Ikeda, R. R. Dasari, and M. S. Feld, “Diffraction phase microscopy for quantifying cell structureand dynamics,” Opt. Lett. 31(6), 775–777 (2006).T. Ikeda, G. Popescu, R. R. Dasari, and M. S. Feld, “Hilbert phase microscopy for investigating fast dynamics intransparent systems,” Opt. Lett. 30(10), 1165–1167 (2005).G. Popescu, L. P. Deflores, J. C. Vaughan, K. Badizadegan, H. Iwai, R. R. Dasari, and M. S. Feld, “Fourier phasemicroscopy for investigation of biological structures and dynamics,” Opt. Lett. 29(21), 2503–2505 (2004).B. Q. Chen, and J. J. Stamnes, “Validity of diffraction tomography based on the first born and the first rytovapproximations,” Appl. Opt. 37(14), 2996–3006 (1998).G. Gbur, and E. Wolf, “Relation between computed tomography and diffraction tomography,” J. Opt. Soc. Am.A 18(9), 2132–2137 (2001).P. S. Carney, E. Wolf, and G. S. Agarwal, “Diffraction tomography using power extinction measurements,” J.Opt. Soc. Am. A 16(11), 2643–2648 (1999).#140085 - 15.00 USD(C) 2011 OSAReceived 22 Dec 2010; revised 22 Dec 2010; accepted 22 Dec 2010; published 7 Jan 201117 January 2011 / Vol. 19, No. 2 / OPTICS EXPRESS 1016
15. V. Lauer, “New approach to optical diffraction tomography yielding a vector equation of diffraction tomographyand a novel tomographic microscope,” J. Microsc. 205(2), 165–176 (2002).16. A. M. Zysk, J. J. Reynolds, D. L. Marks, P. S. Carney, and S. A. Boppart, “Projected index computedtomography,” Opt. Lett. 28(9), 701–703 (2003).17. F. Charrière, N. Pavillon, T. Colomb, C. Depeursinge, T. J. Heger, E. A. D. Mitchell, P. Marquet, and B. Rappaz,“Living specimen tomography by digital holographic microscopy: morphometry of testate amoeba,” Opt.Express 14(16), 7005–7013 (2006).18. F. Charrière, A. Marian, F. Montfort, J. Kuehn, T. Colomb, E. Cuche, P. Marquet, and C. Depeursinge, “Cellrefractive index tomography by digital holographic microscopy,” Opt. Lett. 31(2), 178–180 (2006).19. W. Choi, C. Fang-Yen, K. Badizadegan, S. Oh, N. Lue, R. R. Dasari, and M. S. Feld, “Tomographic phasemicroscopy,” Nat. Methods 4(9), 717–719 (2007).20. G. Popescu, T. Ikeda, K. Goda, C. A. Best-Popescu, M. Laposata, S. Manley, R. R. Dasari, K. Badizadegan, andM. S. Feld, “Optical measurement of cell membrane tension,” Phys. Rev. Lett. 97(21), 218101 (2006).21. Y. K. Park, M. Diez-Silva, G. Popescu, G. Lykotrafitis, W. Choi, M. S. Feld, and S. Suresh, “Refractive indexmaps and membrane dynamics of human red blood cells parasitized by Plasmodium falciparum,” Proc. Natl.Acad. Sci. U.S.A. 105(37), 13730–13735 (2008).22. Y. K. Park, C. A. Best, K. Badizadegan, R. R. Dasari, M. S. Feld, T. Kuriabova, M. L. Henle, A. J. Levine, andG. Popescu, “Measurement of red blood cell mechanics during morphological changes,” Proc. Nat. Acad. Sci.(2010).23. G. Popescu, Y. Park, N. Lue, C. Best-Popescu, L. Deflores, R. R. Dasari, M. S. Feld, and K. Badizadegan,“Optical imaging of cell mass and growth dynamics,” Am. J. Physiol. Cell Physiol. 295(2), C538–C544 (2008).24. N. Lue, G. Popescu, T. Ikeda, R. R. Dasari, K. Badizadegan, and M. S. Feld, “Live cell refractometry usingmicrofluidic devices,” Opt. Lett. 31(18), 2759–2761 (2006).25. H. Ding, F. Nguyen, S. A. Boppart, and G. Popescu, “Optical properties of tissues quantified by Fouriertransform light scattering,” Opt. Lett. 34(9), 1372–1374 (2009).26. D. Gabor, “A new microscopic principle,” Nature 161(4098), 777–778 (1948).27. J. B. Pawley, Handbook of biological confocal microscopy (Springer, New York, 2006).28. Z. Wang, and G. Popescu, “Quantitative phase imaging with broadband fields,” Appl. Phys. Lett. 96(5), 051117(2010).29. Z. Wang, I. S. Chun, X. L. Li, Z. Y. Ong, E. Pop, L. Millet, M. Gillette, and G. Popescu, “Topography andrefractometry of nanostructures using spatial light interference microscopy,” Opt. Lett. 35(2), 208–210 (2010).30. C. L. Waites, A. M. Craig, and C. C. Garner, “Mechanisms of vertebrate synaptogenesis,” Annu. Rev. Neurosci.28(1), 251–274 (2005).31. H. F. Ding, and G. Popescu, “Diffraction phase contrast microscopy,” Opt. Express 18(2), 1569–1575 (2010).1. IntroductionMost living cells do not absorb or scatter light significantly, i.e. they are essentiallytransparent, or phase objects. Phase contrast microscopy proposed by Zernike represented amajor advance in intrinsic contrast imaging, as it revealed inner details of transparentstructures without staining or tagging [1]. While phase contrast is sensitive to minute opticalpath-length changes in the cell, down to the nanoscale, the information retrieved is onlyqualitative. Quantifying cell-induced shifts in the optical path-lengths permits nanometer scalemeasurements of structures and motions in a non-contact, non-invasive manner [2]. Thus,quantitative phase imaging (QPI) has recently become an active field of study and variousexperimental approaches have been proposed [3–11]. Advances in phase-sensitivemeasurements enabled optical tomography of transparent structures, following reconstructionalgorithms borrowed from X-ray computed imaging, in which scattering and diffractioneffects are assumed to be negligible [12–16]. Further, QPI-based projection tomography hasbeen applied to live cells [17–19].Despite these significant technological advances, the range of QPI applications in biologyhas been largely limited to red blood cell imaging [20–22] or assessment of global cellparameters such as dry mass [4,23], average refractive index [24], and statistical parameters oftissue slices [25]. This limitation is due to two main reasons, as follows. First, because ofspeckle generated by the high temporal coherence of the light used (typically lasers), thecontrast in QPI images has never matched that exhibited in white light techniques such asphase contrast and Nomarski. Second, the experimental setups tend to be rather complex, ofhigh maintenance, which limits their in-depth biological applicability.Here, we present SLIM as a novel, highly sensitive QPI method, which promises to enableunprecedented structure and dynamics studies in biology and beyond. SLIM combinesZernike’s phase contrast method by revealing the intrinsic contrast of transparent samples [1],with Gabor’s holography [26] by rendering quantitative phase maps across the sample.#140085 - 15.00 USD(C) 2011 OSAReceived 22 Dec 2010; revised 22 Dec 2010; accepted 22 Dec 2010; published 7 Jan 201117 January 2011 / Vol. 19, No. 2 / OPTICS EXPRESS 1017
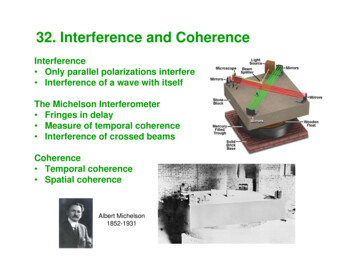
Because of the extremely short coherence length of this illumination light, approximately 1.2μm, SLIM provides speckle-free imaging with sub-nanometer spatial background noise.Further, the SLIM image is intrinsically registered with the other channels of the microscope,including fluorescence, which enables powerful multimodal investigations.2. SLIM SetupFig. 1. SLIM principle. (a) Schematic setup for SLIM. The SLIM module is attached to acommercial phase contrast microscope (Axio Observer Z1, Zeiss, in this case). The lampfilament is projected onto the condenser annulus. The annulus is located at the focal plane ofthe condenser, which collimates the light towards the sample. For conventional phase contrastmicroscopy, the phase objective contains a phase ring, which delays the unscattered light by aquarter wavelength and also attenuates it by a factor of 5. The image is delivered via the tubelens to the image plane, where the SLIM module processes it further. The Fourier lens L1relays the back focal plane of the objective onto the surface of the liquid crystal phasemodulator (LCPM, Boulder Nonlinear). By displaying different masks on the LCPM, the phasedelay between the scattered and unscattered components is modulated accurately. Fourier lensL2 reconstructs the final image at the CCD plane, which is conjugated with the image plane.(b) The phase rings and their corresponding images recorded by the CCD. (c) SLIMquantitative phase image of a hippocampal neuron.A schematic of the instrument setup is depicted in Fig. 1a. SLIM was developed by producingadditional spatial modulation to the image field outputted by a commercial phase contrastmicroscope. Specifically, in addition to the π/2 shift introduced in phase contrast between thescattered and unscattered light from the sample [1], we generated further phase shifts, byincrements of π/2, and recorded additional images for each phase map. Thus, the objectiveexit pupil, containing the phase shifting ring, is imaged via lens L1 onto the surface of areflective liquid crystal phase modulator (LCPM, Boulder Nonlinear). The active pattern onthe LCPM is calculated to precisely match the size and position of the phase ring image, suchthat additional phase delay can be precisely controlled between the scattered and unscatteredcomponents of the image field. In this setup, 4 images corresponding to each phase shift arerecorded (Fig. 1b), to produce a quantitative phase image that is uniquely determined (seeLCPM calibration Section below). Figure 1c depicts the quantitative phase image associatedwith a cultured hippocampal neuron, which is proportional to ( x, y) #140085 - 15.00 USD(C) 2011 OSA2 h( x, y )0 n( x, y, z) n0 dz.(1)Received 22 Dec 2010; revised 22 Dec 2010; accepted 22 Dec 2010; published 7 Jan 201117 January 2011 / Vol. 19, No. 2 / OPTICS EXPRESS 1018
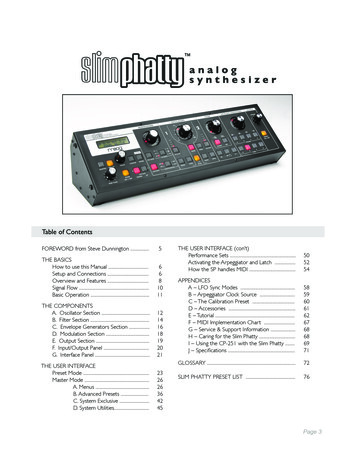
In Eq. (1), n-n0 is the local refractive index contrast between the cell and the surroundingculture medium, h the local thickness of the cell, and λ the central wavelength of theillumination light. SLIM provides the local phase shift with great accuracy, which in turnallows for detecting local changes in thickness h at a scale much smaller than the wavelengthof light. The typical irradiance at the sample plane is 1 nW/ μm2. The exposure time was 1050 ms, for all the images presented in the manuscript. This level of exposure is 6-7 orders ofmagnitude below that of typical confocal microscopy [27], which allows for noninvasive livecell imaging over extended periods of time (many hours or days).3. Liquid crystal phase modulationFig. 2. (a) Spectrum of the white light emitted by the halogen lamp. The center wavelength is552.3 nm. (b) The autocorrelation function (blue solid line) and its envelope (red dotted line).The 4 circles indicate the phase shifts produced by LCPM. The refractive index of the mediumis 1.33. (c). Intensity modulation obtained by displaying different grayscale values on theLCPM. (d) Phase vs. gray scale calibration curve obtained by Hilbert transform of the signal in(c).Using a spectrometer (USB 2000, Ocean Optics, USA), we measured the optical spectrum ofthe illuminating white light at the CCD plane. This spectrum is shown in Fig. 2a. From thesedata, we retrieved the temporal autocorrelation function of the light via a Fourier transform(Fig. 2b). The spectrum provided by the spectrometer is sampled in wavelength. In order toobtain the spectrum vs. frequency, which then can be Fourier transformed, we performedresampling of the data. In a medium of refractive index n 1.33 (i.e. water), the coherencelength defined at full width half maximum is lcFWHM 1.2 m . This coherence length is at leastan order of magnitude shorter than that of other light sources such as broadband lasers, lightemitting diodes and superluminescent diodes. However, within this coherence length there arestill several full cycle modulations. Thus, the envelop varies slowly over one period near thecentral peak, which enables the application of the phase shifting procedure described below.The LCPM (XY Phase Series Model P512 –635, Boulder Nonlinear Systems, Inc, USA)was calibrated to decide the relationship between pixel grey values fed via a VGA signal tothe liquid crystal array and the final phase delay introduced to the unscattered field. TheLCPM was placed between two polarizers and its intensity transmission was recorded as#140085 - 15.00 USD(C) 2011 OSAReceived 22 Dec 2010; revised 22 Dec 2010; accepted 22 Dec 2010; published 7 Jan 201117 January 2011 / Vol. 19, No. 2 / OPTICS EXPRESS 1019
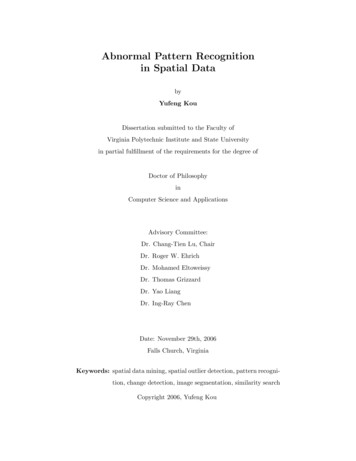
follows. We first changed the polarizer and analyzer by 45 so that SLM will work in“amplitude modulation” mode. Then we scanned through the grayscale value from 128 to 255(i.e. 8 bits). The modulation from pixel value 0 to 127 and from 128 to 255 is symmetric.Thus we only need to scan half of the pixel values. The intensity transmitted through theLCPM vs. the grey value is shown in Fig. 2c. From the amplitude response of the modulatorwe obtained its phase response via a Hilbert transform, as shown in Fig. 2d.For spatial coherent imaging system, after passing the specimen, a portion of the lightremains unscattered and forms a uniform background of the image; the other portion isscattered and contains the fine structure information of the specimen. If we denote theunscattered light as U 0 and the scattered light field as U1 ( x, y ) , the intensity at CCD isI ( x, y; ) U 0 U1 ( x, y ) 2 U 0 U1 ( x, y ) cos[ ( x, y) ],22(2)where ( x, y) is the phase difference between U 0 and U1 ( x, y ) , and φ is the additionalphase modulation introduced by LCPM, as shown in Fig. 2. Note that for φ π/2, traditionalphase contrast is obtained.The quantity of interest ( x, y) is retrieved as I ( x, y; / 2) I ( x, y; / 2) ( x, y) tan 1 .I ( x, y;0) I ( x, y; ) (3)If we define ( x, y ) U1 ( x, y ) / U 0 , then the phase associated with the image field E( x, y)can be determined [11,28]: ( x, y )sin( ( x, y )) . 1 ( x, y) cos( ( x, y)) ( x, y) tan 1 (4)Note that defines the phase delay associated with the autocorrelation function depicted inFig. 2b.4. Nanoscale topography with SLIMIn order to assess the spatial accuracy of SLIM, we imaged an amorphous carbon filmdeposited on glass and compared the topography measurements against atomic forcemicroscopy (AFM). The topography measurements by SLIM and AFM, respectively, aresummarized in Fig. 3a and 3b. The two types of measurement agree within a fraction of ananometer. Note that both SLIM and AFM are characterized by much smaller errors thansuggested by the widths of the histogram modes, as these widths also reflect irregularities inthe surface topography due to the fabrication process itself. Of course, AFM is not limited bydiffraction in the transverse direction. Unlike AFM, SLIM is non-contact, parallel, and fasterby more than 3 orders of magnitude. Thus, SLIM can optically measure an area of 75 100μm2 in 0.5 s compared to a 10 10 μm2 field of view measured by AFM in 21 minutes.As further comparison, we evaluated background images (i.e., no sample) from SLIM anddiffraction phase microscopy (DPM) [9], an established laser-based technique that wasinterfaced with the same microscope (Fig. 3d and 3e). Due to the lack of speckle effectsgranted by its broad spectral illumination, SLIM’s spatial uniformity and accuracy forstructural measurements is substantially better than DPM’s. To quantify the spatio-temporalphase sensitivity, we imaged the SLIM background repeatedly to obtain a 256-frame stack.Figure 3f shows the spatial and temporal histograms associated with the optical path-lengthshifts across a 10 10 μm2 field of view and over the entire stack, respectively. These noiselevels, 0.3 nm and 0.03 nm, represent the limit in optical path-length sensitivity across theimage and between frames, respectively. The diminished effects of speckles allowedquantitative phase imaging to reveal single atomic layers of carbon, for the first time [29].#140085 - 15.00 USD(C) 2011 OSAReceived 22 Dec 2010; revised 22 Dec 2010; accepted 22 Dec 2010; published 7 Jan 201117 January 2011 / Vol. 19, No. 2 / OPTICS EXPRESS 1020
Several error sources can potentially be diminished further: residual mechanical vibrations inthe system that are not “common path”, minute fluctuations in the intensity and spectrum ofthe thermal light source, digitization noise from the CCD camera (12 bit in our case), and thestability (repeatability) of the liquid crystal modulator (8 bit).Fig. 3. Comparison between SLIM and AFM. (a) SLIM image of an amorphous carbon film.(b) AFM image of the same sample. with the colorbar indicating thickness in nm. (c)Topographical histogram for AFM and SLIM, as indicated. (d) Topography noise in SLIM;color bar in nanometers. (e) Topography noise associated with diffraction phase microscopy, alaser-based technique; color bar in nanometers. (f) Optical path-length noise level measuredspatially and temporally, as explained in text. The solid lines indicate Gaussian fits, with thestandard deviations as indicated.The LCPM maximum refresh rate is 60 Hz, in principle allowing for 15 SLIM images persecond but throughout the manuscript we report imaging at 2.6 frames/ s, as our camera has amaximum acquisition rate of 11 frames/s at full resolution. Acquisition speed could beincreased to video rate by employing a faster phase modulator and camera.#140085 - 15.00 USD(C) 2011 OSAReceived 22 Dec 2010; revised 22 Dec 2010; accepted 22 Dec 2010; published 7 Jan 201117 January 2011 / Vol. 19, No. 2 / OPTICS EXPRESS 1021
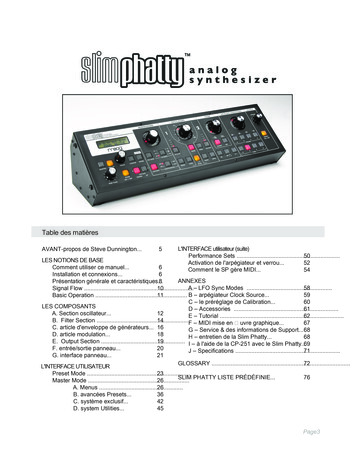
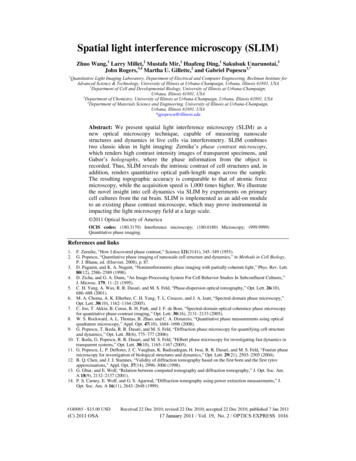
5. Multimodal SLIM-fluorescence imagingFig. 4. SLIM-fluorescence multimodal imaging. (a)-(b) Combined multimodal images ofcultured neurons (19 DIV) acquired through SLIM (red) and fluorescence microscopy of antiMAP2 stained soma and dendrites (green) and DAPI-stained nuclei (blue). (c) Optical pathlength fluctuations along the dendrites (green) and axon (red) retrieved from the inset of (a). (d)Synaptic boutons of a mature hippocampal neuron (33 DIV) immunochemically labeled forsynapsin (green) and MAP2 (blue). Scale bars: 20 μm.A distinct feature of SLIM is that the quantitative phase image is overlaid with the otherimaging channels of the microscope, such as epi-fluorescence, differential interferencecontrast, and phase contrast. Simultaneous fluorescence imaging complements SLIM’sstructural information with the ability to study cellular constituents with molecular specificity.In Fig. 4a and 4b, we show multimodal SLIM-fluorescence imaging of primary hippocampalneurons cultured for 19 days in vitro (DIV). Nucleus (blue) and dendrites (green) are stainedby 4',6-diamidino-2-phenylindole (DAPI) and the somatodendritic marker microtubuleassociated protein 2 (MAP2), respectively. The red line in the inset of Fig. 4a indicates theaxon, as evidenced by the absence of MAP2 staining.In order to quantify the structures observed by SLIM, we traced individual neurites usingNeuronJ (Fig. 4c). Each trace shows the optical path-length fluctuations along each differentneurite. The standard deviation (σ) of the path-length fluctuation is, on average, twice as largefor dendrites as it is for the axon, i.e., 49 nm vs. 25 nm. This result suggests that subtleinhomogeneities are associated with the synaptic structures and these inhomogeneities can berevealed by SLIM as path-length changes. By 3 weeks in dispersed culture, the majority ofdendritic spines generally mature to form presynaptic boutons on the dendritic shafts. After 33DIV, we observe synapsin and MAP2 labeling of putative synaptic elaborations on a maturehippocampal neuron (Fig. 4d).From the quantitative phase measured, other representations of the information can beobtained numerically. Thus, the spatial gradient of the SLIM image simulates DICmicroscopy in Fig. 5c (Media 1). Further, we show that the Laplacian of the image, a second#140085 - 15.00 USD(C) 2011 OSAReceived 22 Dec 2010; revised 22 Dec 2010; accepted 22 Dec 2010; published 7 Jan 201117 January 2011 / Vol. 19, No. 2 / OPTICS EXPRESS 1022
order derivative operation, is even more powerful than DIC in revealing fine structures withinthe cell, as it does not contain significant shadow artifacts in Fig. 5d (Media 1).Fig. 5. (Media 1) SLIM simulated DIC and Laplacian. Since the quantitative phase informationis obtained, all other microscopy such as DIC, phase contrast and dark field can be numericallysimulated through SLIM imaging. Objective: Zeiss EC Plan-Neofluar 40 /0.75. (a) SLIMimaging of glial-microglia cell culture. (b) SLIM imaging with ROI (region of interest)enhancement. (c) Simulated DIC-based on the phase measurement of SLIM. (d) Laplacian ofSLIM image with ROI enhancement. Scale bars: 10 μm.6. Cell dynamics measurementsDue to the extremely low level of spatial noise (0.3 nm) and temporal stability (0.03 nm),SLIM is able to image sub-nanometer dynamics in live cells for periods ranging from secondsto days. For example, we obtained 397 two-dimensional SLIM images of a mixed glialmicroglial cell culture over 13 minutes (Fig. 6). When we compare live-cell measurementsmade by phase contrast vs. SLIM imaging, significant differences are apparent. The cell sizeis clearly overestimated by phase contrast due to the well known halo artifact which makes theborders of the cell appear bright (Fig. 6b). Also, the conventional phase contrast imagesextracted from these data are unable to provide quantitative information about dynamicchanges in optical path-length (Fig. 6b and 6c). Importantly, due to the contrast change of thehalo with the phase shift (Fig. 1b), SLIM is able to minimize this effect when combining thefour phase ring frames (Fig. 6d).Path-length changes due to both membrane displacements and local refractive indexchanges caused by cytoskeleton dynamics and particle transport at two arbitrary points on thecell reveal an interesting, periodic behaviour (Fig. 6d, 6f). At different sites on the cell, therhythmic motions have different periods, which may indicate different rates of metabolic orphagocytic activity. This periodicity can be observed in coordinated cell behaviour as the cellextends broad, dynamic filopodial ruffles under, and above, the neighbouring glial cells inFig. 6 (Media 2).Because of the extremely low noise level of SLIM, the probability distribution of pathlength displacements between two successive frames was retrieved with a dynamic range of#140085 - 15.00 USD(C) 2011 OSAReceived 22 Dec 2010; revised 22 Dec 2010; accepted 22 Dec 2010; published 7 Jan 201117 January 2011 / Vol. 19, No. 2 / OPTICS EXPRESS 1023
over 5 orders of magnitude (Fig. 6g). This distribution can be fitted very well with a Gaussianfunction up to path-length displacements Δs 10 nm, at which point the curve crosses over toan exponential decay. The normal distribution suggests that these fluctuations are the result ofnumerous uncorrelated processes governed by equilibrium. On the other hand, exponentialdistributions are indicative of deterministic motions, mediated by metabolic activity.Fig. 6. (Media 2) SLIM dynamic imaging of mixed glial-microglial cell culture. Two reactivemicroglia probe neighboring cellular environments with highly dynamic lamellipodia and beginengulfing matter through long, thin projections in serum-starved primary mixed glial cultures.Actin polymerization and depolymerization are evident in the membrane area. SLIM revealschanges in optical path length of these dynamic cellular behaviors. Objective: Zeiss EC PlanNeofluar 40 /0.75. (a) Phase map of two microglia cells active in a primary glial cell culture.Solid line box indicates the background used in (g), dashed line box delineates a reactivemicroglial cell used in (b)-(e) and dotted line box indicates the glial cell membrane used in (g).(b) Phase contrast image of the cell shown in (a). psuedocoloration is for light intensity signaland has no quantitative meaning for phase contrast. (c) Registered time-lapse projection of thecorresponding cross-section through the cell as indicated by the dash line in (b). (d) SLIMimage of the cell in (b); the fields of view are the same. The arrows in (b) and (d) point to thenucleus which is incorrectly displayed by phase contrast as a region of low signal. (e)Registered time-lapse projection of the corresponding cross-section through the cell, asindicated by the dash line in (d). (f) Path-length fluctuations of the points on the cell (indicatedin d) showing intracellular motions (blue- and green-filled circles). Background fluctuations(black) are negligible compared to the active signals of the microglia. (g) Semi-logarithmic plotof the optical path-length displacement distribution associated with the glial cell membraneindicated by the dotted box in (a). The solid lines show fits with a Gaussian and exponentialdecay, as indicated in the legend. The distribution crosses over from a Gaussian to anexponential behavior at approximately 10 nm. The background path-length distribution,measured from the solid line box, has a negligible effect on the signals from cells and is fittedvery well by a Gaussian function. The inset shows an instantaneous path-length displacementmap associated with the membrane. Scale bars, 10 μm (a), (b), (d) and (g).SLIM studies of cell dynamics should reveal previously unknown information regardingmembrane motions, cytoskeleton mechanics, and particle transport within the cell. Figure 7#140085 - 15.00 USD(C) 2011 OSAReceived 22 Dec 2010; revised 22 Dec 2010; accepted 22 Dec 2010; published 7 Jan 201117 January 2011 / Vol. 19, No. 2 / OPTICS EXPRESS 1024
(Media 3) shows SLIM imaging of neuron processes, which suggests that SLIM may offer awindow into studying the dynamic processes associated with the formation and transition ofcollateral filopodia into spines, and the dynamics of plasticity-related changes in spinestructure [30]. Note that SLIM can be used to image cellular dynamics, including bidirectionalneurite transport and actin dynamics over extended periods of time without loss inperformance.Fig. 7. (Media 3) SLIM imaging of live hippocampal neuron. in primary cell culture. ThroughSLIM bidirectional microtubule-mediated transport is prominently evident in neurites,individually or in neurite bundles. Slower dynamic leading edges of advancing glialmembranes expand short distances across the coverslip. Actin polymerization anddepolymerization are evident in the membrane area. SLIM reveals changes in optical pathlength of these dynamic cellular behaviors. Colorbar indicates path-length in nm. Objective:Zeiss Plan-Apochromat 63 /1.4 Oil.7. Summary and outlookIn sum, our results demonstrate that rich and quantitative information can be captured frombiological structures using SLIM without physical contact or staining. The main featuresassociated with SLIM are as follows. SLIM provides speckle-free images, which allows forspatially sensitive optical path-length measurement (0.3 nm). It uses common pathinterferometry, which enables temporally sensitive optical path-length measurement (0.03nm).Our initial results demonstrate that rich, previously unobservable information can be capturedin the spatially-resolved cell phase shift map as demonstrated by neuron imaging. The coregistration with the fluorescence channels of the microscope represents a signi
Advanced Science & Technology, University of Illinois at Urbana-Champaign, Urbana, Illinois 61801, USA . impacting the light microscopy field at a large scale. 2011 Optical Society of America . . the range of QPI applications in biology has been largely limited to red blood cell imaging [20-22] or assessment of .