Transcription
Appendix JWEST NEXRAD Analysis
Assessment of Nocturnal Bird Migration Activity fromWeather Radar Data for the Proposed Icebreaker WindEnergy Facility, Lake Erie, OhioPrepared for:Lake Erie Energy Development Corporation1938 Euclid Avenue, Number 200Cleveland, Ohio 44115Prepared by:Chris Nations and Caleb GordonWestern EcoSystems Technology, Inc.200 South Second StreetLaramie, Wyoming 82070January 23, 2017Privileged and Confidential - Not For Distribution
Icebreaker NEXRAD Bird Migration AnalysisSTUDY PARTICIPANTSCaleb GordonChris NationsDamian StansburyJanet StansburyKristin KlaphakeJill OttmanWEST, Inc.Western EcoSystems TechnologyProject Manager, co-authorStatistician, lead authorData TechnicianData TechnicianGIS TechnicianTechnical EditoriJanuary 23, 2017
Icebreaker NEXRAD Bird Migration AnalysisTABLE OF CONTENTSINTRODUCTION . 1METHODS . 2Project Site, NEXRAD Stations, and Radar Sample Areas. 2Data Selection, Downloading, and Pre-Processing . 6Target Filtering . 7Analysis . 9Target Direction . 9Target Density .10RESULTS .10Migration Direction .11Migration Intensity .14DISCUSSION.23Caveats.23Summary and Conclusion .23REFERENCES .25LIST OF TABLESTable 1. Sampling heights of the radar beam from the KCLE station above the proposedIcebreaker Wind Energy Facility. . 5Table 2. Number of radar scans by station, season, and year .10Table 3. Number of scans with useable data by sample area, season, year, and radarelevation. Sample areas are designated as in Figure 2: PA Project Area; CA Comparison Area. .11Table 4. Radar target direction summary: mean, concentration (r), and standard deviation(s) by station, season, year, and radar elevation. .14Table 5. Reflectivity by sample area (PA Project Area, CA Comparison Area). Each cellcontains mean (top) and standard error (bottom) of reflectivity. (See also Figure 6.) .15WEST, Inc.iiJanuary 23, 2017
Icebreaker NEXRAD Bird Migration AnalysisLIST OF FIGURESFigure 1. Location of the proposed Icebreaker Wind Energy Facility in Lake Erie, in relationto the KCLE NEXRAD station in Cleveland, OH and the KBUF station in Buffalo,NY. . 2Figure 2. NEXRAD stations (red circles) and sample areas (gray shading), all at the sameranges (green circles) with same arc length (25 degrees) as the Project Area at (a)Cleveland (KCLE) and (b) Buffalo (KBUF). The Project Area in (a) shows the windturbine locations (small blue circles) for the proposed Icebreaker Wind EnergyFacility and bounding polygon (red line) used to define sample area dimensions. . 3Figure 3. NEXRAD beam height relative to the lake surface, above the Project Area (X-axislimits) and, more specifically, above the wind turbines (gray shading). Solid linesindicate the beam centers, and dotted lines represent approximate beamboundaries of the 0.50 (blue) and 1.50 azimuth radar beams. . 5Figure 4. Rose plots showing target movement directions at KCLE at radar beam elevationsof 0.5 (a and b) and 1.5 (c and d) in Fall (a and c) and Spring (b and d). Red linesindicate mean direction (radial segment) and 95% confidence interval (perpendicular“T” segment). .12Figure 5. Rose plots showing target movement directions at KBUF at radar beam elevationsof 0.5 (a and b) and 1.5 (c and d) in Fall (a and c) and Spring (b and d). Red linesindicate mean direction (radial segment) and 95% confidence interval (perpendicular“T” segment). .13Figure 6. Mean reflectivity (bar heights) plus 1 standard error (error bars) at the sevensample areas: (a) degrees overall – averaged across season, year, and elevation(b) by season – averaged across year and elevation (c) by elevation – averagedacross season and year (d) by year – averaged across season and elevation. .16Figure 7. Mean reflectivity (bar heights) plus 1 standard error (error bars) by hour after civilsunset at KCLE and KBUF .18Figure 8. Mean reflectivity by day at the Project Area (KCLE) in (a) fall and (b) spring. Bothplots represent 0.5 elevation averaged across year. .19Figure 9. Mean reflectivity by day at Comparison Area 2 (KCLE) in (a) fall and (b) spring.Both plots represent 0.5 elevation averaged across year. .20Figure 10. Mean reflectivity by day at Comparison Area 3 (KCLE) in (a) fall and (b) spring. .21Figure 11. Mean reflectivity by day at Comparison Area 6 (KBUF) in (a) fall and (b) spring. .22WEST, Inc.iiiJanuary 23, 2017
Icebreaker NEXRAD Bird Migration AnalysisINTRODUCTIONThis study examines NEXRAD weather radar data from Cleveland, Ohio and another radarstation in Buffalo, New York for the purpose of assessing nocturnal bird and bat migration abovethe proposed site of the Icebreaker Wind Energy Facility in Lake Erie, and several comparisonareas near Cleveland and Buffalo. The acronym NEXRAD represents “NEXt generation RADar”,a network of approximately 160 Doppler radar stations maintained by the National WeatherService, and designed to monitor precipitation throughout the United States. NEXRAD data arestored and disseminated in two forms–as raw, high resolution Level II data, and as more highlyprocessed, lower resolution Level III data. Level II products include reflectivity (a measure of thedensity of reflecting targets), radial velocity (the component of velocity either toward or awayfrom the radar unit), and several other products (NOAA 2016). Most radar ornithological studiespublished to date have relied on analysis of reflectivity and radial velocity (e.g., Diehl et al. 2003,Gauthreaux and Belser 2003, Bonter et al. 2008, Buler and Dawson 2014, Farnsworth et al.2016).During operation, a radar unit sweeps horizontally through 360 degrees at each of severalelevation angles (usually including 0.5 , 1.5 , 2.5 , 3.5 , and 4.5 ) (NOAA 2016). The half-powerbeam width is approximately 0.95 degrees (Raghavan 2013), though energy return is greatest inthe center of that beam. As of 2008, so-called “super resolution” Level II data for the lowest twoelevations (0.5 degrees and 1.5 degrees) available from most NEXRAD stations have azimuthalresolution of 0.5 degrees and range resolution of 250 m (Torres and Curtis 2007). Thus,returned energy represents all targets within a section of a cone with 0.5 degrees “width” and“depth” of 250 m. Because of beam spread, the volume of this cone section increases withincreasing range. From an analysis standpoint, the cone section represents the mostfundamental sample unit for NEXRAD data. In the Methods section below, these cone sectionsare referred to as “pixels” of the polar coordinate system defined by radar azimuth and range.Analysis of NEXRAD data for ornithological research depends on separating targets that aremost likely to be birds (and/or bats) from other radar targets (Gauthreaux and Belser 1998). Thisdata filtering process operates on the assumption that birds can fly opposing the wind or, ifflying in the same direction as the wind, they can fly at greater than wind speed. Other targetswill move with the wind (e.g., light precipitation or airborne dust) or only slightly faster than thewind (e.g., large swarms of insects). Thus, filtering out the slower-moving targets relies onindependent measurements of wind speed and direction. Radiosonde wind data are obtainedfrom weather balloons that are launched regularly from 92 stations in North America and thePacific Islands (http://www.ua.nws.noaa.gov/). Many, though not all, radiosonde locations arecoincident with NEXRAD stations. Data collected by instruments suspended from the balloonare radioed back to the station on the ground. At stations without radiosonde operations, windsat altitude must be estimated by other means, for example, from ground-based measurements(e.g., Archibald et al. 2016) or atmospheric wind models (e.g., Livingston 2008).WEST, Inc.1January 23, 2017
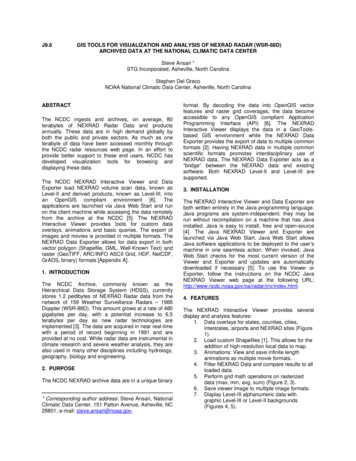
Icebreaker NEXRAD Bird Migration AnalysisMETHODSProject Site, NEXRAD Stations, and Radar Sample AreasThe proposed Icebreaker Wind Facility will consist of six turbines (with a seventh alternate) in asingle row, located approximately 14 km (9 miles) from the nearest point on the Lake Erieshoreline and 23 km (14 miles) from the KCLE NEXRAD station in Cleveland, Ohio (Figure 1).For the purpose of creating a reasonably sized sample area above the project, first, a boundarywas defined as the 3.2 km (2 mile) buffer around the line segment connecting the turbines. Thebuffer was a racetrack-shaped polygon that provided range and azimuth limits for a NEXRADsample area (Figure 2a), hereafter referred to as the Project Area. The Project Area was awedge-shaped polygon with minimum range of 18 km, maximum range of 27.75 km, and arclimits spanning 25 degrees. Given the radar resolution for range (250 m) and azimuth (0.5 ), theProject Area covered 39 range gates and 50 radar azimuths, or a total of 1950 pixels ( 39 50). The entire Project Area was above water (Figure 2a). Several comparison areas werecreated with the same size, range limits, and arc length as the Project Area. By design, theseareas sampled air spaces at the same ranges so that, for fixed target sizes and densities withinFigure 1. Location of the proposed Icebreaker Wind Energy Facility in Lake Erie, in relation to theKCLE NEXRAD station in Cleveland, OH and the KBUF station in Buffalo, NY.WEST, Inc.2January 23, 2017
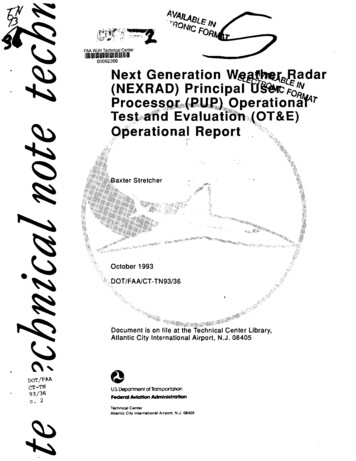
Icebreaker NEXRAD Bird Migration Analysis(a)(b)Figure 2. NEXRAD stations (red circles) and sample areas (gray shading), all at the same ranges(green circles) with same arc length (25 degrees) as the Project Area at (a) Cleveland(KCLE) and (b) Buffalo (KBUF). The Project Area in (a) shows the wind turbine locations(small blue circles) for the proposed Icebreaker Wind Energy Facility and boundingpolygon (red line) used to define sample area dimensions.WEST, Inc.3January 23, 2017
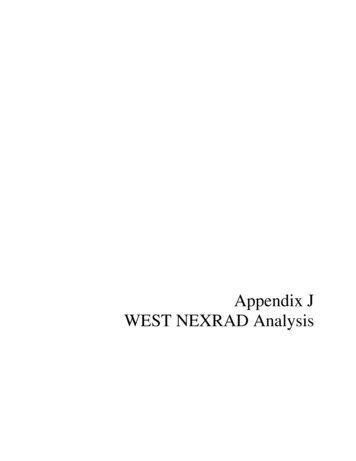
Icebreaker NEXRAD Bird Migration Analysiseach space, return energy would not differ. Furthermore, these areas sampled the samealtitudes relative to the NEXRAD stations (though, altitude relative to ground or lake surfacewould vary somewhat). Three comparison areas were defined for KCLE (Figure 2). ComparisonAreas 1 and 2 were situated above the Lake Erie shoreline such that approximately half of eacharea was above water and half was above land. Comparison Area 3 was located to the south ofKCLE, entirely above land. Similarly, three comparison areas were defined for KBUF (Figure2b). Comparison Area 4 was situated to the southwest of KBUF, entirely above water, thoughcloser to the lake shore than the Project Area at KCLE. Comparison Area 5 was adjacent toComparison Area 4, situated partly above water and partly above land, and Comparison Area 6was entirely above land to the northeast of KBUF.As described in the next section, only data from the lowest two radar elevations (0.5 degreesand 1.5 degrees) were retained for analysis. The height of the radar beam above the lakesurface at the Project Area (i.e., the sample area shown in Figure 2a) was calculated accountingfor radar height, earth curvature, and atmospheric refraction (Doviak and Zrnic 2006). Inparticular, beam height, H, was calculated as:4244𝐻 𝑑2 (3𝑟) 2𝑑3𝑟sin(𝜃) ℎ𝑎 3𝑟where d radar range (distance from the radar unit to the point of interest on the earth’ssurface), r earth radius, radar elevation, and ha height of the radar antenna relative tothe point of interest. In addition to height of the beam center, the heights of the 3 dB (halfpower) points were also calculated. As shown in Figure 3, the height of the center of the radarbeam above the Project Area ranged from 257 to 366 m at the 0.5 degree elevation and from574 to 847 m at the 1.5 degree elevation. Figure 3 also shows that at the 0.5 degree elevationthe height of the lower 3 dB point ranged from 105 to 135 m above the Project Area. Thus,there was some overlap of the radar beam and the rotor-swept zone for the proposed turbines,which have a maximum blade tip height of 146 m. Figure 3 shows the area occupied by turbines(based on the proposed locations and height) as a semi-transparent gray rectangle, thusillustrating the overlap region. Table 1 provides more detail about radar beam height directlyabove the turbine locations. Note, for instance, that the lower 3 dB point ranged from 114.4 to124.6 m directly above the turbine locations. Birds flying within the overlap region would likelybe detected by the KCLE NEXRAD, though more detailed inference about target heights is notpossible. Chilson et al. (2012) maintain that because birds are “bright” targets (relative toprecipitation), a more appropriate characterization of beam width would be based on the 6 dB(quarter-power) points. That wider beam would imply greater overlap with the rotor-swept zonewithin the Project Area, i.e., detection of birds at lower heights (as well as at greater heights).WEST, Inc.4January 23, 2017
Icebreaker NEXRAD Bird Migration AnalysisFigure 3. NEXRAD beam height relative to the lake surface, above the Project Area (X-axis limits)and, more specifically, above the wind turbines (gray shading). Solid lines indicate the0beam centers, and dotted lines represent approximate beam boundaries of the 0.5 (blue)0and 1.5 azimuth radar beams.Table 1. Sampling heights of the radar beam from the KCLE station above the proposedIcebreaker Wind Energy Facility.RadarPosition WithinBeam Height (m)ElevationBeamNear (21.36 km)Far (24.63 km)Lower114.4124.6Center291.9329.20.5 Upper469.3533.7Lower487.2554.4Center664.6758.91.5 Upper842.0963.4Heights are given for the nearest and farthest wind turbines from KCLE. “Lower” and “Upper” positionswithin the beam refer to the 3 dB (half-power) points for beam width of 0.95 . Beam heights account forland elevation and tower height at the KCLE site relative to the lake surface.WEST, Inc.5January 23, 2017
Icebreaker NEXRAD Bird Migration AnalysisData Selection, Downloading, and Pre-ProcessingLevel II NEXRAD data were downloaded from the database maintained by the National bsite(https://www.ncdc.noaa.gov/has/has.dsselect). Data were obtained from both the primary radar station(KCLE at Cleveland, OH) and the comparison station (KBUF at Buffalo, New York) for thenighttime hours during the spring and fall migratory periods, defined as April 1 – May 31 andAugust 20 – October 20, respectively. Fall data were obtained for the three years 2013 – 2015,and spring data were obtained for the years 2014 – 2016. While Fall 2016 data were availablefrom KCLE, comparable data for the same period were not available from KBUF.Each downloaded compressed file containing all data for an hour was decompressed intomultiple files, each representing a separate radar scan at multiple elevations; typically, weatherradars conduct 5 – 10 scans per hour. The NEXRAD data in these decompressed files wereextracted from the native binary format using the Weather and Climate Toolkit, a Java programobtained from the NCEI (http://www.ncdc.noaa.gov/wct/). The Toolkit was used to export eachfile into NetCDF (Network Common Data Form) format (http://www.unidata.ucar.edu/software/netcdf/). NetCDF is a scientific data format that is machine independent and is readily importedby a variety of analysis software. Each NetCDF file contained all data from the native NEXRADfile in the original polar coordinate system (radar azimuth and range). NetCDF files were queriedusing Matlab, and only those files representing NEXRAD operation in Clear Air Mode (VolumeCoverage Patterns 31 or 32) were retained for further processing and analysis. Filesrepresenting operation in Precipitation Mode, i.e., not in Clear Air Mode, were assumed to bedominated by precipitation and thus have little, if any, interpretable data indicative of birdmigration. Other studies have excluded data due to precipitation (e.g., Farnsworth et al. 2016).Furthermore, Precipitation Mode data have lower resolution than data from Clear Air Mode,making analysis of biological targets more difficult (Diehl and Larkin 2005). Files were furtherfiltered to retain only radar scans occurring between civil sunset (30 minutes after sunset) andcivil sunrise (30 minutes before the following sunrise). This temporal filtering focused on thenocturnal period when migration is most intense (Diehl and Larkin 2005, Farnsworth et al.2016), and also minimized contamination of scans due to sun strobes, which tend to occur nearsunset and sunrise (Gauthreaux and Belser 2003).All remaining NetCDF files were imported into Matlab and subset to retain “Super Resolution”reflectivity and radial velocity at 0.5 degree and 1.5 degree elevations; that is, all other Level IIproducts and all higher elevations were discarded. Furthermore, data were subset to retainranges less than 50 km. These subsetting steps led to greatly reduced file sizes and thussubsequently facilitated faster data processing and analysis. At the same time, 50 km rangeincluded substantial area beyond the Project site and similar comparison areas (describedbelow) to facilitate visual pre-screening of radar scans.Radar data were visually pre-screened in two stages to identify problems in radar scans. In thefirst stage, a technician viewed each scan at each elevation, displayed as a reflectivity-velocitypair, and flagged scans with potential problems such as precipitation (light precipitation mayoccur in Clear Air Mode), radar malfunction, or other anomalies. In the second stage, a moreWEST, Inc.6January 23, 2017
Icebreaker NEXRAD Bird Migration Analysisexperienced person viewed those scans that had been flagged, and made a final determinationregarding data acceptability. In particular, each sample area within each of the provisionallyflagged scans was given a final flag if it was considered unacceptable, for example, becauseprecipitation occurred within that area. In many cases, only one or two sample areas wereflagged, while the remaining sample areas were considered acceptable. Flagged sample areaswere not included in subsequent analysis. Other than pre-screening as described, all data wereretained without regard to intensity of presumed migration (reflectivity values) or direction(inferred from radial velocity images); that is, there was no attempt made to pre-selectoccurrences of pronounced bird migration.Target FilteringIdentification of likely bird migration required separation of targets based on estimated airspeeds under the assumption that targets with relatively high air speed were birds (or bats) andthose with air speeds closer to the wind were either completely passive (e.g., dust, smoke, orlight precipitation) or weak fliers such as insects. An air speed threshold of 5 m/s (Buler andDawson 2014) was used to separate these two target classes; i.e., targets with air speedgreater than 5 m/s were interpreted as birds. Calculation of air speed required estimates of bothtarget ground speed and wind speed. Target ground speeds were calculated from NEXRADradial velocities, while wind speeds were based on vertical wind profiles from either radiosondeor modeled wind data.NEXRAD radial velocity data does not provide a direct estimate of target ground velocity, exceptin those cases when targets are moving directly towards or away from the radar station. Underthe assumption that target speed and direction are uniform across broad areas (typically, thoughnot necessarily, at 360 degrees around the radar unit), they can be estimated using the “windretrieval” techniques developed by meteorologists. The Velocity Azimuth Display (VAD)algorithm (Browning and Wexler 1968) provides one such approach. Regression is generallyused to estimate mean velocities and also yields estimates of variability in radial velocity, thoughit is computationally intensive when radar scans number in hundreds to thousands. Liang andWang (2009) describe a VAD technique that is simpler than regression, though it does not yieldany estimate of variance.Target ground velocity was calculated following Liang and Wang (2009) with the assumptionthat velocity was uniform around the circle at a given radar range (thus, uniform at a givenheight), but potentially varying at different ranges (heights). Letting i represent radar azimuth(i 1, , 720), 𝑉𝜃𝑖,𝑗 represent radial velocity at the ith azimuth and the jth range (j 1, , 39, forranges within the sample areas), then the east-west and north-south velocity components at thejth range were calculated, respectively, as:𝑢𝑗 𝑣𝑗 WEST, Inc. 𝑖 𝑉𝜃𝑖,𝑗 cos (𝜃𝑖 ) 𝑖 cos2 (𝜃𝑖 ) 𝑖 𝑉𝜃𝑖,𝑗 sin(𝜃𝑖 ) 𝑖 sin2 (𝜃𝑖 )7January 23, 2017
Icebreaker NEXRAD Bird Migration AnalysisThen, ground speed, Vj,g, and direction, j,g, were recovered, respectively, as:𝑉𝑗,𝑔 𝑢𝑗2 𝑣𝑗2𝜙𝑗,𝑔 tan 1 (𝑣𝑗 𝑢𝑗 )In addition to their use in calculating target air speeds (see below), calculated ground directionswere retained for subsequent analysis of migration direction.Radiosonde data including wind speed and direction were obtained for KBUF from a websitemaintained by the University of Wyoming Department of Atmospheric Science (http://weather.uwyo.edu/upperair/sounding.html). These data were available at 12-hour intervals (at00:00 and 12:00 UTC). For KCLE, no radiosonde data were available, so modeled verticalprofile wind data were obtained from the Earth Systems Research Laboratory (ESRL, part of theNational Oceanic and Atmospheric Administration) (http://www.esrl.noaa.gov/ psd/map/profile/).The modeled R1 Reanalysis data from ESRL are based on radiosonde and othermeasurements, and are available on a global 2.5 degree grid (latitude and longitude) at 6-hourintervals (00:00, 06:00, 12:00, and 18:00 UTC). For KCLE at 41.41 north, 81.86 west, thenearest model grid point was 42.50 north, 82.50 west.Two-dimensional linear interpolation of vertical profile wind (whether radiosonde or modeled)was performed to estimate wind speed and direction across (1) time, to match the times atwhich radar scans were conducted, and (2) height, to match the calculated height of the radarbeam at each range value within the sample areas. Interpolation was conducted separately foreach night of radar data. Given the relatively coarse temporal resolution of the wind data, therewere typically two to four sets of wind data spanning each night (before, during, and after thenight’s radar scans). Similarly, given the height resolution of the wind data and the relatively lowheights of the radar beam within the sample areas, there were at most six height observations ineach modeled wind dataset and at most 30 height observations in each radiosonde dataset.Interpolation was conducted for all radar beam heights within the sample areas at both the 0.5degree and 1.5 degree radar beam elevations. Wind speed was interpolated directly. For winddirection, the cosine and sine transformations were calculated first, each transform wasseparately interpolated across time and height, and then directions were recovered as thearctangent transformation of the two components. Aside from the trigonometric transformationsfor direction, linear interpolation was not substantially more complicated than nearest-neighborinterpolation since both required calculation of numerous differences in both time and height.Representing wind speed and direction at the jth range (height) as Vj,w and j,w, respectively, airspeed, Vj,a was calculated as:22𝑉𝑗,𝑎 𝑉𝑗,𝑔 𝑉𝑗,𝑤 2𝑉𝑗,𝑔 𝑉𝑗,𝑤 cos(𝜙𝑗,𝑔 𝜙𝑗,𝑤 )If target air speed at the jth range was less than 5 m/s, then the corresponding reflectivity valueswithin each sample area were set to missing values, i.e., those reflectivity values were excludedWEST, Inc.8January 23, 2017
Icebreaker NEXRAD Bird Migration Analysisfrom further analysis. Otherwise, if target air speed exceeded 5 m/s, reflectivity values at thatrange were considered to be migrating birds and were retained for analysis.In a final filtering step, each radar scan was evaluated and the data within each sample areawere retained for analysis if at least 20 percent of the pixels had non-missing reflectivity values.Thus, certain sample areas within a scan might have been eliminated while the remainingsample areas from that scan were retained.For subsequent analysis, reflectivity values were transformed from the logarithmic (dBZ) to thelinear (Z) domain using the relationship:𝑍 10𝑑𝐵𝑍 10as in Diehl et al. (2003).AnalysisBefore any further processing, target direction data were averaged for each radar scan, at eachbeam elevation. Given the limited spatial resolution of both the VAD “wind retrieval” techniqueand the vertical profile wind data (whether from radiosonde or wind model), calculated targetdirection was the same for all sample areas at each radar station, though it might varysomewhat with beam elevation. Because direction is a circular variable, average direction, 𝜙̅,was calculated as𝜙̅ 𝑡𝑎𝑛 1 (𝑌 𝑋), where𝑋 𝑛𝑖 1 cos(𝜙𝑖 ) 𝑛and𝑌 𝑛𝑖 1 sin(𝜙𝑖 ) 𝑛where i was the direction at range i (Batschelet, 1981). On the other hand, target reflectivitydata were averaged separately for each sample area, at each radar elevation within each scan.That is, each sample area was represented by a single mean reflectivity value (for each scanand elevation); those mean values were treated as the observations in subsequent datasummaries.Target DirectionSummaries of target direction included the mean (calculated as above) by station, season, andelevation, or by station, season, year, and elevation. In addition, summaries included angularconcentration, r, and standard deviation, s. Angular concentration (Batschelet, 1981) wascalculated as𝑟 𝑋 2 𝑌 2where X and Y were the averages of the cosine and sine components of direction, respectively,as above. Angular concentration can vary between 0 (low concentration) and 1 (highconcentration), with 0 occurring if directions are uniformly distributed on the circle, and 1occurring if all directions are coincident. Angular standard deviation (Mardia 1972) wascalculated asWEST, Inc.9January 23, 2017
Icebreaker NEXRAD Bird Migration Analysis𝑠 2log e (𝑟)Ninety-five percent confidence intervals for mean direction were calculated using bootstrapping(Manly 2006). In particular, 1000 bootstrap samples were taken in which the data were sampledwith replacement, the mean direction was calculated for each sample, and the lower and upper95% confidence limits were calculated as the 2.5th and 97.5th percentiles, respectively.Target DensityRadar reflectivity representing target density was averaged in various ways to makecomparisons between sample areas or radar stations, by radar elevation, hour of the night,date, season, or year. In all cases, means and standard errors were calculated for graphicalpresentation. Serial correlation in reflectivity was not assessed, nor were standard errorscorrected for such correlation. Reflectivity was not converted to bird density since suchconversion is based on the important assumptions that target size is known and is uniform(Chilson and Adams 2014). Furthermore, conversion does not facilitate comparisons within thisstudy.RESULTSAfter eliminating radar scans due to precipitation or other problems, 24,029 scans remained foranalysis. In this case, a single scan refers to the data collected at both the 0.5 degree and 1.5degree elevations, and a scan would have been retained for analysis if there were useable datain at least one of the sample areas at one elevation, though for most scans, there was useabledata in all samp
Cleveland (KCLE) and (b) Buffalo (KBUF). The Project Area in (a) shows the wind turbine locations (small blue circles) for the proposed Icebreaker Wind Energy Facility and bounding polygon (red line) used to define sample area dimensions. . 3 Figure 3. NEXRAD beam height relative to the lake surface, above the Project Area (X-axis