Transcription
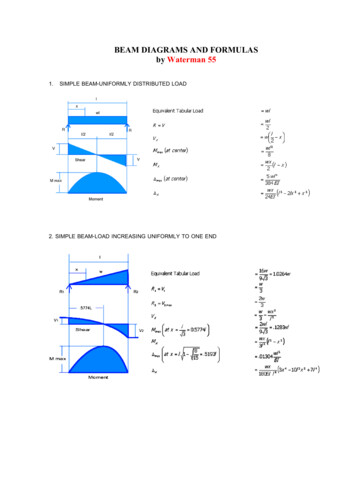
STEREOTACTIC BEAM CHARACTERIZATION USINGTHE IBA STEALTH REFERENCE DETECTOR1Jacob A. Gersh, PhD1,2Gibbs Cancer Center and Research Institute – Greer, SC2Spectrum Medical Physics, LLC – Greenville, SCI. INTRODUCTIONLinear accelerators used in medicine deliver radiation as a pulsed field, causing a fluctuation inthe signal acquired by detectors used to characterize the beam. This fluctuation is mitigated by twomethods1. The first method is the statistical approach, where several measurements are acquired in orderto obtain an average value which suppresses the inherent signal fluctuations. This can be a very accuratemethod, though it is a very time-consuming technique. The preferred method is the use of a referencedetectors placed at a fixed position in-air, inside the radiation field, and placed in the edge of the field soas to minimally perturb the field. Since both the reference detectors and the field detector will be subjectto the same fluctuations, the fluctuations can be easily mathematically suppressed, thus giving rise tomore stable signal acquisition and more efficient scanning2. As fields approach smaller sizes, as is thecase for stereotactic fields, the maintenance of the reference detector in the radiation field gives rise to anuneven perturbation of the field (as seen by the field detector). This perturbation becomes especiallylarge with the case of diodes which, though small in size, contain high-Z components which induce ahigher magnitude of perturbation of the beam3. Additionally, the time saved by using shorter integrationtimes is lost by the requirement that the user continually reenter the vault in between field sizes in order toreadjust the reference field so that it remains in the edge of the field.I.A. PurposeThe technique proposed in this study uses a transmission detector, similar in function to themonitor chambers of a linac, as the scanning reference chamber. Evaluated in this study is the StealthDetector (IBA Dosimetry), a transmission detector which perturbs the primary beam minimally, evenly,and consistently. The use of this detector would give rise to a time savings associated the user not havingto perform a readjustment of the reference detector prior to each field-size change. The purpose of thisstudy is threefold. First, it is important to determining the extent by which the beam is perturbed along thecentral axis by the inclusion of this transmission detector. Next, is the determination of the effect on theenergy spectra of the field by evaluating percent depth dose scans using the transmission detector andcomparing those to scans using standard reference detectors. Finally, profile scans using both types ofreference detectors are compared.Fig. 1. The Stealth Detector (IBA Dosimetry) is attached to an interface plate which is securelyslid into the interface mount of the Varian TrueBeam (Version 1.6).
2J. A. Gersh: Stereotactic Scanning using the Stealth DetectorII. MATERIALS AND METHODSThe Stealth Detector is a transmission detector with a circular active area with a diameter of 72mm. The active detecting area is constructed of carbon fiber and has a total attenuation equivalent of lessthan 0.5mm Al. The detector is attached to a Varian TrueBeam using the interface mount which is 57.4cm from the source. With the maximum detector width of 70mm at a distance of 1.75 cm (detectorthickness) below the interface mount, the largest field measurable with this detector is 8.44 cm x 8.44 cm.The Stealth detector is held at a negative bias voltage of -420 V. Central axis point measurements,percent depth dose, and profile data are acquired using a Blue Phantom 2 scanning system (IBADosimetry) with a TN60019 microDiamond detector (PTW-Freiberg)4,5. For scans using an in-fieldreference detector, another TN60019 detector is used. This is waterproof solid-state detector with a 0.004mm3 sensitive volume. This detector is irradiation axially with its effective point of measurement being 1mm from the detector tip. When used as a reference detector, the TN60019 is placed at 15 degrees abovethe horizontal, exposing the effective point of measurement by allowing the detector to physicallyprotrude into the field. The TN60019 serves well as a reference chamber because of three major designaspects: it is nearly water-equivalent, it has a small collecting volume, and it produces a large signal. Alldata are acquired using a Varian TrueBeam (Varian Medical Systems, Palo Alto, CA) Version 1.6 using a6 MV beam. The software used to acquire data is IBA OmniProAccept v7.4.18C, which as an importantfeature (vital required for the current application) which allows separate bias voltages to be set fordifferent detector channels.II.A. Central Axis Point MeasurementsAs the first step of this study, the actual transmission of the 6 MV beam through the Stealthdetector is determined for smallest field of studied (0.5 cm x 0.5 cm). Transmission is determined byplacing a single detector at 100 cm SSD at a depth of 10 cm in the water phantom, and calculating theratio of the signal measured with the reference detector in-place to the signal measured without thereference detector in-place. A similar measurement is performed, except that the 60019 referencedetector is placed in the edge of the open field with a constant intrusion of approximately 2.0 mm.Though the reference detector is not connected or used for measurements, its inclusion into the primaryfield for CAX point measurements allows for a quantification of the perturbation association with its use.Similarly, this is performed for a 0.5 cm x 0.5 cm field size, yielding the detector’s “effectivetransmission.”II.B. Evaluation of Field PerturbationTo evaluate the perturbation of the field caused by the inclusion of the reference detectors in theprimary field, depth-dose scans are acquired using three different reference detector configurations: usingno reference detector, using a Stealth detector as a reference detector, and using a microDiamond detectoras a reference detector. This test only evaluates the physical presence of the reference detector, not theactual functionality of the system when utilizing the specific reference detector. In all cases, data areacquired using a "no reference" configuration, where linac output fluctuation is suppressed by acquiringmore signal. The analysis of these data provides possible effect the transmission detector has on theenergy spectrum of the photons reaching the primary field detector (for the case of the Stealth detector)and the perturbation caused by the presence of the reference detector (for the case of the microDiamondreference chamber). These scans are performed with the tank being set to 100 cm SSD and the beambeing collimated to irradiate fields from 0.5 cm x 0.5 cm to 4.0 cm x 4.0 cm. For the current study, scandata are acquired using a step-by-step mode, where each data point is acquired for 5 seconds following a1-second stabilization period. Positioning speed between subsequent point measurements is 1 cm/s. Thestep distances are 0.5 cm. Based on these parameters, a set of 5 scans are acquired in serial, and theirIBA Dosimetry Whitepaper ‐ August 2014
3J. A. Gersh: Stereotactic Scanning using the Stealth Detectorcomparison is made without normalization. Furthermore, in these scans, and all scans presented in thecurrent study, no data manipulation has been performed (through curve fitting for example).Fig 2. Left. For the smallest field sizes studied in this project, raw PDD point measurements are acquired using step-by-stepacquisition modes (0.5 cm steps) with all results presented in arbitrary units. No smoothing or normalization is performed. Atdmax, this plot shows the extent by which the primary beam is attenuated. Right. This identical plot with each curve normalized,and again, no smoothing is performed. This set of plots shows that while primary attenuation effects can be reduced usingnormalization, spectral changes remain at-depth, though only for the smallest field size studied.II.B.1. PDD MeasurementsPercent Depth Dose Measurements are acquired at 100 cm SSD using the three referenceconditions described herein: not using any reference detector, using the Stealth detector, and using amicroDiamond detector as a reference detector. The scan parameters of no-reference condition areidentical to those in the previous section. For PDD measurements using the Stealth detector, thestabilization period is 0.8s while the point acquisition time is 1 second. All other parameters remainconsistent, as shown in Table I.II.B.2. Profile MeasurementsPhoton profile measurements are acquired at 100 cm SSD at a depth of 10 cm using themicroDiamond detector (as the primary detector) using all three reference scenarios; one set without areference detector, one with the Stealth detector, and one with a similar microDiamond detector. Thepurpose of these scans is to compare the performance of a scanning system which uses the Stealthdetector to the standard scenario, where a similar detector is used in-air at the edge of the field. Scans areperformed for field sizes ranging from 0.5 cm x 0.5 cm to 4.0 cm to 4.0 cm and acquired using a scanspeed of 0.5 cm/s. For profile measurements using the Stealth detector and the microDiamond detector,the stabilization period is 0.8s while the point acquisition time is 1 second. All other parameters remainconsistent, as shown in Table II.IBA Dosimetry Whitepaper ‐ August 2014
4J. A. Gersh: Stereotactic Scanning using the Stealth DetectorIII. RESULTS AND DISCUSSIONIII.A. Central Axis Point MeasurementsThe transmission measured through the Stealth detector for the 0.5 cm x 0.5 cm is 0.980. Themean effective transmission measured through the water-equivalent 60019 microDiamond detector is1.007. This perturbation is caused by the additional scatter induced by the inclusion of the detector.III.B. Beam Perturbation EvaluationIn Figure 2, two effects are seen. As shown in the left pane, (the non-normalized of the twoplots), the raw signal intensity of the PDD curve is lower for the stealth detector than the open beam as anaffect of primary beam attenuation. As shown in the right pane of Figure 2, when these curves arenormalized, the attenuation effect is reduced. The remaining effect is the spectral difference between theopen beam and the beam which traverses a reference chamber prior to irradiation a field detector. Thisoccurs with equal magnitude with both reference detectors used in the study, and both only present adeviation of a field size of 0.5 cm x 0.5 cm. This deviation likely has more to do with characteristicsmall-field detector performance than its performance as a reference detector.III.C. Depth Dose and Profile MeasurementsIn the left column of Figure 3, PDD curves are compared for all field sizes and for each referencedetector configuration (including no reference detector). With the exception of the PDD curves for the0.5 cm x 0.5 cm field, there is close agreement between the performances of both reference detectorconfigurations (as compared with the gold standard). In the right column of Figure 3, profiled curves at10 cm in-water depth are compared for all field sizes and for each reference detector configurationIBA Dosimetry Whitepaper ‐ August 2014
5J. A. Gersh: Stereotactic Scanning using the Stealth Detector(including no reference detector). As is the case of the PDD curves, there is a close agreement betweenthe profiles measured with both reference detectors and those measured without a reference detector.III.C.1. EfficiencyInarguably, the most accurate method in which to acquire scan data would be a utilizing a slowpoint-by-point acquisition with data being inherently statistically smoothed by performing long pointmeasurements. In the current study, the gold standards for comparative analysis are data acquired usingthis technique. The scan parameters for these accurate scans are summarized in Tables I and II. Whileproviding good data, this technique lacks the realistic efficiency to make it clinically implementable.Therefore, a balance between accuracy and data acquisition efficiency is continually being sought. TablesI and II also show the approximate time required to perform the specific scan using the specific techniqueand subsequent reference detector configuration. A substantial time savings is associated with the use ofreference detectors instead of single-detector methods. For the PDD scans acquired during this study, dheuse of the Stealth detector reduced the PDD scan time by approximately 75% per scan while the use ofthe microDiamond detector reduced scan time by almost 50%. The amount of time savings depends onthe number of points acquired all reference detector configurations. For the case of the microDiamonddetector (and in the case of all comparable non-transmission reference detectors), additional scan time isassociated with the manual placement of the detector in the beam edge. This will add several minutes toevery change in collimator size. While these time differences appear small when presented as a “perscan” value, they combine to cause a large time decrease in scan efficiency. As shown in Table II, similardifferences in scan time are apparent.IBA Dosimetry Whitepaper ‐ August 2014
6J. A. Gersh: Stereotactic Scanning using the Stealth DetectorFig 3. Normalized PDD curves (left column) and 10 cm-deep profile curves (right column) are shown for all five field sizesevaluated in the current study.IBA Dosimetry Whitepaper ‐ August 2014
7J. A. Gersh: Stereotactic Scanning using the Stealth DetectorIV. CONCLUSIONSThis study compares the use of the Stealth reference detector to the two common reference scenarios inscanning: not using a reference detector and using a detector that is similar to the field detector as areference chamber. Currently, the use of no reference detector is the most accurate method of beamscanning, but is the most time consuming. In order to suppress the effects of variable dose rates of apulsed medical linear accelerator, measurements must be made using long integration times. The othermethod includes the use of a similar detector (though its similarity is not a requirement) placed in theedge of the field. This suppresses any dose rate variations that may occur, providing a substantialincrease in scan speed. The increase in scan speed is subsequently reduced by the necessity for the user tomanually readjust the reference chamber so that is minimally perturbs the primary beam. The methodpresented herein maintains the accuracy of a “no-reference detector” system while providing the speed ofa reference detector system, while providing the user with two additional advancements. First, since thereference detector is a transmission detector, there is no need for the user to continually readjust thelocation of the reference detector; reducing scan time. Second, since the Stealth detector is a transmissiondetector with a reproducible setup, and reproducible results, the user’s experience should mimic the datapresented herein, which show a close comparison with data considered as the gold standard.1I. J. Das, C. W. Cheng, R. J. Watts, A. Ahnesjo, J. Gibbons, X. A. Li, J. Lowenstein, R.K. Mitra, W. E. Simon, and T. C. Zhu, “Accelerator beam data commissioning equipmentand procedures: Report of the TG–106 of the Therapy Physics Committee of the AAPM,”Med. Phys. 35, 4186–4215 (2008).2A. Chalkley and G. Heyes. “Evaluation of a Single-Crystal Diamond Detector forRelative Dosimetry Measurements on a CyberKnife,” Br. Jour. Radiol. 87, 20130768(2014).3J. U. Wuerfel. “Dose Measurement in Small Fields,” Med. Phys. Intl. Jour. 1, 81-90(2013).4I. Ciancaglioni, Marco Marinelli, E. Milani, G. Prestopino, C. Verona, G. VeronaRinati, R. Consorti, A. Petrucci, and F. De Notaristefani, “Dosimetric characterization ofa synthetic single crystal diamond detector in clinical radiation therapy small photonbeams,” Med. Phys. 39, 4493–4502 (2012).5A. J. D. Scott, A. E. Nahum, and J. D. Fenwick, “Using a Monte Carlo model to predictdosimetric properties of small radiotherapy photon fields,” Med. Phys. 35, 4671-4684(2008).IBA Dosimetry Whitepaper ‐ August 2014
For the smallest field sizes studied in this project, raw PDD point measurements are acquired using step-by-step acquisition modes (0.5 cm steps) with all results presented in arbitrary units. No smoothing or normalization is performed. At dmax, this plot shows the extent by which the primary beam is attenuated. Right.