Transcription
Sabbatinelli et al. Cardiovascular 5-3(2022) 21:95Cardiovascular DiabetologyOpen AccessRESEARCHCirculating levels of AGEs and solubleRAGE isoforms are associated with all‑causemortality and development of cardiovascularcomplications in type 2 diabetes: a retrospectivecohort studyJacopo Sabbatinelli1,2, Stefania Castiglione3, Federica Macrì3, Angelica Giuliani1*, Deborah Ramini4,Maria Cristina Vinci5, Elena Tortato6, Anna Rita Bonfigli7, Fabiola Olivieri1,4 and Angela Raucci3AbstractBackground: Advanced glycation end-products (AGEs) and their interaction with the receptor for advanced glycation end-products (RAGE) play a pivotal role in the development and progression of type 2 diabetes. In this retrospective cohort study, we explored the association of circulating levels of soluble RAGE (sRAGE) isoforms, i.e., endogenoussecretory esRAGE and cleaved cRAGE, AGEs and their respective ratios with 15-year all-cause mortality in type 2diabetes.Methods: Baseline AGEs and sRAGE isoforms concentration were measured by ELISA in 362 patients with type 2diabetes and in 125 age- and gender-matched healthy control subjects (CTR). Independent predictors of mortalitywere determined using Cox proportional-hazards models and used to build and validate a nomogram for all-causemortality prediction in type 2 diabetes.Results: AGEs, total sRAGE, cRAGE and the AGEs/sRAGE and AGEs/esRAGE ratios were significantly increased inpatients with type 2 diabetes compared to CTR (p 0.001). In CTR subjects, but not in type 2 diabetes patients, a significant negative correlation between cRAGE and age was confirmed (p 0.003), whereas the AGEs/sRAGE (p 0.032)and AGEs/cRAGE (p 0.006) ratios were positively associated with age. At an average follow-up of 15 years (4,982person-years), 130 deaths were observed. The increase in the AGEs/cRAGE ratio was accompanied by a higher risk ofall-cause mortality in patients with type 2 diabetes (HR per each SD increment 1.30, 95% CI 1.15–1.47; p 0.001).Moreover, sRAGE was associated with the development of major adverse cardiovascular events (MACE) in type 2diabetes patients without previous MACE (OR for each SD increase: 1.48, 95% CI 1.11–1.89). A nomogram based onage, sex, HbA1c, systolic blood pressure, and the AGEs/cRAGE ratio was built to predict 5-, 10- and 15-year survival in†Jacopo Sabbatinelli, Stefania Castiglione, Anna Rita Bonfigli, Fabiola Olivieriand Angela Raucci contributed equally to this study*Correspondence: angelica.giuliani@staff.univpm.it1Department of Clinical and Molecular Sciences, Università Politecnica delleMarche, Via Tronto 10/A, 60126 Ancona, ItalyFull list of author information is available at the end of the article The Author(s) 2022. Open Access This article is licensed under a Creative Commons Attribution 4.0 International License, whichpermits use, sharing, adaptation, distribution and reproduction in any medium or format, as long as you give appropriate credit to theoriginal author(s) and the source, provide a link to the Creative Commons licence, and indicate if changes were made. The images orother third party material in this article are included in the article’s Creative Commons licence, unless indicated otherwise in a credit lineto the material. If material is not included in the article’s Creative Commons licence and your intended use is not permitted by statutoryregulation or exceeds the permitted use, you will need to obtain permission directly from the copyright holder. To view a copy of thislicence, visit http:// creat iveco mmons. org/ licen ses/ by/4. 0/. The Creative Commons Public Domain Dedication waiver (http:// creat iveco mmons. org/ publi cdoma in/ zero/1. 0/) applies to the data made available in this article, unless otherwise stated in a credit line to the data.
Sabbatinelli et al. Cardiovascular Diabetology(2022) 21:95Page 2 of 15type 2 diabetes. Patients were categorized into quartiles of the monogram scores and Kaplan-Meier survival curvesconfirmed the prognostic accuracy of the model (log-rank p 6.5 10 13).Conclusions: The ratio between AGEs and the cRAGE isoform is predictive of 15-year survival in patients with type2 diabetes. Our data support the assessment of circulating AGEs and soluble RAGE isoforms in patients with type 2diabetes as predictors of MACE and all-cause mortality.Keywords: Advanced glycation end-products, Biomarker, Major adverse cardiovascular events, Mortality, sRAGE, Type2 diabetesBackgroundAdvanced glycation end products (AGEs) and the receptor for advanced glycation end products (RAGE) activatecell signaling pathways modulating inflammatory geneexpression profile in several chronic inflammatory disorders [1–3]. AGEs are the products of non-enzymaticglycation and oxidation of proteins and lipids and underphysiological conditions, anti-glycation defenses are sufficient to prevent their accumulation [2]. A significantlyincreased burden of AGEs was described in aging andage-related diseases (ARDs), primarily in diabetes mellitus [2, 4], and their levels, measured using skin autofluorescence, were associated with a significant increasein the incidence of major adverse cardiovascular events(MACE) in a multitude of chronic conditions, including heart failure [5], type 2 diabetes [6], and end-stagerenal disease [7]. The contribution of AGEs in fosteringendothelial dysfunction and exacerbating atherosclerosis has been confirmed by their robust association withnon-invasive measures of arterial stiffness, which ismore pronounced in men and younger individuals [8].The membrane-bound RAGE (FL-RAGE) is a patternrecognition receptor that recognizes AGEs and severalother ligands, some of which act as damage-associatedmolecular patterns (DAMPS) and pathogen-associatedmolecular patterns (PAMPs) [9–11]. Under physiological conditions, RAGE is expressed in the lungs while isalmost undetectable in other tissues [12, 13]; however,its levels are induced by ligand accumulation [14–16].The cytoplasmic domain of RAGE binds to the forminDIAPH1 that is essential for RAGE/ligand-mediated activation and production of reactive oxygen species (ROS)eventually promoting inflammatory processes in ARDs[17, 18].The soluble forms of RAGE, collectively named(sRAGE), are also present in the blood and consist ofthe RAGE ectodomain, produced by proteolytic cleavage (cRAGE) of the membrane-bound form by metalloproteases or through alternative splicing as endogenoussecretory RAGE (esRAGE), which is actively secreted[19]. sRAGE does not transduce signal upon ligand binding, acting as a decoy molecule to restrain the RAGE/ligand induced cell activation [20]. Accordingly, sRAGEadministration reduces diabetes and atherosclerosis tissue remodeling, age-associated cardiac fibrosis andneointima expansion after vessel injury [13, 21–23].In humans, altered circulating sRAGE and esRAGE levels have been related to disease states or their risk factors.Many studies reported lower sRAGE or esRAGE levels insubjects with cardiometabolic conditions like metabolicsyndrome [24], hypertension [24, 25], obesity [26]andprediabetes [27–29]. sRAGE also decreases with aging inhealthy subjects [30–32]. In contrast, sRAGE elevationhas been associated with chronic diabetes [33, 34], frailty[35] and people with diminished kidney function [36].The potential prognostic value of sRAGE as a markerof disease and the occurrence of adverse events seems tobe suitable for individuals with chronic disease or multimorbidity and not for the general population [37–40].Concerning diabetes, increased concentrations of sRAGEwere associated with increased all-cause and cardiovascular (CV) mortality in type 1 diabetes [41, 42]. Inpatients with type 2 diabetes, higher levels of sRAGEwere independently associated with new or worseningkidney disease and mortality over 5 years follow-up [43].Prospective studies underlined significant positive association between sRAGE and esRAGE and the incident ofcoronary artery disease (CHD) in type 2 diabetes [38, 44].Recently, the ratio of AGEs/sRAGE has been proposedas a more effective biomarker of organ damage thanAGEs or sRAGE variants separately [31, 45, 46]. Moreover, a different predictive ability of esRAGE and cRAGEas markers of CV risk factors have been evidenced lately[29, 31, 32]. For instance, we have published that in ahealthy population and long living individuals (LLIs),cRAGE negatively relates with aging while esRAGE is amore appropriate biomarker of obesity and longevity [31,32]. Hence, new aspects should be taken in considerationin order to define the prognostic value of AGEs/sRAGEisoforms axis in human pathologies.Herein, we simultaneously determined circulatinglevels of both sRAGE isoforms—esRAGE and cRAGE—AGEs and their respective ratios in patients with type 2diabetes and in age- and gender-matched healthy controlsubjects and investigated their association with 15-yearall-cause mortality in type 2 diabetes.
Sabbatinelli et al. Cardiovascular Diabetology(2022) 21:95MethodsSamples362 patients with type 2 diabetes and 125 age-and-gendermatched healthy control subjects (CTRs) were randomlyselected from a cohort of 562 patients with type 2 diabetes and 599 CTRs enrolled from central Italy [47]. Thestudy was approved by the Institutional Review Board ofIRCCS INRCA hospital (approval no. 34/CdB/03). Information such as vital signs, anthropometric measures,medical history, behavioral data including diet and physical activity were available for study participants. Written informed consent was obtained from each subject inaccordance with principles of the Declaration of Helsinki.Type 2 diabetes was diagnosed according to the American Diabetes Association (ADA) criteria, i.e., patientshaving a glycated Hemoglobin A1c (HbA1C) 6.5% orfasting blood glucose 126 mg/dl or 2-hour blood glucose levels 200 mg/dl after the oral glucose tolerancetest (OGTT), or a random blood glucose 200 mg/dlwhen severe diabetes symptoms are present [48]. Inclusion criteria for patients with diabetes were body massindex (BMI) 40 kg/m2, age 40–87 years, ability, andwillingness to give written informed consent. The presence/absence of diabetic complications was establishedas follows: diabetic retinopathy by fundoscopy throughdilated pupils and/or fluorescence angiography; incipient nephropathy, defined as a urinary albumin excretion rate 30 mg/24 h and a normal creatinine clearance;neuropathy established by electromyography; ischemicheart disease defined by clinical history, and/or ischemicelectrocardiographic alterations; peripheral vascular disease, including atherosclerosis obliterans and cerebrovascular disease based on history, physical examinationsand Doppler velocimetry. Among the 362 patients, 73were affected by neuropathy, 27 by peripheral artery disease, 52 by diabetic kidney disease and 95 by retinopathy.Fifty-three patients had a history of major adverse cardiovascular events (MACE).Fasting blood samples of all subjects were processed toobtain plasma and stored at 80 C.Measurement of RAGE isoforms and AGEsCirculating levels of sRAGE isoforms were determinedby commercial ELISA kits following manufacturer’s indications. Specifically, total human sRAGE included thedetection of both cRAGE and esRAGE variants (DY1145,Human RAGE DuoSet ELISA, R&D Systems Inc.,MN, USA) and esRAGE concentration was evaluatedby an ELISA assay with an antibody raised against theexclusive C-terminal amino acids (332–347) sequence(K1009-1, B-bridge International, CA, USA). cRAGEwas determined by subtracting esRAGE from sRAGE asalready described [29, 31, 32].Page 3 of 15AGEs were measured by an ELISA assay from Biolabs(STA-817 Cell Biolabs, INC. San Diego, CA) followingmanufacturer’s instructions. AGEs levels (µg/ml) weredivided by sRAGE isoform levels (pg/ml) to obtain theratio (µg/pg).Statistical analysisContinuous variables were reported as either mean andstandard deviation or median and interquartile range(IQR) based on their distribution (assessed using Shapiro-Wilk test). For comparisons between groups, MannWhitney U test and Kruskal-Wallis followed by Dunnpost hoc test were used. Spearman correlation was usedto assess correlations between continuous variables,which were visualized by correlation plots generatedby the Jamovi software, version 2.2.1. Quantile regression was used to evaluate the impact of type 2 diabetescomplications and treatments on the levels of AGEs andsRAGE isoforms. The association between AGEs andsRAGE isoforms and the follow-up endpoints was investigated by Cox proportional hazards analysis (adjustedfor established risk factors and potential confounders)with 95% confidence intervals. Based on the results ofthe multivariate Cox regression analysis, a nomogram forpredicting 5-, 10- and 15-year survival in type 2 diabeteswas built using the “hdnom” package (version 6.0.0) forR, version 4.1 [49]. Specifically, a penalized Cox regression model trained with an adaptive elastic net procedure using 10-fold cross-validation on the whole sample.The adaptive elastic net is an adaptation of the originalCox regression for survival analysis which can handle correlated features and performs variable selection.Nomogram performance was assessed on 100 bootstrapsamples. The predictive efficacy was assessed with calibration and discrimination statistics. Reclassification wasassessed by use of the continuous net reclassificationimprovement (NRI 0) [50].ResultsBaseline demographical and biochemical characteristics of 362 patients affected by type 2 diabetes mellitus(median age 63.0 yrs., IQR 56.0–73.5 yrs) and 125 ageand gender-matched healthy control subjects (CTR;median age 67.0 yrs., IQR 60.0–72.0 yrs.) are reportedin Table 1. Median type 2 diabetes duration was 12.5yrs. (IQR 6.0–24.0 yrs.). No missing data were identified.The prevalence of diabetic complications was as follows:retinopathy, 26%; nephropathy, 15%; neuropathy, 20%;peripheral artery disease, 8%; MACE, 15%. Patients withtype 2 diabetes showed significantly increased weight,BMI, waist-hip ratio (WHR), systolic (SBP) and diastolic (DBP) blood pressure, triglycerides, fasting glucoseand insulin, HbA1C, HOMA index, creatinine, alanine
Sabbatinelli et al. Cardiovascular Diabetology(2022) 21:95Page 4 of 15Table 1 Baseline demographical and biochemical characteristics of healthy control subjects (CTR) and patients with type 2 diabetesVariablesCTR (n 125)Type 2 diabetes (n 362)Age (years)63.0 (56.0–73.5)67.0 (60.0–72.0)0.114Gender (Males, %)59 (47%)200 (55%)0.145BMI (Kg/m2)26.6 (24.0–29.2)28.3 (25.9–31.4) 0.001Weight (Kg)73 (65–80)Waist-hip ratio0.90 (0.84–0.96)0.94 (0.89–0.98) 0.001Systolic blood pressure (mmHg)133 (125–139)136 (129–143) 0.001Diastolic blood pressure (mmHg)85 (80–93)Total cholesterol (mg/dL)217.5 (186.3–238.0)HDL-C (mg/dL)56.5 (47.3–67.8)LDL-C (mg/dL)128.2 (109.0–145.9)116.6 (95.6–138.9)Triglycerides (mg/dL)92.5 (62.3–131.0)115.0 (83.8–163.3) 0.001ApoA1 (mg/dL)176.0 (155.0–203.8)164.5 (149.0–187.0)0.001ApoB (mg/dL)101.5 (83.5–121.0)101.0 (85.0–122.0)0.822Glucose (mg/dL)94.0 (89.0–100.0)152.0 (133.8–186.0) 0.001HbA1C (%)5.7 (5.5–6.1)Insulin (UI/mL)4.70 (3.44–6.96)5.80 (3.69–8.83)HOMA index1.12 (0.77–1.61)2.17 (1.42–3.61) 0.001Creatinine (mg/dL)0.85 (0.70–1.00)0.90 (0.70–1.00)0.043eGFR (mL/min)82.5 (68.3–89.5)81.3 (66.1–87.5)0.094Azotemia (mg/dL)38.0 (33.0–44.0)38.0 (32.0–46.3)0.706Uric acid (mg/dL)4.8 (4.1–5.5)4.6 (4.0–5.4)0.241Alanine aminotransferase (U/L)36 (32–42)39 (33–48)0.002Aspartate aminotransferase (U/L)21 (17–25)20 (16–25)0.104Gamma-glutamiltransferase (U/L)45 (35–56)51 (41–62) 0.001Total bilirubin (mg/dL)0.7 (0.6–0.9)0.6 (0.5–0.8)0.0290.00378 (70–87)90 (85–96)209 (181.8–235.0)50.0 (43.0–60.0)7.3 (6.5–8.1)P 0.001 0.0010.124 0.0010.004 0.0010.003WBC (n/mm3)6.17 (5.09–7.29)6.56 (5.60–7.62)Hemoglobin (g/dL)14.1 (13.4–15.0)14.5 (13.6–15.4)0.033Platelets (n/mm3)229 (195–273)210 (176–251)0.008hs-CRP (mg/L)1.98 (0.87–5.04)2.73 (1.08–4.78)0.017PAI-1 (ng/mL)17.8 (11.9–24.7)18.5 (13.1–25.3)0.674Fibrinogen (mg/dL)296 (249–369)303 (257–344)0.221Iron (µg/dL)79 (63–100)81 (66–97)0.375Ferritin (ng/mL)97.8 (49.0–187.3)71.5 (39.6–150.7)0.445Disease duration (years)–12.5 (6.0–24.0)–Any T2DM medication–264 (73%)–Metformin–133 (37%)–Sulphonylureas–173 (48%)–Glinides–7 (2%)–Insulin–60 (17%)–Vitamin K antagonists–39 (11%)–Statins4 (3%)60 (17%) 0.001Relevant medications (n, %)Type 2 diabetes complications (n, %)Any complication–194 (53%)Retinopathy–95 (26%)–Diabetic kidney disease–52 (15%)–Neuropathy–73 (20%)–Peripheral artery disease–27 (8%)–MACE–53 (15%)–Data are median (IQR) for continuous variables and n (%) for categorical variables. P value from Mann-Whitney test for continuous variables and from chi-squared testsof association for categorical variables. Significant differences are in bold
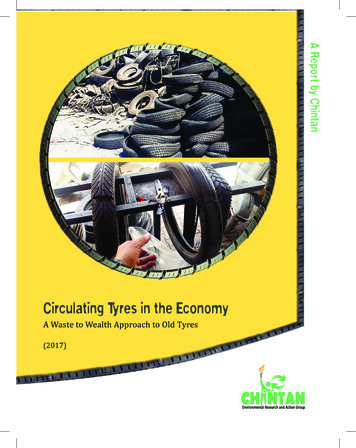
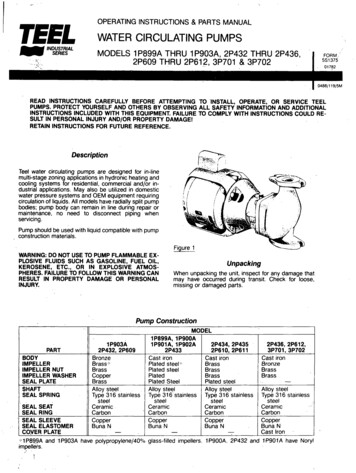
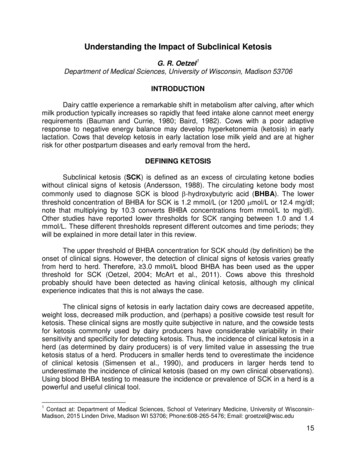
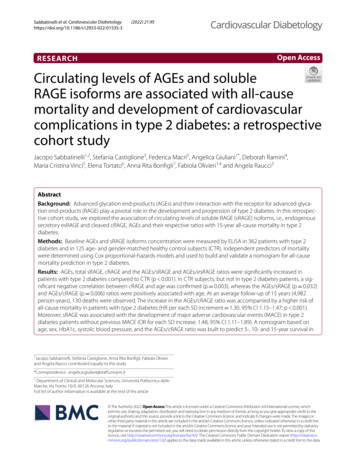
Sabbatinelli et al. Cardiovascular Diabetology(2022) 21:95Page 5 of 15Table 2 Comparison of AGEs, sRAGE isoforms, and theirratios between healthy controls (CTR) and patients with type 2diabetesCTR (n 125)Type 2 diabetes(n 362)P-value 0.001sRAGE (pg/mL)430.6 (275.0–595.9) 667.7 (464.8–929.9)esRAGE (pg/mL)242.9 (153.9–362.3) 283.5 (138.0–432.9)cRAGE (pg/mL)149.0 (44.7–267.8)324.1 (173.7–521.0) 0.0014.41 (2.45–6.23)11.15 (4.43–21.40) 0.001AGEs (µg/ml)0.312AGEs/sRAGE0.009 (0.005–0.018) 0.017 (0.006–0.035) 0.001AGEs/esRAGE0.016 (0.010–0.026) 0.055 (0.024–0.099) 0.001AGEs/cRAGE0.030 (0.011–0.103) 0.036 (0.011–0.095)0.914Data are median (IQR)P-values for Mann–Whitney U test. Significant differences are in boldaminotransferase, gamma-glutamyl transferase, whiteblood cells, hemoglobin, and high-sensitivity C-reactive protein (hs-CRP). On the contrary, total bilirubinand platelets were significant lower in type 2 diabetescompared to CTR. Moreover, serum levels of total cholesterol, HDL cholesterol (HDL-C), LDL cholesterol(LDL-C) and apolipoprotein A1 (ApoA1) were lower inpatients, due to the higher prevalence of statin therapycompared to CTR.Baseline assessment of AGEs and sRAGE isoformsThe comparisons of AGEs and the different isoforms ofsRAGE between type 2 diabetes and CTR groups werereported in Table 2. AGEs as well as sRAGE levels weresignificantly increased in type 2 diabetes compared toCTR. The increase of sRAGE in type 2 diabetes mainlydepends on cRAGE changes rather than esRAGE. Furthermore, the AGEs/sRAGE and AGEs/esRAGE ratioswere increased in patients with type 2 diabetes whileAGEs/cRAGE remained unchanged between the twogroups. No significant gender-related differences wereobserved in both groups (data not shown).Figure 1 shows the results of the AGEs-sRAGE comparisons between CTR and patients with type 2 diabetes,grouped according to the absence (T2DM-NC) or presence (T2DM-C) of diabetic complications. While thedifferences between patients and CTR in AGEs, sRAGE,cRAGE, and the AGEs/sRAGE and AGEs/esRAGE ratioswere confirmed, post-hoc analysis revealed no significant difference according to the presence of diabeticcomplications.We previously showed that circulating levels ofcRAGE, and not esRAGE, decline with aging in healthysubjects and LLIs [31, 32]. Table 3 shows the Spearman correlations of AGEs, the different isoforms ofsRAGE and their ratios with age in CTR and type 2diabetes groups. In CTR subjects, a significant negative correlation between cRAGE and age was confirmed [32] (Fig. 2A), whereas the AGEs/sRAGE andAGEs/cRAGE ratios were positively associated withage (Fig. 2B, C), however, cRAGE and AGEs/cRAGEevidenced higher correlation coefficients, in terms ofabsolute values, than AGEs/sRAGE Fig. 2). No significant correlations were observed in the type 2 diabetespatient’s group. Table 3). Overall, these data indicatethat cRAGE and AGEs/cRAGE ratio represent valuablebiomarkers of chronological age in healthy subjects.Then, we explored the correlations between AGEsand sRAGE isoforms and the available biochemicalvariables. The correlation plots in Fig. 3 summarizethe Spearman’s correlation coefficients for each pairof variables in the entire cohort and in CTR and type2 diabetes subjects separately. Circulating levels ofAGEs were positively associated to variables related toblood glucose control and insulin resistance, i.e., BMI,WHR, glucose, HbA1c and HOMA-index, in the entirecohort and in CTR subjects, but not in type 2 diabetes.Moreover, AGEs and sRAGE isoforms were variablyassociated with the levels of hs-CRP, plasminogen activator inhibitor-1 (PAI-1) and the endogenous endothelial nitric oxide synthase (eNOS) inhibitor ADMA andSDMA. Notably, in diabetes patients, esRAGE levelswere negatively associated with the disease duration.The complete correlation matrix is available as Additional file 1: Table S1.The levels of AGEs and sRAGE variants were analyzedaccording to the presence of the micro- and macrovascular complications of diabetes, i.e., neuropathy, nephropathy, retinopathy, peripheral vascular disease, and MACE(Table 4). Results of the quantile regression model,adjusted for age and HbA1c, revealed that nephropathy was associated with decreased sRAGE levels andincreased AGEs/sRAGE and AGEs/esRAGE ratios.Retinopathy was associated with increased cRAGE andreduced AGEs levels, AGEs/sRAGE and AGEs/cRAGEratios. The presence of atherosclerotic vascular diseasewas associated with increased cRAGE levels, while subjects with history of MACE showed a reduced AGEs/esRAGE ratio. Moreover, patients under insulin therapy were characterized by significantly reduced AGEs/sRAGE, AGEs/cRAGE and AGEs levels, after adjustmentfor age and HbA1c (Table 5).Prognostic value of sRAGE isoforms in the follow‑upof type 2 diabetesAfter 15 years of follow-up (4,982 person-years), 130out of 352 patients with type 2 diabetes were deceased(36.9%). The observed crude mortality was 26.1 per 1000
.001D-CMCT2 TRDM-NT2 R0.0120AGE/cRAGE0.1C1D0.1T210T2MT2DCTRCT2 TRDM-NT2 EscRAGE16001000T2sRAGEBPage 6 of 15MA(2022) 21:95T2Sabbatinelli et al. Cardiovascular DiabetologyFig. 1 Boxplots for the comparison of A total sRAGE, esRAGE, and cRAGE isoforms and ) AGEs/sRAGE, AGEs/esRAGE, AGEs/cRAGE, cRAGE/esRAGE ratio among healthy control subjects (CTR) and type 2 diabetes patients without (T2DM-NC) or with (T2DM-C) complications. **p 0.01;***p 0.001; ****p 0.0001 for Dunn’s post-hoc tests following Kruskal-Wallis H testperson-years. Mean survival was longer in patients without complications compared to patients with at leastone complication (181.0 [173.9–188.1] vs. 160.8 [152.8–168.9] months, p 0.001).Cox regression models were applied to identify association between AGEs and sRAGE isoform levels andall-cause mortality in type 2 diabetes. Table 6 showsthe univariate HRs for the established all-cause mortality risk predictors—age, sex, BMI, disease duration, SBP,HbA1c, blood lipids, eGFR, hs-CRP, and ongoing treatments—and for AGEs, sRAGE isoforms, and their ratios.Cox regression univariate and multivariate analyses,adjusted for the abovementioned confounders, revealedan increased mortality risk for patients with increasedAGEs/cRAGE ratio (Table 6). The combined model,which includes the established risk factors and the ratiosbetween AGEs and sRAGE isoforms as predictors, confirmed that each SD increase in the AGEs/cRAGE ratio isaccompanied by a higher risk of mortality in type 2 diabetes (HR: 1.30, 95% CI 1.15–1.47; Table 6).Based on the results of the Cox regression models, anadaptive elastic net regression model and multivariateCox regression analysis was computed to predict survivalat 5, 10 and 15 years in type 2 diabetes based on the following variables: age, disease duration, sex, HbA1c, SBP,hs-CRP, and the AGEs/cRAGE ratio. Disease durationand hs-CRP were excluded from the model by the elastic-net regression process. Figure 4A presents the modelin the form of a nomogram that provides the long-termsurvival probabilities corresponding to a particular totalscore. The total score for a patient is obtained by adding up the scores for each of the six predictors. Internalvalidation with bootstrap resampling performed on thewhole sample showed that the AUCs for the all-causemortality prediction nomogram were 0.688, 0.779 and0.764 at 5, 10 and 15 years respectively (Fig. 4B). Theinternal calibration plot revealed a good agreementbetween the observed and predicted values (calibration slope 1.32, y-intercept 0,22 [95% CI 0.76 to0.33]; Fig. 4C). Based on the risk profile predicted by
Sabbatinelli et al. Cardiovascular Diabetology(2022) 21:95Page 7 of 15Table 3 Spearman correlations of AGEs and the differentisoforms of sRAGE isoforms with age in healthy controls (CTR)and patients with type 2 diabetessRAGECorrelation coefficientP-valueesRAGECTR (n 156)Type 2diabetes(n 362) 0.161 0.0520.042 0.0510.073Correlation coefficientP-valuecRAGE0.646Correlation coefficientAGEs/sRAGEAGEs/esRAGEAGEs/cRAGE**0.330 0.261** 0.0200.003P-valueAGEs0.3230.711Correlation coefficient0.0690.028P-value0.4460.600Correlation coefficient0.195*0.025P-value0.0320.631Correlation coefficient0.0350.081P-value0.7010.123Correlation coefficient0.246**0.014P-value0.0060.796p 0.01 for Spearman’s regression. Significant correlations are in boldthe nomogram, 4 homogeneous groups of patients weregenerated, and Kaplan-Meier survival curves were constructed (Fig. 4D). The log-rank test confirmed that thesurvival curves of patients grouped according to thenomogram-based mortality risk score were significantlydifferent (p 6.5 10 13).AGEs and the sRAGE isoforms were also evaluatedas predictors of the development of diabetic complications. While none of the parameters was significantlyassociated with development of any complication inpatients without complications at the time of enrolment,sRAGE was associated with the development of MACEover a 15-year follow-up in patients with type 2 diabetes who had no history of MACE at recruitment (OR foreach SD-increase: 1.48, 95% CI 1.11–1.98; Additionalfile 1: Table S2).ABT2DMr -0.020CTRr -0.261Finally, we tested whether the AGEs/cRAGE ratioadded significantly to the 10-year all-cause mortalityrisk predicted by the RECODe equation [51]. The termrelated to urinary albumin-to-creatinine ratio (UACR),which was not assessed at the time of recruitment, hasbeen omitted from the equation, as recommended by theoriginal publication. The 10-year probability of all-causemortality in our cohort ranged from 1.9 to 76.9%, witha median of 13.6%. The category-free, continuous N RI 0of the predictive model obtained by adding the AGEs/cRAGE ratio to the 10-year all-cause mortality probability predicted by the RECODe equation was 0.090 (95%CI, 0.020–0.351) at 10 years of follow-up.DiscussionThis study compared levels of soluble RAGE isoforms,AGEs, and their respective ratios in type 2 diabetes patients, with an average disease duration of 12.5years, and age- and sex-matched healthy individuals,and explored their ability to predict all-cause mortality and development of MACE in patients with type 2diabetes. Our results showed that circulating AGEs andsRAGE levels are increased in type 2 diabetes and thatthe increase of sRAGE is due to cRAGE increment sinceesRAGE did not change. Accordingly, the AGEs/sRAGEand AGEs/esRAGE ratios were also increased in type 2diabetes. Moreover, we demonstrated that the AGEs/cRAGE ratio was able to predict all-cause mortality andthat sRAGE was associated with the development ofMACE in patients with type 2 diabetes. Finally, we builtand internally validated a nomogram for the predictionof long-term survival probability in type 2 diabetes basedon age, sex, HbA1c, SBP, and the AGE/cRAGE ratio.Although several studies reported a significant increasein AGE levels in patients with type 2 diabetes [43, 52, 53],more conflicting evidence are available on sRAGE. Mostcross-sectional studies focused on total sRAGE levels,with findings variable on type of diabetes, disease duration and presence of complications [54–57]. A smallerCT2DMr 0.025CTRr 0.1952.00.151400T2DMr 0.014CTRr 0.246800600400AGEs/cRAGE1000AGEs/sRAGEcRAGE (pg/ml)12000.100.051.51.00.520003040506070Age (years)80901000.003040506070Age (years)80901000.030405060708090Age (years)Fig. 2 Scatter plot showing the correlation between subjects’ age and circulating A cRAGE, B AGEs/sRAGE and C AGEs/cRAGE ratios. Regressionlines for CTR (green) and type 2 diabetes (T2DM, red) individuals are displayed100
Sabbatinelli et al. Cardiovascular Diabetology(2022) 21:95Overall(n 542)Page 8 of 15CTR(n 125)T2DM(n 362)ADMASDMAL-arginineTelomere lengthTotal nMonocyte #Monocyte %HematocritHemoglobinALTASTUric acideGFRHOMA-indexFasting insulinHbA1cGlucoseWaist/hip ratioBMIWeigthAgeDisease 0.5AsR GEes AG sAG cRA EAG E RAGEE /s GAG /esRA EE/ RAGEcR GAG EEAGs EesRAG sR EAAAGGE cRAGEE /s GAG /esRA EE/ RAGEcR GAG EEAGs EesRAG sR EAAAGGE cRAGE/sGEAG /esRA ERE/ AGEcR GAG EE-1.0Fig. 3 Correlation plots showing the correlations among the different variables and AGEs, sRAGE isoforms and the derived ratios in the wholepopulation and in CTR and type 2 diabetes (T2DM) subjects separately. The intensity of the color depends on the magnitude of the Spearman’scorrelation. Non-significant correlations (p 0.05) are crossednumber of studies assessed more in-depth the sRAGEisoforms, with no conclusive results [29, 53]. A recentmeta-analysis showed that circulating esRAGE was lowerand inversely correlated with carotid intima-media thickness (IMT) in type 2 diabetes whereas a contrasting relationship was described between sRA
glycation end products as predictive biomarkers of coronary heart disease risk in patients with type 2 diabetes: an analysis from the CARDS trial. Diabetes. 2011;60(9):2379-85. 39. Erusalimsky JD. The use of the soluble receptor for advanced glycation-end products (sRAGE) as a potential biomarker of disease risk and adverse outcomes.