Transcription
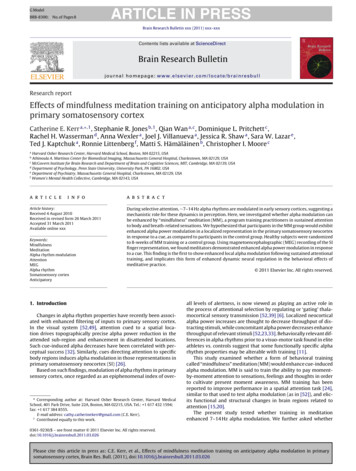
G ModelBRB-8300;No. of Pages 8ARTICLE IN PRESSBrain Research Bulletin xxx (2011) xxx–xxxContents lists available at ScienceDirectBrain Research Bulletinjournal homepage: www.elsevier.com/locate/brainresbullResearch reportEffects of mindfulness meditation training on anticipatory alpha modulation inprimary somatosensory cortexCatherine E. Kerr a, ,1 , Stephanie R. Jones b,1 , Qian Wan a,c , Dominique L. Pritchett c ,Rachel H. Wasserman d , Anna Wexler a , Joel J. Villanueva a , Jessica R. Shaw a , Sara W. Lazar e ,Ted J. Kaptchuk a , Ronnie Littenberg f , Matti S. Hämäläinen b , Christopher I. Moore caHarvard Osher Research Center, Harvard Medical School, Boston, MA 02215, USAAthinoula A. Martinos Center for Biomedical Imaging, Massachusetts General Hospital, Charlestown, MA 02129, USAcMcGovern Institute for Brain Research and Department of Brain and Cognitive Sciences, MIT, Cambridge, MA 02139, USAdDepartment of Psychology, Penn State University, University Park, PA 16802, USAeDepartment of Psychiatry, Massachusetts General Hospital, Charlestown, MA 02129, USAfWomen’s Mental Health Collective, Cambridge, MA 02143, USAba r t i c l ei n f oArticle history:Received 4 August 2010Received in revised form 26 March 2011Accepted 31 March 2011Available online xxxKeywords:MindfulnessMeditationAlpha rhythm modulationAttentionMEGAlpha rhythmSomatosensory cortexAnticipatorya b s t r a c tDuring selective attention, 7–14 Hz alpha rhythms are modulated in early sensory cortices, suggesting amechanistic role for these dynamics in perception. Here, we investigated whether alpha modulation canbe enhanced by “mindfulness” meditation (MM), a program training practitioners in sustained attentionto body and breath-related sensations. We hypothesized that participants in the MM group would exhibitenhanced alpha power modulation in a localized representation in the primary somatosensory neocortexin response to a cue, as compared to participants in the control group. Healthy subjects were randomizedto 8-weeks of MM training or a control group. Using magnetoencephalographic (MEG) recording of the SIfinger representation, we found meditators demonstrated enhanced alpha power modulation in responseto a cue. This finding is the first to show enhanced local alpha modulation following sustained attentionaltraining, and implicates this form of enhanced dynamic neural regulation in the behavioral effects ofmeditative practice. 2011 Elsevier Inc. All rights reserved.1. IntroductionChanges in alpha rhythm properties have recently been associated with enhanced filtering of inputs to primary sensory cortex.In the visual system [52,49], attention cued to a spatial location drives topographically precise alpha power reduction in theattended sub-region and enhancement in disattended locations.Such cue-induced alpha decreases have been correlated with perceptual success [32]. Similarly, cues directing attention to specificbody regions induces alpha modulation in those representations inprimary somatosensory neocortex (SI) [26].Based on such findings, modulation of alpha rhythms in primarysensory cortex, once regarded as an epiphenomenal index of over- Corresponding author at: Harvard Osher Research Center, Harvard MedicalSchool, 401 Park Drive, Suite 22A, Boston, MA 02215, USA. Tel.: 1 617 432 1594;fax: 1 617 384 8555.E-mail address: cathy.catherinekerr@gmail.com (C.E. Kerr).1Contributed equally to this work.all levels of alertness, is now viewed as playing an active role inthe process of attentional selection by regulating or ‘gating’ thalamocortical sensory transmission [52,39] [6]. Localized neocorticalalpha power increases are thought to decrease throughput of distracting stimuli, while concomitant alpha power decreases enhancethroughput of relevant stimuli [52,23,33]. Behaviorally relevant differences in alpha rhythms prior to a visuo-motor task found in eliteathletes vs. controls suggest that some functionally specific alpharhythm properties may be alterable with training [11].This study examined whether a form of behavioral trainingcalled “mindfulness” meditation (MM) would enhance cue-inducedalpha modulation. MM is said to train the ability to pay momentby-moment attention to sensations, feelings and thoughts in orderto cultivate present moment awareness. MM training has beenreported to improve performance in a spatial attention task [24],similar to that used to test alpha modulation (as in [52]), and elicits functional and structural changes in brain regions related toattention [15,20].The present study tested whether training in meditationenhanced 7–14 Hz alpha modulation. We further asked whether0361-9230/ – see front matter 2011 Elsevier Inc. All rights ase cite this article in press as: C.E. Kerr, et al., Effects of mindfulness meditation training on anticipatory alpha modulation in primarysomatosensory cortex, Brain Res. Bull. (2011), doi:10.1016/j.brainresbull.2011.03.026
G ModelBRB-8300;No. of Pages 82ARTICLE IN PRESSC.E. Kerr et al. / Brain Research Bulletin xxx (2011) xxx–xxxmeditators demonstrated enhanced modulation in specificsub-bands of alpha previously linked to specific functions (a lowerband [7–8 Hz] associated with arousal; a middle band [9–10 Hz]associated with attention; and an upper band [11–14 Hz] associated with task specific performance in memory tasks) [37,38,35].Because calculating each individual’s peak alpha frequency mayhelp control for variability in alpha seen across different age andpatient groups [36,42], we also evaluated alpha modulation byconsidering alpha power related to each individual participant’sindividualized peak alpha frequency.We investigated a standardized and relatively well-studiedform of MM [15,14,9] called mindfulness-based-stress-reduction(MBSR). This training has significant effects on distress in chronicpain [41,43] and on quality-of-life in a broad range of illnesses [7].MBSR is thought to train participants to disengage from habitualnegative thoughts [12] by attending to present-moment experience. MBSR training has been correlated with functional changes inthe BOLD response in somatosensory cortices [13] and in measuresof electrical current over the central sulcus [10]. Techniques usedin MBSR include a meditative body scan in which participants aretaught to sweep attention across the body, pausing to notice sensations in specific somatotopic representations, (e.g., foot, hand).This training also includes sitting meditation, in which studentsare asked to attend in a moment-by-moment way to the breathand related somatic sensations. Given the importance of somaticattention training to MBSR, we hypothesized meditators woulddemonstrate an enhanced differentiation of 7–14 Hz alpha powerin response to a cue (cue-“foot” vs. cue-“hand”) in the hand mapof SI. To test our hypothesis, we used MEG to record signals fromthe hand area in right SI, using signals from the SI finger representation. As in previous studies, [26,34,27], we localized the fingerrepresentation using the equivalent-current-dipole generated byevoked responses to taps of the 3rd digit fingertip of the left hand.2. Methods and materials2.1. ParticipantsSixteen participants were recruited with notices on bulletin boards and computer lists. Participants were required to be 18–50 y.o., right-handed healthy Englishspeakers without any active medical (including neurological and rheumatological)or psychiatric disorder, willing to comply with study requirements, including 23 hof instruction and a daily meditation practice. Persons already trained in meditationwere excluded. The study was registered with a trials registry (Clinicaltrials.gov) andapproved by ethics boards at Massachusetts General Hospital and Harvard MedicalSchool. All participants gave written consent to participate and allow use of theirdata for research. The average age was 31.6 (s.d. 7.0). Fifteen of sixteen participantswere women, with 12 Caucasians, 2 Hispanics and 1 Asian American (1 drop out wasunknown). The data reported here are from 12 participants (6 in each group) with1 in each group lost to drop out and 1 subject’s scans in each group lost to MEG artifacts. Scans were acquired at 0, 3 and 8 weeks. Participants were randomly assignedto MBSR or a control group. Control group members were asked not to meditateduring the study and were promised free MBSR at the trial’s end. MEG scans andanalysis were performed by blinded technicians.2.2. MBSR interventionClass instruction followed CFM guidelines described in [34].2.3. MEG scan experimental proceduresThe experimental procedures were described previously in Jones et al. 2010 [26].Here we review these methods.2.3.1. Tactile stimuliThroughout the experimental session, the subject’s hand and foot rested on plastic frames through which tactile stimuli (single cycle of a 100 Hz sine wave, 10 msduration) were delivered by fused multi-layer piezoelectric benders (Noliac, Inc., see[27]). Stimuli were applied to distal pads of the 3rd digit of the left hand and 1st digitof the left foot. Matched intensity of stimulation, relative to perceptual threshold,was maintained throughout for each subject using a Parameter Estimation Sequential Testing (PEST) procedure [40,8]. During cued attention runs (Fig. 1), stimulusFig. 1. Schematic illustration of cued attention runs. See Methods.strength was kept at a 66% detection level with supra-threshold (100% detected)and null-stimuli randomly interleaved for 10% and 20% of the trials (as in [27,28]).2.3.2. Localization runsTo localize primary equivalent current dipoles (ECDs) in the SI, hand representation, each experiment began with a run of supra-threshold stimuli for 3 min withan ISI of 3 s with 60 trials/run. Separate localization runs were also performed onthe foot. However, because dipoles could not be reconstructed from foot data, onlyhand area activity is presented.2.3.3. Cued attention-detection runsSubjects were instructed to fixate on a cross on a projection screen. After aninitial PEST psychophysical threshold run lasting 3 min, there were at least 5 cuedattention-detection runs, described in Fig. 1. Each cued attention–detection triallasted for 3.5 s. Each trial began when the fixation-cross changed into a visual wordcue on a projection screen facing the subject. The cue directed the participant toattend to the cued location in preparation for completing the detection task ofreporting whether he/she detected a light tactile stimulus at the cued body area(e.g., cue-“hand,” cue-“foot,” or cue-“either,” with the present study reporting onlyon the difference in alpha modulation in the “hand” vs. “foot” runs). Cues were noninformative about where the actual stimulus took place and were only informativein directing the subject to focus on a location in order to report whether a stimuluswas felt at that cued location.The visual cue was accompanied by a 60 dB, 2 kHz auditory tone delivered toboth ears to mask the tactile stimulator’s audible clicks. Visual and auditory stimulilasted for 2.5 s. At a randomized time between 1.1 and 2.1 s after the cue, the tactilestimulus, consisting of a brief (10 ms) sine wave cycle, was delivered to the fingeror toe.Psychophysics were standardized across subjects in order to facilitate discoveryof differences in prestimulus alpha modulation: stimulus intensity was dynamicallymaintained at a 66% detection rate using a two-up-three-down staircase PEST algorithm [27]. Each scan session included at least 5 runs with at least 40 stimuli perrun for the cue-“foot” and cue-“hand” conditions. Scans were acquired at 0 weeks,3 weeks and 8 weeks.2.4. MEG source analysisPrevious publications have described MEG data acquisition, and MEG sourceanalysis [26–28]. We summarize them here.2.4.1. MEG data acquisition and source analysisMEG signals were recorded using a 306-channel whole-head planar dc-SQUIDNeuromag Vectorview system (Helsinki, Finland). Data were acquired at 601 Hz andfiltered from 0.1 to 200 Hz. For details about head position, vertical and horizontalelectro-oculogram (EOG) parameters and rejection of eyeblink-contaminated trials,see [27].The contribution from the left 3rd digit representation in SI to measured fields(an example is displayed in Fig. 2) was estimated using a least-squares fit with adipole forward solution [45,19]. Averaged data from localization runs were usedto find an equivalent current dipole (ECD) (Elekta-Neuromag Software) at the timeof peak activity (mean peak activity 66.8 ms, s.d. 6.4 ms) in the suprathresholdruns (minimum n 50 trials per subject). Further description of localization methodsincluding goodness of fit and co-registration with MR image can be found in [28].Localization runs and dipole source fittings were repeated for each scan (weeks0, 3, and 8) for each subject, with goodness-of-fit values similar to our previousstudies [27,28]. However, in 8/36 total scans, localizations from the same subject ina different week were used. All analysis considered the forward solution from theSI source.2.5. Data analysis2.5.1. Spectral analysisWe calculated spectral power from SI source activity using a complex wavelet,from which time–frequency representations (TFRs) were determined. TFRs were cal-Please cite this article in press as: C.E. Kerr, et al., Effects of mindfulness meditation training on anticipatory alpha modulation in primarysomatosensory cortex, Brain Res. Bull. (2011), doi:10.1016/j.brainresbull.2011.03.026
G ModelBRB-8300;No. of Pages 8ARTICLE IN PRESSC.E. Kerr et al. / Brain Research Bulletin xxx (2011) xxx–xxx3Table 1Baseline total alpha power in meditators and control trolControl1.73 10 163.00 10 171.22 10 161.11 10 163.00 10 173.17 10 178.75 10 173.36 10 174.24 10 175.86 10 165.62 10 175.40 10 16In addition to the spectrogram, we calculated average power from 5 to 15 Hz foreach subject to display each subject’s peak alpha frequency in week 8 (Fig. 4).Fig. 2. Localization of SI hand map. An example from one subject’s data of the estimated SI ECD derived from the response evoked by a suprathreshold tactile stimulusto the left hand, third digit. The data localized to the SI hand representation in area3b was confirmed by crosschecking with subjects’ anatomical MRI identified with ared line outlining the omega shaped hand area in the central sulcus.Figure reprinted with permission from Jones et al. 2010.culated from 1 to 40 Hz on the SI ECD timecourses by convolving the signals with acomplex Morlet wavelet of the form w(f, f0 ) A exp( t 2 /2 t2 ) exp(2i f0 t), for eachfrequency of interest f0 , where t m/2 f0 , and i is the imaginary unit. The normalization factor was A 1/( t 2 ), and the constant m defining the compromisebetween time and frequency resolution was 7, as in [28].Time–frequency representations of power, i.e., spectrograms, were calculatedas the squared magnitude of the complex wavelet-transformed data (with powernormalized as a percentage of each subject’s total alpha power at baseline to control for individual differences), see examples in Fig. 3 (see also Table 1 for individualparticipant’s total alpha power, with baseline as defined in the section, “Measuring Alpha Modulation”). The spectrograms allowed us to visualize the dominantpower bands expressed and to eliminate the possibility that non-specific broadband power increase was a possible generator of any effects calculated by averagingover the alpha band.2.5.2. Estimation of cue-evoked alphaTo confirm that any effect observed in the postcue period was the resultof induced changes in alpha power and not the result of evoked activity timelocked to the visual cue we calculated the maximal alpha power resulting fromthe time-locked visual-cue evoked response in SI as a percentage of maximalinduced alpha power (see typical individual plot of visual-cue evoked response in SI,Supplementary material, Fig. 1) and found that mean maximal cue-evoked responsewas 2.4% (s.d. 2.03 with one outlier removed) of the maximal alpha power duringthe period from 200 ms before the cue to 1100 ms after the cue. This low percentage indicates that the visual cue evoked alpha recorded in SI was nearly 2 orders ofmagnitude smaller than the measures of alpha power from which alpha modulation was derived, discounting the idea that meditators’ enhanced alpha modulationwas due to a change in cue-evoked alpha response. Therefore, we did not removecue-evoked activity as was relevant in prior studies [44,1].2.5.3. Measuring alpha modulationWe investigated changes in anticipatory alpha power in the hand area. For eachcondition (cue-“hand” and cue-“foot”) time evolutions (0–1 s) of postcue alphapower (calculated as described above) were normalized as a percent change frombaseline, where baseline was defined as the average alpha power 200 ms aroundthe cue ( 100 ms to 100 ms). Although setting the baseline at 100 to 100 msof cue onset renders the data insensitive to the first 100 ms following the cue, thismethod allows the baseline to be reliably centered on the cue. The mean numberFig. 3. Spectrogram of control, meditation groups in cue-“foot” and cue-“hand” conditions during postcue period in week 8. To control for individual differences, data isnormalized as a percentage of each subject’s baseline alpha power. Display shows specificity of alpha power modulation and absence of broad band power changes duringthe postcue period of interest (600–1000 ms).Please cite this article in press as: C.E. Kerr, et al., Effects of mindfulness meditation training on anticipatory alpha modulation in primarysomatosensory cortex, Brain Res. Bull. (2011), doi:10.1016/j.brainresbull.2011.03.026
G ModelBRB-8300;4No. of Pages 8ARTICLE IN PRESSC.E. Kerr et al. / Brain Research Bulletin xxx (2011) xxx–xxxFig. 4. Average total power from 5 to 15 Hz for each individual participant showspredominance of 10–12 Hz individual alpha frequency.of trials for each subject was n 267, s.d. 69 cue-“hand” trials and mean n 267,s.d. 66 cue-“foot” trails.We evaluated group differences in alpha modulation using an approach developed in the only prior controlled study to our knowledge confirming the efficacyof an intervention (theanine) on cued-induced alpha modulation [16]. Specifically,we developed an alpha modulation index, MI, as a metric of attentional efficacyin differentiating cue-induced alpha modulation in the cue-“foot” vs. cue-“hand”conditions.We focused our analysis on the 600–1000 ms period when cue-induced alphamodulation effects are believed to be strongest ([12,19]). Based on our finding thatin week 0, prior to training, the early (600–800 ms) vs. late (800–1000 ms) components of the 600–1000 ms post-cue period were significantly different (p 0.01,Wilcoxon signed rank test), we considered the early and late periods as separatevariables.Based on the fact that previous studies found alpha increases in the disattendedlocation and alpha decreases in the attended location, the MI was operationalizedby subtracting the alpha power in the hand area in SI following the attendlocation-cue (cue-“hand”) from alpha power in the hand area in SI following thedisattend-location-cue (cue-“foot”). Thus, in each time period (early [600–800 ms]and late [800–1000]), the MI was calculated as the difference in alpha modulation (defined as a percent change from baseline as above) between cue conditions(e.g., cue-“foot”–cue-“hand,”) averaged across time (Fig. 5). Two cue-induced alphamodulation indices ( MIs) for each subject were calculated (e.g., early and late MI).For our primary question, we tested whether the meditation group demonstrated significantly greater differential modulation of alpha rhythms in responseto a cue (i.e., meditators demonstrated a significantly higher MI than controls)using the same (7–14 Hz) alpha band definition used in our previous study [26],similar to that used in [52] (Fig. 5). We also tested whether meditation enhancedalpha modulation in specific alpha sub-bands (alpha low1, 7–8 Hz; alpha low2,9–10 Hz; upper alpha, 11–14 Hz) and whether meditators showed enhanced modulation compared with controls in their individualized alpha frequency (definedas peak alpha frequency, see Fig. 4, 1 Hz) (Fig. 6). Because MI was distributednon-normally across subjects (evaluated with the Shapiro–Wilk test), analyseswere conducted with non-parametric tests. For our primary test comparing meditators with controls, the Mann-Whitney U test was used to evaluate differencesbetween groups in the MI, in the early and late periods. Any significant differencein any alpha parameter was further evaluated to discover whether the differencesurvived if participants’ baseline alpha power values were considered as covariates (using ANCOVA on rank-transformed data [48] as a non-parametric test ofsignificance).Fig. 5. Temporal evolution of overall (7–14 Hz) alpha power in cue-“foot” and cue“hand” in meditators vs. controls displays between group comparison of MI inearly (600–800) and late (800–1000) periods. MEG data acquired from SI hand representation in controls (top panel) and in meditators after completion of an 8-weekMM training course (bottom panel). The time series displays temporal evolution of7–14 Hz alpha power during a 0–1000 ms anticipatory period prior to a tactile stimulus, after the onset of a visual cue to attend to “foot” or to “hand.” Alpha power foreach cue condition is normalized as a percentage of power at cue onset. The red linerepresents cue “foot” responses, the blue cue “hand” responses. Differences in alphamodulation index ( MI) (calculated as mean cue-“foot”–mean cue-“hand”) betweengroups are significant in the early component (600–800 ms, indicated by gray shading) of the alpha modulation period, with the meditation group demonstrating asignificantly larger MI than controls (p 0.01, Mann Whitney U test) indicating agreater ability to modulate alpha in the SI hand map during the 600–800 ms period.2.5.4. Longitudinal analysisTo analyze the longitudinal effect of training, we classified subjects with MI 0in the early or late period as successful modulators and subjects with MI 0 asunsuccessful modulators (e.g., we coded each MI as a positive or negative value).A sign-test was then used to compare the number of positive MI vs. negative MIwithin each group at 0 and 8 weeks (Fig. 7). For each statistical test, significance istaken to be p 0.05.3. Results3.1. Baseline (week 0) group difference in alpha modulationTo assess the success of randomization in equalizing MI at thebeginning of the trial, we compared the two groups (7–14 Hz) MIat week 0 using the Mann–Whitney U test and found no significantpre-training differences.3.2. Time–frequency representations of power (1–40 Hz)For visualization of peak frequencies of activity that are modulated with attention, Fig. 3 shows time–frequency spectrogramsof 1–40 Hz power in each group in attend hand and attend footconditions in week 8 while Table 1 lists each participant’s totalalpha power. Peaks in the spectrogram occur in alpha (7–14 Hz)and beta (15–29 Hz), with clear attentional modulation observedin the alpha band (7–14 Hz), as seen in our prior study [26]. Thesepanels confirm the absence of broad-band power changes duringPlease cite this article in press as: C.E. Kerr, et al., Effects of mindfulness meditation training on anticipatory alpha modulation in primarysomatosensory cortex, Brain Res. Bull. (2011), doi:10.1016/j.brainresbull.2011.03.026
G ModelBRB-8300;No. of Pages 8ARTICLE IN PRESSC.E. Kerr et al. / Brain Research Bulletin xxx (2011) xxx–xxx5Fig. 6. Temporal evolution of alpha sub bands (low1, low2, upper and individualized alpha frequency). The time series displays temporal evolution of 7–14 Hz alpha powerduring a 0–1000 ms anticipatory period prior to a tactile stimulus, after the onset of a visual cue to attend to “foot” or to “hand.” Alpha power for each cue condition isnormalized as a percentage of power at cue onset. The red line represents cue “foot” responses, the blue cue “hand” responses. A trend showing a significant difference(p .055) between meditators and controls’ MI in the low2 alpha (9–10 Hz) band previously associated with attentional modulation is indicated with an asterisk (using theMann Whitney U test).the postcue period of interest (600–1000 ms). Statistical analysesof these differences across groups are examined below and referredto in Figs. 5 and 6.3.3. Averaged total power in 5–15 Hz frequency bins in week 8We calculated total averaged power from 5 to 15 Hz to determine the peak alpha frequency for each participant and found that10/12 subjects’ peak alpha power was centered over the 10–12 Hzrange with only one subject showing peak alpha power in a loweralpha band ( 10 Hz) and one subject at 13 Hz.3.4. Group difference in alpha modulation at 8 weeks in 600–800and 800–1000 ms postcue period3.4.1. Overall alpha band (7–14 Hz) modulationFor our primary analysis of the effect of group on alpha modulation at week 8, we compared the MI across groups in the earlyand late alpha modulation periods and found a significant difference in the early (600–800 ms) period (p 0.01, Mann–WhitneyU test, Fig. 5), such that the MI was greater in meditators thancontrols. The difference remained significant when consideringparticipants’ baseline alpha power as a covariate, tested with analysis of covariance (ANCOVA) used as a non-parametric test onrank-transformed MI and baseline alpha power data (p 0.014,F 9.12, 1.9). There was no significant difference between groupsin the late (800–1000 ms) period (p .26, Mann Whitney U test).3.4.2. Analysis of alpha sub bands and Individualized alphafrequencyWhen we tested whether meditation enhanced alpha modulation in specific alpha sub-bands and at the alpha peak for eachindividual subject, we found that in the alpha low1 band (7–8 Hz)previously associated with arousal, a comparison of meditator andcontrol MI in the early and late alpha modulation periods showedno significant difference in either period (600–800 ms, p 0.52.800–1000 ms p 0.63. Mann–Whitney U test, Fig. 6), In the alphalow2 band (9–10 Hz), previously associated with attentional processes, we found that a comparison of meditator and control MI inthe early and late alpha modulation periods showed a significantdifference in the early period (600–800 ms, p 0.055). There wasno significant difference in the late period (800–1000 ms, p 0.42,Mann–Whitney U test), In the upper alpha band (11–14 Hz) previously associated with specific task performance in working memory and other tasks, we found that a comparison of meditator andcontrol MI in the early and late alpha modulation periods showeda trend towards enhanced modulation by meditators in the earlyperiod (600–800 ms, p 0.078). There was no significant differencein the late period (800–1000 ms, p 0.52, Mann–Whitney U test).When looking at the individualized Alpha band modulation(defined as each individual’s peak frequency 1 Hz), we found thata comparison of meditator and control MI in the early and latealpha modulation periods showed no significant differences in theearly (600–800 ms, p 0.26) or late periods (800–1000 ms, p 0.52Mann–Whitney U test).To assess whether the trends showing enhanced MI in low1and upper alpha were upheld when considering baseline alphapower as a covariate, we performed an analysis of covariance asa non-parametric test on rank-transformed data and found thetrend was upheld in the low2 alpha band (low2 alpha, p 0.088,F 3.65, 1.9) but not in the upper alpha band (upper alpha, p 0.39,F 1.05, 1.9).3.5. Within group learning effects across weeks in 7–14 Hz alphamodulationTo test for learning effects in either the meditation or controlgroup, we evaluated change from 0 to 8 weeks in overall 7–14 HzPlease cite this article in press as: C.E. Kerr, et al., Effects of mindfulness meditation training on anticipatory alpha modulation in primarysomatosensory cortex, Brain Res. Bull. (2011), doi:10.1016/j.brainresbull.2011.03.026
G ModelBRB-8300;No. of Pages 86ARTICLE IN PRESSC.E. Kerr et al. / Brain Research Bulletin xxx (2011) xxx–xxxsensory neocortex. This result may explain the specific improvedattentional performance on a spatially cued attention task (the orienting component of the Attention Network task) seen in an earlierstudy of MM training [24].4.1. Significance of enhanced alpha modulation in meditationFig. 7. Longitudinal change in alpha modulation index ( MI) in controls and meditators over the course of the trial (0, 3 and 8 weeks). The number of subjects withpositive vs. negative MI in the 600–800 ms period after the cue for each group,in scans acquired in week 0, week 3 and, week 8. Meditation group’s significantimprovement from week 0 (3/6 positive MI) to week 8 (6/6 positive MI) (p 0.03,sign test) is indicated by asterisk. There was no significant change in the controlgroup.alpha power modulation in the 600–800 ms and 800–1000 msperiod, comparing the sign of group members’ MI at 0 and8 weeks. In meditators, a significant difference was observedbetween weeks 0 and 8 in the early (600–800 ms) period with3/6 meditators with MI 0 in week 0 vs. 6/6 meditators in week8, (p 0.031, sign test, Fig. 7). There was no significant differencebetween week 0 and week 8 in controls (4/6 controls with MI 0in week 0, vs. 3/6 controls in week 8) in either period.4. DiscussionWhen compared with controls, meditators demonstratedenhanced differentiation of 7–14 Hz alpha power in response toan instruction (cue-“foot” vs. cue-“hand”) in the hand map of SIduring the 600–800 ms postcue period. Additionally, meditatorsshowed significant enhancement from 0 to 8 weeks in 7–14 Hzalpha modulation in the 600–800 ms postcue period, while nochange was observed in controls. Meditators
nduced alpha modulation. MM is said to train the ability to pay moment-by-moment attention to sensations, feelings and thoughts in order to cultivate present moment awareness. MM training has been reported to improve performance in a spatial attention task [24],