Transcription
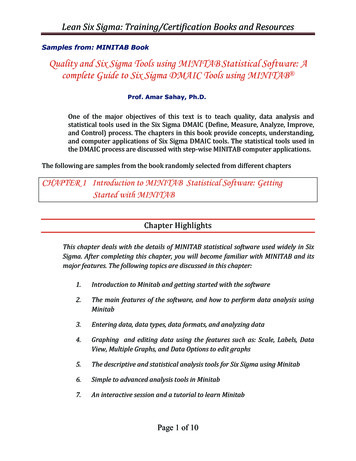
Lean Six Sigma: Training/Certification Books and ResourcesSamples from: MINITAB BookQuality and Six Sigma Tools using MINITAB Statistical Software: Acomplete Guide to Six Sigma DMAIC Tools using MINITAB Prof. Amar Sahay, Ph.D.One of the major objectives of this text is to teach quality, data analysis andstatistical tools used in the Six Sigma DMAIC (Define, Measure, Analyze, Improve,and Control) process. The chapters in this book provide concepts, understanding,and computer applications of Six Sigma DMAIC tools. The statistical tools used inthe DMAIC process are discussed with step‐wise MINITAB computer applications.The following are samples from the book randomly selected from different chaptersCHAPTER 1 Introduction to MINITAB Statistical Software: GettingStarted with MINITABChapter HighlightsThis chapter deals with the details of MINITAB statistical software used widely in SixSigma. After completing this chapter, you will become familiar with MINITAB and itsmajor features. The following topics are discussed in this chapter:1.Introduction to Minitab and getting started with the software2.The main features of the software, and how to perform data analysis usingMinitab3.Entering data, data types, data formats, and analyzing data4.Graphing and editing data using the features such as: Scale, Labels, DataView, Multiple Graphs, and Data Options to edit graphs5.The descriptive and statistical analysis tools for Six Sigma using Minitab6.Simple to advanced analysis tools in Minitab7.An interactive session and a tutorial to learn MinitabPage 1 of 10
Lean Six Sigma: Training/Certification Books and ResourcesMINITAB Statistical Software: An OverviewOUTLINE: CHAPTER 1Objectives and OverviewMINITAB Statistical Software: An OverviewWorksheet (Data Window)Session WindowHistory WindowAnalyzing Your DataGraphing Your Data: Scale, Labels, Data View, Multiple Graphs, Data OptionsPrinting and Saving Your WorkCommand Sequence Used In This TextPreparing Your ReportChanging data from Numeric to Text or Text to NumericEditing Your Graphs and PlotsAn Interactive Session with MINITABSample pages from Chapter 1Main menu itemsSession window displays the outputData window or worksheetPage 2 of 10
Lean Six Sigma: Training/Certification Books and ResourcesFigure 2.1: The Session and the Data WindowSuffix D means theColumn is formatted as datesSuffix T means theColumn is formatted as textColumns identified byC1,C2,.C6. etc.Variable NameNo suffix means theColumn is formatted as numbersThe row above row 1 is reserved for naming variablesFigure 2.4: Different Types of Data in MINITAB Work SheetTutorial1.Start MINITAB Using the Following Command SequenceStart &Programs &MINITAB (or double click on the MINITAB icon)(Note: the instructions in this chapter are for MINITAB release 16 but mostcommands will also work with MINITAB 15, the previous release).2.Enter the Data in MINITAB WorksheetTable 2.1 shows the number of orders received by a company for the past 50 weeks.This data is also available in data file: ORDERS.MTW but you may enter the data inthe MINITAB worksheet. To enter the data manually, label column C1 of the MINITABworksheet with No. of Orders and enter the 50 values in this column. You may enterthe values in any order (row or column wise) but make sure all 50 values are in onePage 3 of 10
Lean Six Sigma: Training/Certification Books and Resourcescolumn (C1). You may enter only part of data if you wish or open the fileORDERS.MTW from the data files.Table 2.1Number of Orders for the past 50 weeksNo. of 170163Figure 2.9 shows part of the data file or the worksheet. Once the data are entered, usethe command sequenceFile & Save Current Worksheet asName the file ORDERS and save it. MINITAB puts an extension .MTW to all the datafiles.Label column C1 as shownand enter the 50 values in thiscolumnFigure 2.9: Part of the Data File or Worksheet in MINITAB3. Entering the Data in MINITAB Worksheet – Another Example:::Page 4 of 10
Lean Six Sigma: Training/Certification Books and ResourcesColumns C1 to C7each contains onevariable.Figure 2.10: Entering Data – Each Column Containing One Variable4. Selecting Variable(s) for AnalysisSelecting a menu item for analysis from the main menu will display a dialog boxshowing the list of variables Stat & Graphical Summarywill show the dialog box shown in figure below. The variable or variables for analysisare then selected from this list.Refer to figure above. Suppose we want ‘Graphical Summary’ of the variable ‘Strength.’Double click on this variable from the list of variables from the left side and it will appearunder the “Variables” box (see Figure 2.13). If you want the ‘Graphical Summary’ of morethan one variable, highlight all the variables from the variables list using your mousepointer then click the “Select” button at the bottom of the variables list. Figure 2.14 showshow to select more than one variable for analysis.Page 5 of 10
Lean Six Sigma: Training/Certification Books and ResourcesFigure 2.13: Selecting a Variable for AnalysisFigure 2.14: Selecting Multiple Variables for Analysis5. Sort the DataOpen the worksheet ORDERS.MTWData &SortTo complete the Sort dialog box that is displayed; double click on C1 No. of Ordersfrom the box on the left side of the dialog box that displays the list of all variables, thecolumn they are .6. Generate Patterned Data in the Worksheet (generating a sequenceof numbers)::Calc &Make Patterned Data &Simple Set of NumbersComplete the Simple Set of Numbers dialog box by typing the following responseFrom first value1To last value50Page 6 of 10
Lean Six Sigma: Training/Certification Books and ResourcesIn steps ofList each valueList the whole sequence1 .Click OK and the numbers 1 through 50 will be stored in column C3 of the worksheet.Label this column Week.7.Generate Random DataYou can also generate random data from various distributions. For example, togenerate 100 random numbers from a normal distribution, use the followingcommand sequence:Calc & Random Data &NormalComplete the Normal Distribution dialog box by typing the following response:::Click OK and 100 random numbers from normal distribution with mean 50 andstandard deviation 5 will be generated and stored in column C4 of the worksheet.Name this column Random Numbers.8.9. .Doing a Simple Analysis . Assuming the data file ORDERS.MTW is open with column C1 of the data file withnumber of orders for 50 weeks. To calculate the descriptive statistics for this data,follow the command sequence belowStat &Basic Statistics &Display Descriptive StatisticsIn the Display Descriptive Statistics dialog box, type C1 or double click C1 No. ofOrders from the list of variables from the left side then click on the Statistics tab. Thedialog box in Figure 2.16 will be displayed.Figure 2.16: Descriptive Statistics Dialog BoxPage 7 of 10
Lean Six Sigma: Training/Certification Books and Resources .You may select additional statistics and then click OK. You will be back to DisplayDescriptive Statistics dialog box. Click OK and the selected statistics will becalculated and displayed on the Session window as shown in Table 2.2.Table 2.2Descriptive Statistics: No. of OrdersVariableN N* Mean SE Mean StDev Minimum Q1 Median Q3No. of Orders 50 0 144.52 4.1029.02 81.00130.25 142.50 164.75VariableMaximumNo. of Orders 198.00You can also construct simple graphs of your data by clicking on Graphs tab under DisplayDescriptive Statistics dialog box. To do the graphs, use the following command sequence:Stat &Basic Statistics & Display Descriptive StatisticsIn the Display Descriptive Statistics dialog box, double click on No. of Orders on theleft .Figure 2.17: Selecting Statistics and GraphsPage 8 of 10
Lean Six Sigma: Training/Certification Books and Resources10. Constructing Graphs using Graph Menu CommandYou can construct a variety of graphs and charts using the Graph command. We haveexplained here how you can do a stem‐and‐leaf plot, a scatter plot and a time seriesplot.(a) Construct a Stem‐and‐leaf plot of No. of Orders (stored in column C1): Fromthe main menu, select the command sequence:Graph & Stem‐and‐leafIn the Stem‐and‐leaf dialog box, select, C1 No. of Orders or then click OK. Thestem‐and‐leaf plot shown in Figure 2.18 will be displayed.Stem‐and‐Leaf Display: No. of OrdersStem‐and‐leaf of No. of Orders N 50Leaf Unit 1.02 8 175 9 0468 10 0359 11 212 12 55821 13 133446789(5) 14 1222324 15 127720 16 003333347910 17 0024694 18 382 19 38Figure 2.18: Stem‐and‐leaf Plot(b) Construct a Scatter Plot: Select the command sequenceGraph &ScatterplotIn the scatterplots dialog box, select Simple then click OK. Scatterplot‐simple dialogbox will be displayed. Type or select No. of Orders for Y variables and Week for variables. Click OK. The scatter plot (shown below) of number of orders for 50weeks will be shown on the graphics window (Figure 2.19).Page 9 of 10
Lean Six Sigma: Training/Certification Books and ResourcesScatterplot of No. of Orders vs Week200No. of Orders1801601401201008001020304050WeekFigure 2.19: Scatterplot of Number of Orders(c) Construct a Time Series PlotA time series plot displays data over time. Suppose we want to construct a time seriesplot of number of orders for the past 50 weeks. Select the command sequenceGraph &Time Series PlotIn the Time Series Plot dialog box, click on Simple Time Series Plot of No. of Orders200No. of gure 2.20: A Time‐Series Plot of Number of Orders11. Saving Your WorkBy now you should have data in four columns C1, C2, C3, and C4 of the worksheet. Youcan save your work usingFile &Save Current Worksheet asPage 10 of 10continued
Lean Six Sigma: Training/Certification Books and Resources Page 1 of 10 Samples from: MINITAB Book Quality and Six Sigma Tools using MINITAB Statistical Software: A complete Guide to Six Sigma DMAIC Tools using MINITAB Prof. Amar Sahay, Ph.D. One of the major objectives of this text is to teach quality, data analysis and