Transcription
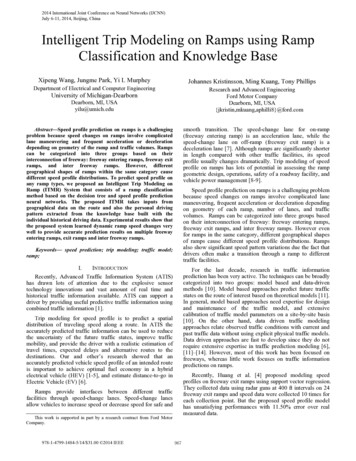
2014 International Joint Conference on Neural Networks (IJCNN)July 6-11, 2014, Beijing, ChinaIntelligent Trip Modeling on Ramps using RampClassification and Knowledge BaseXipeng Wang, Jungme Park, Yi L MurpheyJohannes Kristinsson, Ming Kuang, Tony PhillipsDepartment of Electrical and Computer EngineeringResearch and Advanced EngineeringFord Motor CompanyDearborn, MI, USA{jkristin,mkuang,aphilli8}@ford.comUniversity of Michigan-DearbornDearborn, MI, USAyilu@umich.edusmooth transition. The speed-change lane for on-ramp(freeway entering ramp) is an acceleration lane, while thespeed-change lane on off-ramp (freeway exit ramp) is adeceleration lane [7]. Although ramps are significantly shorterin length compared with other traffic facilities, its speedprofile usually changes dramatically. Trip modeling of speedprofile on ramps has lots of potential in assessing the rampgeometric design, operations, safety of a roadway facility, andvehicle power management [8-9].Abstract—Speed profile prediction on ramps is a challengingproblem because speed changes on ramps involve complicatedlane maneuvering and frequent acceleration or decelerationdepending on geometry of the ramp and traffic volumes. Rampscan be categorized into three groups based on theirinterconnection of freeway: freeway entering ramps, freeway exitramps, and inter freeway ramps. However, differentgeographical shapes of ramps within the same category causedifferent speed profile distributions. To predict speed profile onany ramp types, we proposed an Intelligent Trip Modeling onRamp (ITMR) System that consists of a ramp classificationmethod based on the decision tree and speed profile predictionneural networks. The proposed ITMR takes inputs fromgeographical data on the route and also the personal drivingpattern extracted from the knowledge base built with theindividual historical driving data. Experimental results show thatthe proposed system learned dynamic ramp speed changes verywell to provide accurate prediction results on multiple freewayentering ramps, exit ramps and inter freeway ramps.Speed profile prediction on ramps is a challenging problembecause speed changes on ramps involve complicated lanemaneuvering, frequent acceleration or deceleration dependingon geometry of each ramp, number of lanes, and trafficvolumes. Ramps can be categorized into three groups basedon their interconnection of freeway: freeway entering ramps,freeway exit ramps, and inter freeway ramps. However evenfor ramps in the same category, different geographical shapesof ramps cause different speed profile distributions. Rampsalso show significant speed pattern variations due the fact thatdrivers often make a transition through a ramp to differenttraffic facilities.Keywords— speed prediction; trip modeling; traffic model;ramp;I.INTRODUCTIONFor the last decade, research in traffic informationprediction has been very active. The techniques can be broadlycategorized into two groups: model based and data-drivenmethods [10]. Model based approaches predict future trafficstates on the route of interest based on theoretical models [11].In general, model based approaches need expertise for designand maintenance of the traffic model, and extensivecalibration of traffic model parameters on a site-by-site basis[10]. On the other hand, data driven traffic modelingapproaches relate observed traffic conditions with current andpast traffic data without using explicit physical traffic models.Data driven approaches are fast to develop since they do notrequire extensive expertise in traffic prediction modeling [6],[11]–[14]. However, most of this work has been focused onfreeways, whereas little work focuses on traffic informationpredictions on ramps.Recently, Advanced Traffic Information System (ATIS)has drawn lots of attention due to the explosive sensortechnology innovations and vast amount of real time andhistorical traffic information available. ATIS can support adriver by providing useful predictive traffic information usingcombined traffic information [1].Trip modeling for speed profile is to predict a spatialdistribution of traveling speed along a route. In ATIS theaccurately predicted traffic information can be used to reducethe uncertainty of the future traffic states, improve trafficmobility, and provide the driver with a realistic estimation oftravel times, expected delays and alternative routes to thedestinations. Our and other’s research showed that anaccurately predicted vehicle speed profile of an intended routeis important to achieve optimal fuel economy in a hybridelectrical vehicle (HEV) [1-5], and estimate distance-to-go inElectric Vehicle (EV) [6].Recently, Huang et al. [4] proposed modeling speedprofiles on freeway exit ramps using support vector regression.They collected data using radar guns at 400 ft intervals on 24freeway exit ramps and speed data were collected 10 times foreach collection point. But the proposed speed profile modelhas unsatisfying performances with 11.50% error over realmeasured data.Ramps provide interfaces between different trafficfacilities through speed-change lanes. Speed-change lanesallow vehicles to increase speed or decrease speed for safe andThis work is supported in part by a research contract from Ford MotorCompany.978-1-4799-1484-5/14/ 31.00 2014 IEEE967
Even though ramps are already classifieed into the threecategories mentioned above, the ramps within each categoryhave different physical shapes that result inn different speedprofiles. Another challenging issue in speed pprofile predictionson ramps is lack of dynamic traffic data on raamps. In general,traffic sensor data on ramp are not availaable. Using onlygeometric data and traffic sensor data on the nnearby freeway isnot enough to generate reliable speed profiles. To make theprediction system robust, we build a Knowlledge Base (KB)using the individual driving historical data on the known routes.The KB provides individual driving stattistics based ongeographical characteristics. The informationn extracted fromthe KB can be utilized for any new route to immprove the speedprediction performances.here xi is defined by itstraveling points xi, i 1,., M whlongitude and latitude and M is thee index of the last travelingpoint on the ramp and the longerr ramps have the larger Mvalue: R {x1 , x 2 ,., x M xi (longituue i , latitudei )} .B. Ramp ClassificationRamps have various different physical shapes even withinthe same ramp type (e.g. freeway enntering ramp). Fig. 2 showsthree freeway entering ramps and sets of corresponding speedprofiles which were recorded by inddividual drivers using GPS.As shown in Fig. 2, different ramp shapes causes the differentramp speed profiles even though thhey are all freeway enteringramps.Ramp classification is an essenttial procedure to group theramps with similar shapes. The purrpose of ramp classificationis to improve speed profile predicttion performance on rampsby grouping similar physical shaapes of ramps. With thecurrent ATIS, available informationn for the ramp classificationis geometric information only. Iff the historical individualdriving data on the ramp exists, the historical data is useful forthe ramp classification by grouuping ramps with similarhistorical speed profiles. But historical individual driving datais not available for every ramp. Also, this ramp classificationneeds to be done quickly so ITMRR system is able to predictthe speed profile in real time. Connsidering the available datalimitation and processing timing constraint, a hierarchicaldecision tree is a good candidate forf the ramp classification,which is a rule-based classificationn method with satisfactoryperformances and quick response timme.Trip Modeling onIn this paper, we present an Intelligent TRamp (ITMR) System that extracts informatiion from the KBbased on ramp classification and predicts a speed profile onany ramp at the given trip starting time. ITTMR uses rampgeometry information, traffic data on the neaarby freeway andstatistics extracted from the KB. This paperr is organized asfollows; In Section II, we present ramp classiffication and buildthe Knowledge Base using individual historiical driving data.Ramp speed profile prediction Neural Netwworks (NNs) areexplained in detail in Section III. The propossed ITMR is thenevaluated with real driving recorded data in Section IV.Finally, the conclusion is presented in Sectionn V.II.RAMP CLASSIFICATION AND KNOWWLEDGE BASETraffic information predictions such as sspeed, flow, andtravel time are complex non-linear spatial-temmporal problemsfor which the dynamics in free-flowing and congestedconditions are different. Artificial Neural NNetworks (ANN)have been applied successfully in the preddiction of trafficinformation such as speed, flow, and travel tiime [4], [6], [1516]. The ANN based approaches [12-13] aare able to learncomplicated non-linear relationship betweenn input featuresand output patterns. The ANN based approachhes are relativelyless sensitive to erroneous or missing datta and they areindependent of the particular geometry of preddiction location.The objective of this research is to prredict individualdriving speed profiles on ramps at the trip sttarting time. Theprediction relies on the geographical informattion of the ramps,TMC traffic information provided by ATISS, and statisticalwas built usinginformation available from the KB that wavailable historical driving data on any rramp routes. Topredict the individual driving speed at eachh traveling pointalong the selected ramp route before the tripp starts, we buildRamp Speed Profile Prediction (RSPP) NN syystems.Fig.1. Relationship between TMC, link, shappe points and traveling points.A. Traveling Points on RampAccording to ATIS (e.g. in our case provvided by Here orformer Nokia/Navteq), geographical informmation data areorganized hierarchically with three concepts: Traffic MessageChannel (TMC) sections, links, and shape pooints as shown inFig.1. To generate more precise speed preediction at finerresolution than shape point and link, we ddefined travelingpoints based on speed limit and free flow speeed on ramps suchthat a shape point contains several travelinng points. Usingtraveling points, the ramp R can be defined as a series ofFig. 2. Different entering ramp shapes and coorresponding speed profiles.968
Fig. 3 presents the proposed decision trree for the rampclassification. In the ramp classification decission tree, the rootnode is a ramp type, i.e. freeway entering rammp, freeway exitramp, and inter freeway ramp. Geographical features such asspeed limit, curvature distribution mode, andd the location oflarge curvature on the ramp are used to split the decision treeafter the root layer.locations of large curvature on the ramps. Thus, a ramp withthe large curvature point at the begiinning will have a differentspeed profile than a ramp with the large curvature point at theend. We defined that the curvature is large if the curvature onthe traveling point xi, Θ(xi), is greatter than threshold (we used20 ). Four different categories are defined based on the largecurvature location: 1) no large curvature 2) large curvature atthe first third part of the ramp, 3) laarge curvature points at therest of two third of the ramp, 4) both portion has largecurvature points. Based on our obbservation, driving patternsappear to be different at the first thhird part of the ramp fromthe last two third of the ramp. For example some ramps havedifferent curvatures at the beginningg than the rest of ramps.First, the decision tree is splitting based onn the speed limit.Then, the decision three is divided into the nexxt layer using thecurvature distribution mode on the ramp. The curvaturedistribution mode represents the most frequennt curvature rangeon the ramp. Fig. 4 shows three diffferent curvaturedistribution modes in three different ramp sshapes. Based onthe analysis of curvature distribution on the ramps presentedin Fig. 5, we defined four bins with 2.5 curvvature range from0 to 10 such that Bin1 [0 , 2.5 ], Bin2 (2.5 , 5 ], Bin3 (5 , 7.5 ] and Bin4 (7.5 , 10 ]. Then the fifthh bin is set to thelarge curvature range 10 to 90 (i.e. Bin5 (10 , 90 ])because curvatures in this range do not occur ffrequently.Fig. 6 presents two cases whenn the large curvature existsat end of the ramp and at the beeginning of the ramp. Thecorresponding speed profile shoows that the speeds aredecreased when the curvature is large. Fig. 7 presentsexamples of the ramp classificattion results based on thedecision tree using speed limit, cuurvature distribution mode,and large curvature location on thee ramp. Two circular shapefreeway entering ramps in Figure 7a are classified as the samegroup and two rather straight ramps in Figure 7b are groupedinto the same category. The decission tree is tested with 40different ramps (16 entering ramps, 13 exit ramps, and 11 interfreeway ramps) and it classifies into 24 different ramp groupsusing the decision tree mentioned abboveFor each traveling point xi, the curvvature Θ(xi), iscalculated as follow:xiarccos·(1)whereis an Euclidean vector fromtoand · isthe dot product. To determine the curvature distribution mode,every traveling point on the ramp votes for iits correspondingcurvature bin. Based on the curvature of the ttraveling point xion the ramp, Θ(xi), the corresponding bin hhas increased itsfrequency value by 1. Among 5 bins, the biin with the mostfrequencies is selected as the curvature distribbution mode.After the decision tree for the ramp classsification is splitaccording to the curvature distribution moode, the tree isdivided into one more layer using the large cuurvature locationon the ramp because drivers tend to decrease tthe speeds at theFig. 4. Curvature distribution modes in differrent ramp shapes.# of Data Points4000300020001000002.5577.5Curvatuure1090Fig. 5. Example of histogram of curvaturee on freeway entering ramps.Fig. 3. Ramp classification decision tree based on speedd limit and curvaturedistributions.969
C. Building the Knowledge Base annd Extraction of Statisticsbased on MatchingHistorical individual driving daata on a route can containuseful information for speed profille prediction. Based on thecorrelation analysis, a driver’s speed profile has a very highcorrelation with the driver’s own historicalhdriving statistics.However, these historical individuaal driving data are often notavailable for every route, thereforre, when the speed profileprediction is needed on a new rooute, the historical drivingstatistics may not be available. In order to deal with thissituation, we build a Knowledge BaseB(KB) that contains theindividual driving statistics with reespect to road geographicalfeatures. The ramp KB can be builtbusing an incrementallearning process. The KB can be updated whenever newdriving data are available withoutt referring to the previoustraining data.When a speed profile predicction on a new route isrequested and there are no historicaal driving data available, weuse the following matching algorithhm to extract the historicaldriving statistics from the best matcching traveling points in theramp KB.Fig 6.Example of large curvature locations and speed profiles.Step I. Find the ramp category K for the new ramp using thedecision tree (presented in Chapter II-B) based ongeographical information such asa speed limit, the curvaturedistribution mode, and the large curvature location.Step II. For every traveling point xi on the new ramp wherei 1,.,M and M is the last traveling point on the new ramp,1) Find the set of traveling poiints among the ramps withthe same category K. For thee simplicity, those travelingpoints are denoted as Ω {k1,.,kN}.2) Find the best matching point in Ω {k1,.,kN} with xi onthe new ramp. This travelinng point to point matchingprocess is based on two feattures, the curvature and thedistance from the beginninng of the ramp. The bestmatching traveling point in Ω {kΩ1,.,kN} is found withthe shortest Euclidean distancce as defined below:Min(a) Entering Ramp classification: group 1Ωθ xθ kD xD k(2)where D(p) is the distance from the beginning of theramp to the location p.For example, Fig. 8 presents the beest matching traveling pointin the ramp category K with the traaveling point x2 (red circle)on the new route. To find the best matchingmtraveling point inthe KB category K, the Euclidean distancesdbetween x2 on thenew route and all point kj Ω inn the KB category K, arecalculated. Then, the traveling pointpwith the minimumEuclidean distance is selected as thhe best matching travelingpoint (green color) in the KB categoory K.III.E PREDICTION NEURALRAMP SPEED PROFILENETWWOKRThe objective of this research is to predict the speed profileon any ramp. To accomplish thee objective, we developedRamp Speed Profile Prediction Neeural Networks (RSPPNN)(b) Entering Ramp classification: group 2Fig. 7. Examples of entering ramp classification by the deecision tree.970
8070speed (mph)605040302010-83.69-83.6895 -83.689-83.6885 -83.688-83.6875Fig.8. Matching the new ramp with known ramps in knowledge base.42.30642.30442.302latitudelongitudesystem that predicts the driving speed profile along theselected ramp route before the trip starts. Traffic informationpredictions such as speed, flow, and travel time are complexnon-linear spatial-temporal problems for which the dynamicsin free-flowing or congested conditions are different. Thelearning capabilities of neural networks make them a suitableapproach for solving the complicated non-linear trafficprediction problem. The NN based traffic prediction systemrequires time intensive training to learn from the traffictraining data and also the performance of NN based the trafficprediction system is very much dependent on the design of itsinput features and its architecture. Analysis of the featuresavailable to choose highly correlated input features with theoutput is an important step when developing a reliable speedprediction system.Fig.9. Recorded Speed profiles on a selected freeway entering ramp.each of the available features. TABLE I presents the top 6highest correlated features with the true recorded speed onvarious ramps, where μis the average historical speed,σis standard deviation of historical speed, maxismaximum historical speed, andmin x is minimumhistorical speed at the traveling point xi. For the freewayentering ramp and the exit ramp, the average historical speedμhas the highest correlation with the true vehicle speed.For the inter freeway ramp, the location index (i.e. travelingpoint xi) has the highest correlation with the true vehicle speed.Based on this analysis, the top 6 highly correlated featureswere selected as inputs to the RSPPNN system.A. Feature Selection based on Correlation AnalysisAll the geographical information on ramps is acquiredthrough an ATIS (in our case provided by Here or formerNokia/Navteq) and the available information includes latitude,longitude, altitude, number of lanes, curvature, speed limit, etc.The individual driving data on the selected ramps werecollected by two different vehicles equipped with data loggersand a total of 720 trips on 40 different selected ramps wererecorded. Fig. 9 displays speed profiles recorded on differentdays on a freeway entering ramp at the intersection betweenthe local Plymouth Road and freeway I-94 in Ann Arbor,Michigan, U.S.A. In Fig. 9, the speed profile is represented ina three-dimensional plot where x is longitude, y is latitude andz is the actual recorded speed in miles per hour (mph). Usingindividual driving historical data on ramps, a KB was builtthat contains average historical speed, standard deviation ofhistorical speed, and the maximum and minimum historicalspeed at each traveling point on the ramp. Since the vehiclespeed on the ramp is quite related with the location on theramp, two more features are defined by us. First, the distancefrom the beginning of the ramp to the traveling point xi,is calculated. Secondly, the distance from xi to the nearestpoint where the curvature is larger than 20 is calculated and.denoted asB. Architecture of Ramp Speed Profile Prediction NNThe RSPPNN is built with the multi-layer perceptron(MLP) type neural network which consists of three layers withone single output which is the predicted speed. A backpropagation algorithm is used for all NN training, a logsigmoid transfer function is used for the hidden layer, and apure linear transfer function is used for the output layer. Thehidden layers of these neural networks vary from 5 to 50hidden nodes. The number of hidden nodes for each neuralnetwork hidden layer is determined using the followingtraining process; for each possible number of hidden nodes weapply 3-fold cross validation to train and evaluate the system.The number of hidden nodes that gave the best validationresults is chosen for the neural network. According to theexperiments results, the best hidden node number are 10, 15,and 10 for entering ramp NN, inter freeway ramp NN, and exitramp NN respectively.Based on the feature selection analysis in Section III-A, theRSPPNN is designed to take the three different types of inputs:geographical inputs, individual historical inputs, and thedynamic traffic TMC data which is the traffic sensor data onthe freeway where the ramp merges and denoted as. Forthe inter freeway ramp, TMC data near the beginning of theramp is used because two TMC data are available on the interfreeway ramp (i.e. near the beginning and the ending of theramp). Three geographical input features are used: 1) thelocation index at xi,, 2) the distance fromthe beginning of the ramp to the traveling point xi,, and3) the distance from xi to the nearest point where the curvatureTo find effective input features to the RSPPNN systemamong all available geographical & historical statisticsfeatures, Pearson correlation analysis is applied. Pearsoncorrelation measures how well the variables are related. Weapplied this analysis between recorded true vehicle speeds and971
is larger than 20 ,. The indivvidual historicaldriving features used as inputs to RSPPNN ssystem are 1) theaverage speed of historical driving data at xi, μ, 2)standard deviation of historical driving speedd at xi, σ, 3)the maximum historical driving speed at xi, mmax, and 4)the minimum historical driving speed at xi, min x . Theoutput of the RSPPNN is the predicted speed at the location xi.Fig. 10 presents the architecture of the RSPPNNN.IV.IMPLEMENTATION AND EXPERIMMENT RESULTAs described earlier in the paper, our Intelligent TripModeling on Ramp (ITMR) system conssists of a rampclassification decision tree, knowledge bbase built withindividual historical driving data, and speed pprofile predictionneural networks, RSPPNN. The overall arcchitecture of theITMR system is presented in Fig. 11. When a speed profile ispredicted on a new route, the ITMR system ffirst classifies theramp category based on geographical informaation as explainedin Section III-B. Then, a matching process is performed toextract the historical statistics at the best maatching travelingpoints from ramps with the same category in KB. Finally,input features defined in Fig. 10 are generatedd and fed into theRSPPNN system. The output of the system is the predictedspeed profile on the ramp.TABLE I.CR*In order to evaluate ITMR syystem, real driving trips onvarious ramps are recorded by multiple drivers at Ford MotorCompany. The real driving data seet contains 720 trips on 40different ramps (16 entering rampss, 11 inter freeway ramps,and 13 exiting ramps). The evaluuation of ITMR system isperformed in cross region validatioon. For an example, if tworamps, Ramp #1 and Ramp #10, aree in the same category, bothof the ramps are tested with the RSSPPNN trained on the otherramp. So the speed profile predictiion on Ramp #10 uses thesystem trained with Ramp #1 and viice versa.PEARSON CORRELATION ANALYYSIS RESULTSEntering RampSymbolFig.11. The architecture of an Intelligent Tripp Modeling on Ramp (ITMR)System.Inter RampSymbolCR*EExit 83900.73450.42050.8205The ITMR system prediction performance is measuredusing mean absolute error (MAEE). Mathematically, a truerecorded speed profile, for the givegroute R is a series ofspeedsrecorded at the traveling points ,, , ,(3)The predicted speed profile, for thet given route R is a seriesof speedspredicted at the pointss .(CR* : Correlation Value),, ,(4)Thus, .(5)Fig. 12 presents an example off the predicted speed profileMRd to US-14 in Annby ITMR system (blue plot) on MillerArbor, Michigan, U.S.A. The truee recorded speed profile issuperimposed with red color in Fig.F12. The MAE of theproposed ITMR system in this casee is 1.921 mph. TABLE IIshows the performance of ITMR system on freeway enteringramps. Total 16 freeway entering ramps are evaluated usingnce of ITMR on freeway337 trips. The average performanentering ramps is 6.9782 mph. For the comparison, theout KB is calculated as aperformance of the system withobaseline. The baseline system is implemented exactly them except that it only takessame way with the ITMR systeminputs of dynamic traffic TMC dataa and the geographical dataFig.10. The architecture of RSPPNN.972
TABLE III.to RSPPNN. In general, ITMR system improves theperformance 14% over the system without KB. Theperformance of Ramp 8 and Ramp 11 are not good because oflack of the training data (these ramps belong to the samegroup but Ramp #11 only has one trip, and Ramp #8 only has2 trips. We do not have enough training data for this case).TABLE III shows the performances of ITMR system on interfreeway ramps. A total of 11 different inter freeway ramps areevaluated using 107 recorded trips. The average performanceof ITMR on inter freeway ramps is 3.7973 mph with 47.97%improvement over the baseline system that did not use a KBfor speed profile prediction.RampCategory#7#8Speed (mph)403530TruthPrediction of ITMR15051015Travelling Point SequenceFig.12. An example of speed profile prediction on the freewayentering 3.21515.3152Ramp4Ramp53.46255.8590CONCLUSIONWe have presented an Intelligent Trip Modeling on Ramp(ITMR) system to predict speed profiles on freeway ramps.The ITMR system consists of a ramp classification decisiontree, a knowledge base built with individual historical drivingdata, and speed profile prediction neural networks, RSPPNN.The ITMR system was fully implemented and evaluated usingreal driving data recorded by probe vehicles. The performanceof the ITMR system shows that the proposed method canpredict speed profiles on any ramps precisely and outperformsthe baseline that does not use the knowledge base built withthe historical individual driving data. Currently we areworking on understanding the effect of different NNarchitectures and individual driving behavior by analyzingindividual driving data to improve the performance further.PredictionMAE withoutKB(mph)4.3263Ramp1Ramp3#4PredictionMAE withKB(mph)3.6903Ramp10Ramp14#3Used rampsfor TrainingRamp6V.Freeway Enterin Ramp Experiment Result60TruthPrediction of ITMR55Speed (mph)TABLE II.Ramp1The example of speed profile prediction on freeway exitramps by the ITMR system is presented in Fig. 13. The speedprofile is predicted on I-94E to Ann Arbor Saline Rd. in AnnArbor, Michigan, U.S.A. The true recorded speed profile issuperimposed with red color in the same figure. In thisexample, the MAE of the proposed ITMR system is 3.5079mph. The overall performance of the proposed ITMR systemon freeway exit ramps is presented in TABLE IV. A total of13 different freeway exit ramps are evaluated using 276 realdriving recorded trips. The average performance of ITMR onfreeway exit ramp is 8.3619 mph which is a 4.54%improvement over the system that does not used KB for speedprofile prediction.4520Prediction MAEUsed rampsPredictionwithout KBfor Training MAE with 025INTER RAMP EXPERIEMT RESULTS5045403530250102030Travelling Points Sequence40Fig. 13. An example of speed profile prediction on the freeway exit ramp.973
TABLE IV.RampCategoryFREEWAY EXIT RAMP EXPERIEMT RESULTSTestingRampsUsed rampsfor 96.94134.979618.4676#9#10#11Ramp11Ramp9Prediction MAEwith KB(mph)Ramp11Prediction MAEwithout KB(mph)[3]16.8127[4][5]Georgia-Evangelia Katsargyri, Ilya V. Kolmanovsky and JohnMichelini, Optimally Controlling Hybrid Electric Vehicles using PathForecasting, 2009 American Control Conference, Hyatt RegencyRiverfront, St. Louis, MO, USA, June 10-12, 2009.[8] K. Bauer and W. Douglas, “Statistical models of accidents oninterchange ramps and speed-change lanes.” No. FHWA-RD-97-106,1998.[9] B. Huang, Z. Wang, J. Lu and L. Lu, “Modeling Speed Profile onFreeway Exit Ramps using Support Vector Regression”, The 12th COTAInternational Conference of Transportation Professionals (CICTP 2012),Beijing, China, August 2012.[10] H. Payne, “Models of freeway traffic and control.” In: MathematicalModels of Public Systems,(G.A. Bekey, ed.), vol. 1, no. 1 of SimulationCouncil Proceedings Series, pp. 51-61, La Jolia, California, 1971.[11] I. Prigogine and F. C. Andrews, “A B
driver by providing useful predictive traffic information using combined traffic information [1]. Trip modeling for speed profile is to predict a spatial distribution of traveling speed along a route. In ATIS the accurately predicted traffic information can be used to reduce the uncertainty of the future traffic states, improve traffic