Transcription
The Distributional Consequences of Trade: Evidencefrom the Repeal of the Corn Laws Stephan Heblich†University of TorontoStephen J. Redding‡Princeton University, NBER and CEPRYanos Zylberberg§University of BristolFebruary 25, 2021AbstractWe provide new theory and evidence on the distributional consequences of trade using the 1846 Repeal of theCorn Laws. This large-scale trade liberalization opened domestic markets to the “grain invasion” from the new worldthat occurred as a result of late-19th century improvements in transport technology. We make use of a newly-created,spatially-disaggregated dataset on population, employment by sector, rateable values (land and property values), andpoor law (welfare transfers) disbursement for around 11,000 parishes in England and Wales from 1801–1911. Weshow that the repeal of the Corn Laws led to rural outmigration, increased urbanization, structural transformationaway from agriculture, increases in rural poverty, and sizable changes in property values. We show that a quantitativespatial model is successful in accounting for these empirical findings, with our estimates implying substantial labormobility. We find that the aggregate welfare gains from the Repeal of the Corn Laws entailed considerable incomeredistribution, not only across sectors and factors, but also across geographical regions.KEYWORDS: trade, income distribution, geographyJEL CLASSIFICATION: F14, F16, F66 We are grateful to Princeton University, the University of Bristol and the University of Toronto for research support. We would to thankconference and seminar participants at American Economic Association (AEA), London School of Economics, Princeton, Toronto, Urban EconomicsAssociation (UEA), Conference on Urban and Regional Economics (CURE), and UC Davis. We also would like to thank Leigh Shaw-Taylor and theCambridge Group for the History of Population and Social Structure, the British Library and Paul Sharp for generously sharing data. Thank youalso to Bobray Bordelon for his help with the historical data and T. Wangyal Shawa for his help with the GIS data. We are also grateful to MateusFerraz Dias, Stephanie Hu, Maximilian Schwarz, Gordon Yi and Yinou Zhang for excellent research assistance. The usual disclaimer applies.† Munk School of Global Affairs & Public Policy and Dept. of Economics, 1 Devonshire Place, Toronto, ON, M5S 3K7, Canada. Tel: 1 416 9468935. Email: stephan.heblich@utoronto.ca.‡ Dept. Economics and SPIA, JRR Building, Princeton, NJ 08544. Tel: 1 609 258 4016. Email: reddings@princeton.edu.§ The Priory Road Complex, 12 Priory Road, BS8 1TU Bristol. Tel: 1 609 258 4016. Email: yanos.zylberberg@bristol.ac.uk.1
1Introduction“A great and hazardous experiment is about to be made, novel in its character, and without the supportof experience to guide or direct it, embracing and extending over unbounded interests, and pregnantwith results that may prove fatal in their consequences.” (John Gladstone, Plain Facts Connected with theIntended Repeal of the Corn Laws, 1846, page 30.)One of the classic insights in international economics is that trade creates winners and losers. While research hastraditionally focused on the effects of trade on the distribution of income across factors and sectors, more recent workhas highlighted the uneven geographical incidence of trade shocks. In this paper, we provide new theory and evidenceon the distributional consequences of trade using one of the most influential trade shocks in history following the1846 Repeal of the Corn Laws.1 This major trade policy reform opened British markets to international competitionfrom the large-scale “grain invasion” from the new world that occurred in the second half of the 19th century as aresult of improvements in inland and maritime transportation technologies. The key idea behind our approach isthat local labor markets in Britain were unevenly affected by this trade shock, depending on the extent to whichthey were suitable for arable (primarily grain) farming versus pastoral (primarily sheep and cattle) farming. Usingquasi-experimental empirical techniques, we first show that this trade shock led to a population redistribution fromrural to urban areas, structural transformation away from agriculture, and a substantial change in the relative valuesof land and buildings. We next use these reduced-form moments to structurally estimate a quantitative model of thespatial distribution of economic activity across locations and sectors. We show that this estimated model is successfulin accounting for the observed patterns in the data. We use it to quantify both the aggregate welfare effects from theRepeal of the Corn Laws and the distributional consequences across factors, sectors and regions.We make use of a newly-created, spatially-disaggregated dataset on population, employment by sector, rateablevalues (land and property value), and poor law (welfare transfers) disbursement for around 11,000 parishes in Englandand Wales from 1801–1911. There are a number of advantages to this empirical setting. First, the Repeal of the CornLaws and the opening of British markets to the “grain invasion” provides a large-scale international trade shock.Second, we have data at a fine level of spatial disaggregation over a long historical time period of a century to examinethe effects of this trade shock. Third, we are able to measure regional exposure to this trade shock using exogenousagro-climatic measures of the suitability of these regions for wheat cultivation. Fourth, we have detailed data on arange of economic outcomes, which enables us to examine the distributional consequences of the trade shock acrossfactors, sectors and locations. Fifth, 19th-century England and Wales had a largely laissez-faire economy, and henceprovide a setting in which we would expect the market-based mechanisms in the model to apply.Our paper relates to a number of strands of existing research. First, we contribute to the recent reduced-formempirical literature on the local labor market effects of international trade shocks, including Topalova (2010), Autor,Dorn, and Hanson (2013), Kovak (2013), Autor, Dorn, Hanson, and Song (2014), Pierce and Schott (2016), Kovak andDix-Carneiro (2015), Costa, Garred, and Pessoa (2016), Kim and Vogel (2018), as reviewed in Autor, Dorn, and Hanson(2016). Most of this existing evidence on the local labor market effects of these trade shocks comes from a limitednumber of recent episodes, including in particular the China shock. In contrast, we provide evidence from another1 Throughout the paper, we use the word “corn” according to the historical British usage of all cereal grains, including wheat, oats, barley andrye, and not restricted to maize. Of all these cereal grains, wheat was by far the most important in the British market.2
of the most influential trade shocks in history, which enables us to assess the generalizability of existing findings,and to explore similarities and differences. An advantage of our empirical setting is that we have an exogenousmeasure of the exposure to this trade shock, based on the agroclimatic suitability of locations for wheat cultivation.Whereas existing studies typically focus on overall levels of economic activity, we explore the role of this trade shockin propelling structural transformation across sectors and a reallocation of economic activity from rural to urbanareas.Our paper is also related to a recent body of research on quantitative spatial models, including Redding and Sturm(2008), Allen and Arkolakis (2014), Ahlfeldt, Redding, Sturm, and Wolf (2015), Redding (2016), Allen, Arkolakis, andLi (2017), Caliendo, Parro, Rossi-Hansberg, and Sarte (2018), Desmet, Nagy, and Rossi-Hansberg (2018), Fajgelbaumand Redding (2018), Galle, Rodríguez-Clare, and Yi (2018), Monte (2018), Monte, Redding, and Rossi-Hansberg (2018),Caliendo, Dvorkin, and Parro (2019) and Adão, Arkolakis, and Esposito (2019), as reviewed in Redding and RossiHansberg (2017). While most of this literature is concerned with the spatial distribution of overall economic activityacross locations, a key focus of our research is the role of the trade shock from the Repeal of the Corn Laws inexplaining urbanization across locations and structural transformation across sectors, and the resulting implicationsfor the distribution of income across factors, sectors and regions.Third, our paper is related to a large economic history literature on the Repeal of the Corn Laws and the “graininvasion” from the new world, including Graham (1892), Nicholson (1904), Lord Ernle (1912), Barnes (1930), Olson andHarris (1959), O’Rourke, Taylor, and Williamson (1996), Howe (1998), Schonhardt-Bailey (2006), Sharp and Weisdorf(2013), Williamson (1990), O’Rourke (1997), Taylor (1999), Sharp (2009), O’Rourke and Williamson (2001), Chepelievand Irwin (2020) and Cannadine (2019). Most of this historical research has focused on the implications of this tradeshock for the distribution of income across factors (labor and the urban proletariat versus land and the rural aristocracy) and sectors (agriculture versus manufacturing and services). In contrast, our research emphasizes the unevengeographical incidence of this trade shock, and the close connection between the redistribution of population betweenrural and urban areas and the structural transformation of employment across sectors. Whereas most of this historical research is either qualitative or uses reduced-form empirical methods, we examine the ability of a spatial generalequilibrium model to account quantitatively for the patterns in the data.The remainder of the paper is structured as follows. Section 2 introduces the historical background to the Repealof the Corn Laws and the “grain invasion.” Section 3 summarizes the data sources and definitions. Section 4 presentsreduced-form evidence on the impact of this trade shock on the distribution of economic activity across sectors andregions. Section 5 develops the spatial general equilibrium model that we use to interpret these reduced-form empiricalfindings. Section 6 provides evidence on that the model is successful in accounting quantitatively for the observeddata. Section 7 summarizes our conclusions.2Historical BackgroundThe origins of the Corn Laws date back to medieval times, as part of a broader system of regulations to control theprice of bread, as the main source of sustenance for the local population.2 After the repeal of an outdated law of 1463,there was no statutory restriction on the import of wheat until the Corn Law of 1660, which specified domestic price2 Forhistorical discussions of the Corn Laws, see Nicholson (1904), Lord Ernle (1912), Barnes (1930), Fay (1932), and Sharp (2009).3
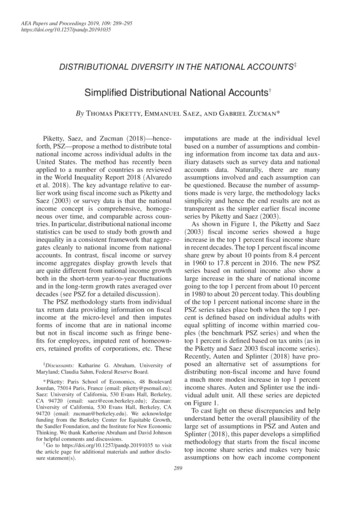
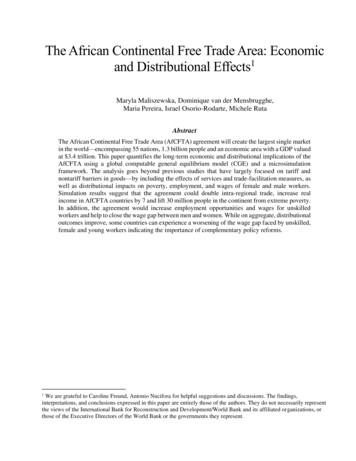
bands within which different levels of import duties would apply. From 1670 until 1815, the basic format of the lawstayed the same, and specified a small "nominal" duty payable when the domestic price was high, as well as a “pivotlevel” for the domestic price below which larger duties would be payable. In the first half of the 18th century, Britainremained largely self-sufficient in grain, and the import duties were suspended in times of scarcity, which limited theirpractical impact on the domestic price of wheat. However, with the onset of the industrial revolution in the 1760sand rapid population growth, the Corn Laws became of increasing relevance, as Britain developed into a growing netimporter of wheat, with Prussia and Russia the traditional sources of supply.In the aftermath of French Revolution, Britain and France were almost continuously at war during the FrenchRevolutionary and Napoleonic Wars from 1792–1815. This widespread conflict in Europe and the inauguration ofNapoleon’s continental blockage restricted Britain’s access to wheat imports from continental European countriesand led to a large rise in the domestic price of wheat.3 In Panel (a) of Figure 1, we display the mean price of wheatat Eton in England from 1646–1991. As shown by the horizontal red lines in the figure, the mean price from 1792–1815 is around double that before 1792. In response to these higher prices, marginally-productive agricultural landwas brought into wheat cultivation, often involving substantial investments in land enclosure and the constructionof buildings and machinery. In the aftermath of victory in 1815, the British Tory (Conservative) government of LordLiverpool became concerned about the potential for an influx of cheap imported grains and a domestic agriculturalcrisis. The potential for such an agricultural crisis was of particular concern to the government, because of continuinginternational uncertainty about access to imports in the immediate aftermath of war, and fears of rural political unrestat a time when radical ideas had continued to circulate since the French Revolution.46040020Ad Valorem Tariff (Percent)4312Price (Pounds)5806Figure 1: Price and Ad valorem Tariff on 18501900Year(a) Annual Price of Wheat (Pounds).(b) Ad Valorem Tariff.Panel (a): Average price of wheat in pounds sterling per imperial quarter at Eton from 1646–1911; vertical black lines show 1792 (French Revolution),1815 (end of French Revolutionary and Napoleonic Wars), 1846 (repeal of the Corn Laws), and 1865 (end of the American Civil War); horizontalred lines show average prices in between these years; Source: Lord Ernle (1912); Panel (b) Ad valorem tariff on wheat from Sharp (2009).To prevent a collapse in the domestic price of wheat, Lord Liverpool’s government passed the Corn Law of 1815,which involved a major increase in levels of protection. In particular, this law prohibited wheat imports when prices3 See in particular Galpin (1925).For an analysis of the impact of the continental blockade on industrial development in France, see Juhász (2018).4 In response to such fears of political unrest, the British government introduced a number of restrictions on individual liberty during the FrenchRevolutionary and Napoleonic Wars (see for example Cannadine 2019). Episodes of political unrest in early-19th century Britain included Luddismfrom 1811–12, as well as the “Captain Swing” disturbances of 1830, as examined in Caprettini and Voth (2020).4
were under 82.5 shillings per quarter, and admitted wheat free of duty above this level. As a result, with a fewexceptions of some months during the years 1816–19, British ports were closed to imports of wheat until 1825. Themain beneficiaries from this increased protection were rural landowners (primarily the aristocracy who were thetraditional sources of support for the Tory party) through the price of land. By contrast, the main groups harmedby increased protection were workers (through a higher cost of living) and manufacturers and merchants (through areduction in the volume of trade and upward pressure on wages to offset the higher cost of living).5 In response topolitical pressure from these opponents, the provisions of this 1815 act were eventually weakened, at first throughtemporary acts in 1825, 1826 and 1827, which allowed some wheat to be released from bond warehouses, and laterthrough the Duke of Wellington’s 1828 act, which permanently replaced import prohibition with a sliding scale ofimport duties. Nevertheless, the domestic price of wheat during 1815–46 remained around 50 percent higher thanbefore 1792 (as shown in Panel (a) of Figure 1), and the estimated average ad valorem equivalent of the Corn Lawsover the period 1829–46 was around 30 percent according to Sharp (2009) (as shown in Panel (b) of Figure 1).In the early 1830s, domestic harvests were plentiful and hence domestic prices remained relatively low, whichensured that discussion of the Corn Laws remained muted. In contrast, from 1837 onwards, poor domestic harvestsled to a rise in the domestic price of wheat, and an increase in political protest against the Corn Laws. Supportedby the growing constituency of manufacturers, and influenced by the intellectual case for free trade as espoused inRicardo (1817), the Anti-Corn Law League developed into an influential nationwide movement led by Richard Cobdenand John Bight from 1838 onwards. Around the same time, the economic recession of 1838 was the stimulus forthe formation of the Chartist Movement, which campaigned for greater democratic representation of the interests ofworking people. In response to this growing discontent, the Tory Prime Minister Robert Peel attempted an initial setof reforms of the Corn Laws in 1842, which reduced the level of import duties. Following continuing failed harvests inEurope during the 1840s (sometimes referred to as the “Hungry Forties”), and with the beginning of the Irish PotatoFamine in 1845, political pressure for further reform intensified. Finally, after thirty nights of heated parliamentarydebate, and in a move that split his own Tory party and arguably kept it out of government for a generation, RobertPeel passed legislation repealing (abolishing) the Corn Laws in 1846.6This repeal legislation specified a gradual reduction in import duties, which contributed towards the progressivereduction in the domestic price of wheat shown in Panel (a) of Figure 1.7 Repeal also opened British markets to theexternal trade shock that occurred in the late-19th century as a result of improvements in transport technology. Withincreases in the speed, reliability and capacity of steam ships, international freight rates across the North Atlanticfell by around 1.5 percent per annum from around 1840 onwards, with a cumulative decline of around 70 percentpoints from 1840–1914 (see North 1958, Harley 1988 and Pascali 2017). Following the end of the American CivilWar in 1865, the U.S. railroad network rapidly expanded into the interior, with the first transcontinental railroadcompleted in 1869. These reductions in internal transport costs opened up the grain-growing regions of the mid-Westto international markets (see Fogel 1964 and Donaldson and Hornbeck 2016). Subsequent late-19th century expansions5 See for example Rogowski (1987). Land ownership in the mid-19th century was highly concentrated in the hands of the aristocracy, witharound 80 percent of all land in Great Britain held by estates consisting of more than 1,000 acres as late as 1876 (Cannadine 1990).6 Although this repeal is frequently interpreted as a political concession by an existing elite to forestall greater political change, a growinghistorical literature argues that Peel’s decision was influenced by a threefold combination of political interests, ideologies and ideas, including inparticular Irwin (1989) and Schonhardt-Bailey (1995).7 Following repeal, import duties were gradually reduced to 1 shilling per quarter over a three-year period until 1 February 1849. This remainingnominal duty was ultimately removed in 1869.5
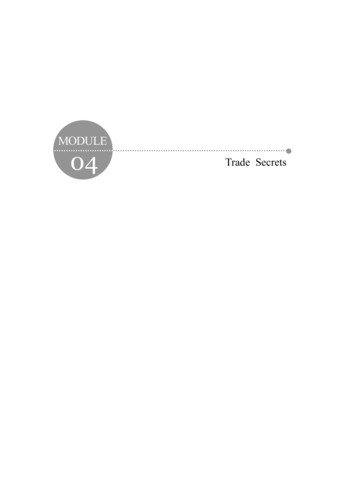
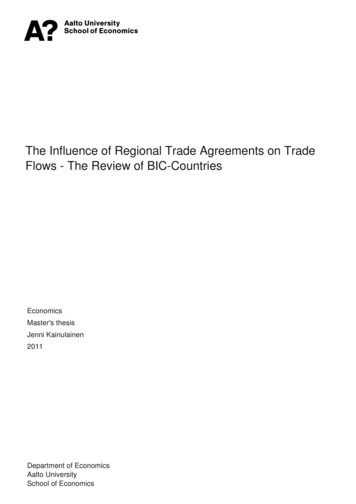
in the railroad network in Argentina and Canada made accessible their grain-growing interior regions (see Adelman1994 and Fajgelbaum and Redding 2018). As a result, there was an influx of cheap new-world grain into Europeanmarkets, referred to by O’Rourke (1997) as the “grain invasion,” and an associated convergence in world grain prices(see Offer 1991 and O’Rourke and Williamson 2001). In contrast to a number of continental European countries, whichresponded to this fall in the price of wheat with increased protection, a legacy of the campaign over the Repeal of theCorn Laws in Britain was a political consensus for free trade, which ensured that British markets remained open tothis grain invasion in the closing decades of the 19th century.8In Figure 2, we display UK consumption, production and imports of wheat over time (quantities in millions ofquarters), where consumption equals the sum of domestic production and imports. In 1831 and 1841 before the repealof the Corn Laws, UK imports were small in magnitude, and largely originated from traditional sources of supply inEurope. Following the repeal of the Corn Laws in 1846, we observe a progressive increase in UK imports of wheat,which accelerates after the end of the American Civil War in 1865, as the American Mid-West and other New Worldproducers become increasingly integrated into international markets. In the closing decades of our sample, Argentina,Australia, Canada, India and the United States all emerge as major new world sources of supply for wheat. In theaftermath of this grain invasion and the associated decline in the domestic price of wheat (as shown in Panel (a) ofFigure 1), we observe a continuing decline in UK production of wheat until 1901, after which there is a small recoveryin both the domestic price of wheat and domestic production of wheat.30ROW30Figure 2: UK Consumption, Production and Imports of Wheat CAN1520ROW5RUS1010ROWWheat Production (line)2525US5Wheat Consumption (bar)ARGUKUKUKUKUKUKUK0UK0UK1831 1841 1851 1861 1871 1881 1891 1901 1911YearNotes: UK consumption, production and imports of wheat (quantities) in millions of quarters; consumption is the sum of domestic production andimports; imports from different source countries indicated by the gray shading and white letters: ARG (Argentina); AUS (Australia); CAN (Canada),IND (India), ROW (Rest of World), RUS (Russia), and US (United States); Source: Sharp (2009).This “grain invasion” from the new world, and the consequent fall in domestic prices and production of wheat, ledto what is referred to as the “great agricultural depression” in Britain from 1870 onwards. Land rental values fell in8 Forfurther discussion of this legacy of the campaign over the Repeal of the Corn Laws, see Trentmann (2008).6
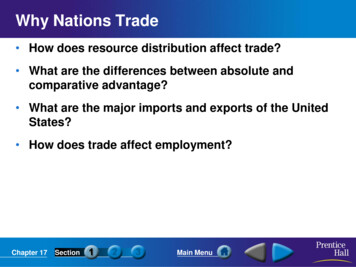
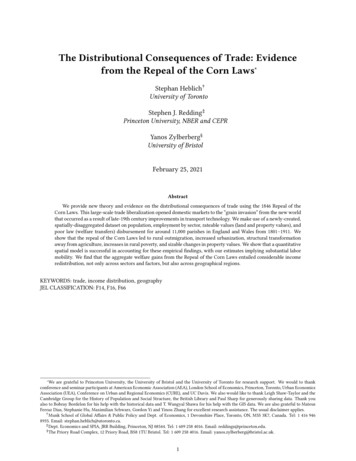
the early 1820s real rents are 90 per cent of their level in the 1860s.8. Rent versus wagesClark (1999b, 2001) calculates the day wages of agricultural labourers outin the intervalto 1869.Usingnominal terms after 1870, as shown in Figure 4(a).sideWithharvestfalling agriculturalprices1500and risingwagesas atheseresultwages,of the and the wagesfor 1870-1912 calculated by A. Wilson Fox and Arthur Bowley, Table 7productivity gains from the industrial revolution, landrentalfellwintereven morerelativeto wagesthanfromthey didinshowsthe valuesnominalwageof farmworkers1500-1912and theimplied realwage measuredin bankruptterms oforfarmoutput.nominal terms, as indicated in Figure 4(b). Large numbersof farmerseither wentswitchedfrom arableFigure 8 shows the implied ratio of rents to farm wages from 1500 to 1912to pastoral farming (as discussed in Perry 1972). Arableland shrankover theperiodfrom 1871–1901by 29 fixedpercentfor Englandas a wholebasedon Table7, with 1860-9at 100. As canbe seen pasturethe factordistributionof incomeswitchesin favour of landfrom 8.2 to 5.9 million acres, while the area of permanentexperienceda 36 percentincreasefromsharply11.4 to 15.4in the first decade of the seventeenth century, when land rents relative tomillion acres (Lord Ernle 1912). Rural depopulationbecamesourceof contemporary(Longstaff1893) andwagesmore athantriple.Thereafter thedebateratio isfairly constantat about70 percent of the level of 1860-9 until the 1750s when it begins to rise, reaching athe subject of an official government report (Board of Agriculture and Fisheries 1906). As income from land land fellpeak of 106 in 1820s, before declining in the nineteenth century to beeventuallyless thanlandowners60 per centof theratio orof break1860-9.relative to mortgage debt and other encumbrances,many aristocraticchoseto divestup Thustheir we see in thelifetime of David Ricardo, 1772 to 1823, the rise in real rents relative togreat estates, contributing to the decline and fall ofwagesthe Britisharistocracy: “Across the whole of the British Isles, theas population advances that his famous theory of the 'stationary state'upon. However,about thetimeof Ricardo'sdeath in 1823 this cenchange between the late 1870s and the late 1930s dependswas remarkable,as five hundredyearsof patricianlandownershipturies-long progression halted, and the ratio of rent to wages in agriculturehad effectively been halted and reversed in seventy”(Cannadine1990,111).declined rapidly after the 1860s. It is tempting tofirststabilised,andp.thenattribute the rise and decline in the rent/wage ratio in the eighteenth andFigure 3:inUKLand RentalValuesand LandcenturiesRentalRelativeWages.The agrarian economyEnglandand Wales, 1500-1914299 Valuesnineteenthto thetwin toforcesof the Corn Laws of 1696 to 1846(a) Land Rental Values.(b) LandRental relativeValues / Wages.Figure 8. Land rentalvaluesto wages, 1500-1912.Figure 4. Charity rental values, 1690-1912 versus alternative estimates.Source : Table 7.Notes: Theassessmentthe price1690spoundshas beencorrectedforPanel(a):LandLandTaxrentalvalues in forcurrentsterling,whichare the weighted average of land rental values for individual properties inundervaluationrental landincomesthe landreturnsin Turner,accordancewithClarkGreat BeckettandAftonland rental values from Turner, Beckett, and Afton (1997);ArthurYoung'sYoung landrental valuesTurner,Beckett,and Afton(1997);andtax ,BeckettandAfton(1997). from Stamp (1920); Panel (b): Land rental valuesrelative to wages from Clark (2002).Sources : Turner, Beckett and Afton (1997, pp. 163-4, 314-318)- Stamp (1920,PP- 49 y 54-5)-3This content downloaded from 128.112.70.44 on Mon, 23 Mar 2020 11:35:20 UTCAll use subject to https://about.jstor.org/termsDatavaluations for 1806-1814 are 22 Per cent lower than the charity valuations.Elsewhere I argue that there is good evidence that these early tax returnsWe construct a new spatially-disaggregated dataset on population, employment by sector, rateable values (land andsystematically under-assessed land and housing (Clark 2002a).The charityrentalseriesalso consistentwith thepropertyvalue),valueand poorlawispayments(welfare transfers)forTurner,England Beckettand Wales from 1801–1911. Our main sourceand Afton series for the years after i860. Though the average estimated rentof data is the population census, which we augment with a number of other sources of data, as summarized below,for England based on charity land is 12 per cent higher than the averagerents on andthediscussedlarge estatesTurner,lookAppendix.at, the series movein furtherdetail Beckettin SectionandB ofAftonthe onlinein harmony. But the earlier we go before i860 the more the series diverge,until finally when we get back to 1690-9 the charity rents exceed those ofSpatialDataare availableat threeandmainTurnerlevels of etspatialaggregation:parishes (11,448), poor law unions (575)Turner etal. byUnits:254 percent.Clark (i998d)al. (1998)debatewhich of these series is more plausible. The charity series is much more conand counties (53). Parishes were historically the lowest level of local government in England and Wales, responsiblesistent with the Land Tax assessments of 1693. The land tax collected outfor towns,the provisionof aitvarietyof fallpublicoverwhelminglygoods, including poor(welfarepayments) since the Poor Law Act of 1601.side majorwherewouldon relieffarmproperty,implies a rental value of 0.55 per acre in 1693, which is higher even thanParish boundaries are relatively stable throughout most of the 19th century, but experience substantial changes afterthe charity-based average rental of 0.45 in these years.5 This differentialbetween the tax based assessment and the charity series however is not thatmuch greater than what is observed post-1840.The land rent estimates here are also much closer to the contemporaryestimates of Arthur Young in 1770 and the 1790s than the Turner, Beckett75 Gregory King estimates average land rents per acre in 1696 at only 0.37, but the
1911. For this reason, and to abstract from the First World War, we end our sample in 1911.9 We construct constantparish boundary data every census decade from 1801–1911 using the classification provided by Shaw-Taylor, Davies,Kitson, Newton, Satchell, and Wrigley (2010), as discussed further in Section B1.2 of the online Appendix.Following the Poor Law Amendment Act of 1834, these parishes were grouped into poor law unions, which becamean intermediate tier of local government, responsible for the administration of poor relief for the parishes within theirboundaries. These poor law unions correspond closely to registration districts in the population census and we usethese two terms interchangeably. Both parishes and poor law unions aggregate to counties (e.g., Warwickshire),which were historically the upper tier of local government in England and Wales, responsible for the administrationof justice, taxes, and parliamentary representation. Parishes have an average area of 13 kilometers squared and 1851population of 1,590, which compares to an average area of 262 kilometers squared and 1851 population of 26,401 forpoor law unions, and an average area of 2,553 kilometers squared and 1851 population of 404,262 for counties.We focus on parishes as our baseline unit of analysis for two main reasons. First, poor law unions typicallyaggregate neighboring rural and urban parishes together, whereas we are precisely concerned with the reallocation ofeconomic activity from rural to urban areas. Second, parishes allow us to measure variation in agroclimatic conditionsat a much finer level of spatial detail, taking into account local differences in soil conditions and topography, whereasPoor Law Unions average out this variation. In some of our empirical analysis, we distinguish between rural and urbanparishes, where we define using two groups using K-means clustering based on population density at the beginningof our sample in 1801, as discussed further in Section B4 of the online Appendix.Parish Population: We construct population data from the parish-level records of the population census of Englandand Wales,
has highlighted the uneven geographical incidence of trade shocks. In this paper, we provide new theory and evidence on the distributional consequences of trade using one of the most in uential trade shocks in history following the 1846 Repeal of the Corn Laws.1 This major trade policy reform opened British markets to international competition