Transcription
Raafat, Feraidoon and Grudnitski, GaryA Case Analysis on Productivity Improvement: Reducing Operating Costs by Increasing Efficiency at a Flora CompanyA Case Analysis on Productivity Improvement:Reducing Operating Costs by Increasing Efficiency ata Flora CompanyFeraidoon Raafat*College of Business Administration, San Diego State University, San DiegoGary GrudnitskiCollege of Business Administration, San Diego State University, San DiegoThis paper discusses issues and their resolutions with regard to operational planning andprocedures in one of the most labor intensive businesses in California, namely that of cut flowermanufacturing. Issues of productivity improvements, packaging and layouts are addressed. Aspreadsheet template is developed for improving planning and scheduling.* Corresponding Author. E-mail address: Fred.Raafat@sdsu.eduI. INTRODUCTIONA California company, which we willcall Coastal Flora (CF), was established in1973 and has become a leading grower,supplier, and distributor of fresh cut flowers inthe Western United States. CF’s majorprocessing facility is located in northern SanDiego County and ships to customers inSouthern California, Arizona, Utah andNevada. CF’s customers are mainly largechain stores such as Albertsons, Costco,Kroger, and Trader Joe’s who only remaincompetitive in their markets by keeping theirprices low. This demand for low prices hasforced CF to reduce operating costs, andbecause the production process at CF is laborintensive, management constantly seeks waysto streamline processes and improveefficiencies in its production facility. The cutflower industry has an annual impact of 10billion and 780 million on the economy ofthe State and San Diego County, respectively.California accounts for 77 percent of the UStotal of cut flowers with more than 320million (wholesale value) annually, to florists,supermarkets as well as to numerous kiosksand outlets. Moreover, the floral bouquetmanufacturing process is very labor intensive– in San Diego County wholesalers and retailflorists contribute directly to the creation ofover 7,000 jobs (Chambers, 2009; Carman,2010, Commodity Fact Sheet, 2012).II. PROJECT OBJECTIVES ANDMETHODOLOGYCF’s facility in San Diego Countycurrently employs over 300 employees toreceive and store raw materials, manufacturebouquets and floral arrangements, as well asprovide other support and administrationfunctions. Typically, tables are setup beforethe start of the actual production. During theset up time, the production requirements andthe bouquet bill of materials are placed oneach table. Based on the requirements, runnersplace the raw materials (e.g., flowers, fillers,flower food, wraps) on the tables and thenreplenish them throughout the day as needed.Bouquets are manufactured using differenttechniques based on the number of the stemsin each bouquet. Some are individuallyassembled, others are put together by anassembly line, and yet a few others use somecombination of the two techniques. TheJournal of Supply Chain and Operations Management, Volume 10, Number 2, September 201294
Raafat, Feraidoon and Grudnitski, GaryA Case Analysis on Productivity Improvement: Reducing Operating Costs by Increasing Efficiency at a Flora Companyassemblers pick the stems based on a bill ofmaterials, prepare the bouquet, cut the stems tothe desired length, use rubber bands to tie thestems, wrap the bouquet, place the flower foodon the stems of the bouquet, and then place itin a bucket. When a bucket is full, it is sent tothe packaging department where the bouquetsare prepared for final shipment to thecustomer.To improve CF’s operations anddetermine where production processes canoperate more efficiently and reduce laborexpenditures as a percentage of sales theproject was divided into the following fourareas:1.2.3.4.Identifying improvements and balanceworkbetweenproductionandpackaging areasCreating a standardized flower assemblyprocess for each order typeEliminating process waste in theproduction areaImproving the inventory in the productionarea2.1 Line Balancing – Methodology, Resultsand AnalysisThe data collected by CF was analyzedto identify reasons for the bottleneck in thepackaging area. The analysis began bycalculating the average number of boxesproduced per hour per table. The packagingworkers were then observed to determine theaverage number of boxes packaged per hourby each worker. When the number of boxesproduced is greater than the packagingcapacity a backup occurs; if the number ofboxes produced is less than the packagingcapacity there will be underutilization ofpackaging labor. Both situations result in anincrease in labor costs per box packaged.Based on analyses of the production data andthe observations of the number of boxespacked per hour in the packaging department,it was discovered that the production area wasproducing buckets faster than the packagingdepartment could pack. Table 1 is an exampleof boxes produced and packaged during eightfull production days in October. The averageboxes packed per hour were approximately125 boxes per person.Table 1 - Boxes Produced vs. Boxes PackedFull Production DateTotal Number of BoxesProducedTotal Number of 9To balance the line, the existingproduction data was used to develop acustomized forecasting tool; Appendix Ashows a screen shot of the tool. This tool helpsCF plan daily production by table and forecastpotential backups in the packaging departmentby hour based on the orders being produced.The inputs for the tool are the table name,product name, number of bouquets in theorder, number of bouquets packed per box andnumber of workers packing boxes. The tooluses CF’s data to schedule productionthroughout the day and then compute thenumber of boxes that will be produced perhour based on the planned productionschedule. If needed, CF can add workers to thepackaging department to eliminate bottlenecksor remove workers to eliminate the underutilization of the packaging workers.At the time of study, CF wasexperiencing substantial overtime costs in thepackaging department. Because the tableswere producing more boxes than theJournal of Supply Chain and Operations Management, Volume 10, Number 2, September 201295
Raafat, Feraidoon and Grudnitski, GaryA Case Analysis on Productivity Improvement: Reducing Operating Costs by Increasing Efficiency at a Flora Companypackaging department could handle, thepackaging workers were staying late to finishpacking the orders. By using the forecastingtool, CF was able to balance the work betweenpackaging and production departments. Thisbalance was estimated to save approximately 66,000 in annual overtime costs in thepackaging department (this assumes nineproduction workers, at 14.00 per hour, 1.75hours of overtime, 300 days per year). Thisapproach was also more practical than themodel developed by Caixeat-Filho et al.(2002), who developed a linear programmingmodel for revenue enhancement in productionof lily flowers. Other and more complexmodels with applications in agriculture can befound in the extensive work by Valenzuela(2008). Zhang and Wilhelm (2011) provide acomprehensive review of decision supportmodels for nursery and floriculture cropsalong with other agricultural products.2.2 Standardization - Methodology, Resultsand AnalysisCF’s data for the months of Septemberand October were evaluated to find the mostefficient production table. To keep the dataconsistent, CF assigned the employees to aproduction table where they worked every dayduring this time period. Based on the data, theaverage number of stems assembled per hourby the different tables for each of the threestem count categories were calculated: stemcount under 10, stem count between 10 and19, and stem count more than 20. Table 2shows the average stems per hour by eachproduction table. Appendix B shows the rawproductivity data used to calculate thisinformation.Table 2 Average Stems per Hour by TableTable ritasOrquidiasPomponsSafari SunsetStargazerStem Count morethan 476.99532.66425.79A one-way ANOVA analysis wasconducted to determine if there was adifference in the means of the average stemcount for each table, as well as among thethree stem count categories. The resultssuggest that the means of the average stemsassembled per hour by the different tables arestatistically different. Furthermore, the meansof the average stems assembled per hour areStem Count between10 and 467.60560.75447.63Stem Countless than 317.99356.79290.77different among the three stem countcategories (see Appendix C for details).To reduce the difference in the mean ofthe average stem count within the same stemcount category, it is necessary to standardizethe bouquet manufacturing processes. As theTable 2 shows, when the bouquet has less than10 stems, the three fastest tables are SafariSunset, Dhalia and Daisy. For stem countsbetween 10 and 19, the three fastest tables areJournal of Supply Chain and Operations Management, Volume 10, Number 2, September 201296
Raafat, Feraidoon and Grudnitski, GaryA Case Analysis on Productivity Improvement: Reducing Operating Costs by Increasing Efficiency at a Flora CompanyDhalia, Safari Sunset and Lisianthus, and forstem counts of more than 20, the three fastesttables are Lisianthus, Safari Sunset and Dhalia(see Appendix D for the details).It could be assumed that tables areassemblingthebouquetsfasterbycompromising the quality. To ascertain ifproduction speed and the bouquet quality wererelated, a correlation analysis between thetable’s rate of bouquet assembly and itscorresponding quality issues was conducted.The most common quality issues were: rawmaterials being stacked too high on theproduction table; stems not cut to the desiredlength; incorrect location of the flower food onthe bouquet; incorrect location of the plasticsleeve; and the number of stems in the bouquetbeing different from the recipe. From thequality data collected by CF, the cumulativepercentage of quality defects by table wastabulated. Then the table ranking based on theaverage stems assembled per hour and theircorresponding quality defect percentages werecomputed for the following four differentscenarios:Scenario #1: Correlation analysis between theaverage stem produced per hour ranking forthe stem count category under 10 and noncompliance percentageScenario #2: Correlation analysis between theaverage stem produced per hour ranking forthe stem count category between 10-19 andnon-compliance percentagesScenario #3: Correlation analysis between theaverage stem produced per hour ranking forthe stem count category more than 20 and noncompliance percentagesScenario #4: Correlation analysis between theoverall average stem produced per hourranking and non-compliance percentagesThe results for the various scenariosare summarized in the Table 3 (see AppendixE for details).Table 3 Correlation AnalysisMultiple R SquareRScenario #10.0890.008Scenario #20.2240.050Scenario #30.1790.032Scenario #40.0640.004The results of the correlation analysisshowed a very low multiple R and R Square,which means that there is no statisticalcorrelation between the rate of production andthe quality of the bouquet produced for thesetables.The assembly techniques for the threemost efficient tables were used on randomproduction tables to determine the bestassembly technique for the different stemcount category, table set up and the number ofpeople at each table. Time samples wererecorded for each technique. The explanationsof the techniques are given below:Technique #1: To assemble the bouquet theworkers used an assembly line method. Allitems needed for bouquet assembly wereplaced in sequential order on the productiontable. The first worker gathered their portionof the bouquet and passed it to the next workeruntil the bouquet reached the second to the lastworker. The second to last worker in theassembly line completed the arrangement ofthe bouquet, cut the stems to the desiredlength, used rubber bands to tie the stems ofthe bouquet, and stacked the bouquets next tothe cutter. The worker at the end of theassembly line wrapped the bouquet in theprotective plastic sleeve, taped the flowerfood, and placed the finished bouquet in thebucket.Journal of Supply Chain and Operations Management, Volume 10, Number 2, September 201297
Raafat, Feraidoon and Grudnitski, GaryA Case Analysis on Productivity Improvement: Reducing Operating Costs by Increasing Efficiency at a Flora CompanyTechnique #2: All items needed for bouquetassembly were placed in sequential order onthe production table. Each worker, except onefinisher, was individually responsible forgathering all the flowers to make one bouquetat a time. The workers individually arrangedthe bouquet, cut the stems to the desiredlength, used rubber bands to tie the stems, andstacked the bouquets next to the cutter. Thefinisher wrapped the bouquet in the protectiveplastic sleeve, taped the flower food, andplaced the finished bouquet in the bucket.Technique #3: This technique was onlymeasured at a table on the side where there arefour workers. The workers were split intoteams of two. Each worker was individuallyresponsible for completely assembling onebouquet at a time. All of the workers arrangedtheir bouquet, cut the stems to the desiredlength, used rubber bands to tie the stems ofthe bouquet, wrapped the bouquet in theprotective plastic sleeve, taped the flowerfood, and placed the finished bouquet in thebucket.Technique #4: This technique was only usedat a table on the side where there were fourworkers. The workers were split into teams oftwo; one assembler and one finisher. Theassembler arranged the bouquet, cut the stemsto the desired length, and used rubber bands totie the stems of the bouquet. The finisherwrapped the bouquet, taped the flower food,and placed the finished bouquet in the bucket.Once the data sampling was complete,the average time it took the table to completedifferent bouquet sizes using differenttechniques was calculated. The averageassembly times were compared for eachbouquet size to determine the most efficientassembly method for each bouquet. When thestem count was more than 20, technique #1and #2 were compared as technique #3 and #4were not tested because of the limited tablespace. The average time for assemblingbouquets with stem counts greater than 20using technique #1 was 151 seconds. Theaverage time for assembling similar bouquetsusing technique #2 was only 114 seconds. Atwo-sample t test was conducted and it wasfound that the averages of the two techniquesare statistically different. This meansassembling one bouquet with 20 or more stemsusing technique #2 is statistically significantlyfaster than using technique #1 (see Appendix Ffor details).When bouquets with stem countsbetween 10 and 19 were produced, CF utilizedtwo different layouts. If a “combo box” wasbeing produced, the production table was splitand techniques #3 and #4 were used (a combobox is a box containing up to four differentbouquet variations). If a regular box was beingproduced, the table was set up by arranging allthe raw materials throughout the entire lengthof the table and techniques #1 and #2 wereused. All four techniques were tested onrandomly selected tables. Average times werecalculated for assembling a bouquet; it took 56and 46 seconds, respectively, for usingtechniques #1 and #2. A two-sample t test wasconducted and it was found that the averagesof the two techniques are statistically different.This means assembling one bouquet with astem count between 10 and 19 using technique#2 is faster than using technique #1 (seeAppendix F for details).Average times for assembling a combobox bouquet using techniques #3 and #4 forstem counts between 10 and 19 were 49 and48 seconds, respectively. A two-sample t testwas conducted and it was found that theaverages for the two techniques are notstatistically different. This means thatassembling one bouquet with a stem countbetween 10 and 19 using technique #3 is notfaster than using technique #4 and vice versa(see Appendix F for details).Techniques #3 and #4 were tested onrandomly selected tables that were assemblingJournal of Supply Chain and Operations Management, Volume 10, Number 2, September 201298
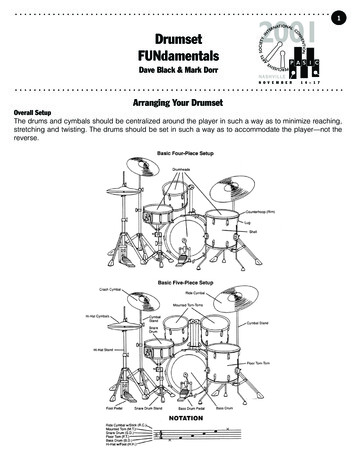
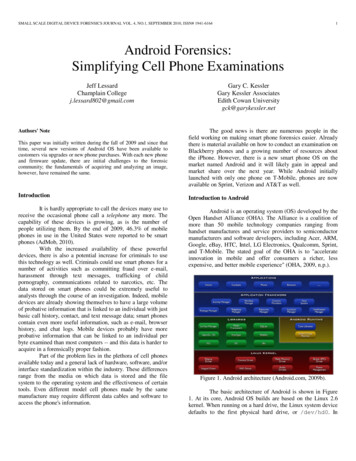
Raafat, Feraidoon and Grudnitski, GaryA Case Analysis on Productivity Improvement: Reducing Operating Costs by Increasing Efficiency at a Flora Companybouquets with stem counts less than 10.Techniques #1 and #2 were not tested becausethese techniques require the raw materials tobe arranged along the entire length of thetable. When the stem count is low this requiresthe workers to walk the entire length of thetable to make one bouquet and this walk is anon-value-added activity. The average timesfor assembling bouquets using technique #3were 39 seconds and 36 seconds usingtechnique #4. A two-sample t test wasconducted and it was found that the averagesfor the two techniques are not statisticallydifferent. This means that assembling onebouquet with a stem count of less than 10using technique #3 is not faster than usingtechnique #4 and vice versa (see Appendix Ffor details).When a regular box was produced allthe raw materials were arranged along thelength of the table, irrespective to the numberof stems in the bouquet. This type of tablesetup is the major reason for the low averagestems per hour when the stem count is lessthan 10. All of the production tables are thesame size. As the stem count of the bouquetsincreased the raw materials were stacked veryclose together because of the lack of space onthe table. When this occurs the assemblers donot need to move laterally to pick up theflowers. However, when the numbers of stemsin the bouquet were less, more space was leftbetween the stacks of raw materials on theproduction tables and the assemblers had tospend time moving laterally in order toassemble one bouquet. Figure 1 shows a tableset up for eight stems; and Figure 2 shows atable set up for production of a bouquet of 22stems. The recommended techniques for thedifferent stem categories are summarized inTable 4.Figure 1 - Table Set up for an 8 stem BouquetFigure 2 - Table Set up for a 22 stem BouquetTable 4 - Recommended Techniques for theStem Count CategoriesRecommendedStem CategoryTechniqueMore than 202Between10-19:Regular2Between10-19:Combo Box4Less than 104For stem counts of more than 20, it isrecommended that CF utilize technique #2.The reasons for the time differences betweentechniques #1 and #2 are wait time, flowerlocation, and hand size of the assemblers. Theproduction workers experienced wait timeswhile using technique #1. Some assemblersproduced the bouquets faster than others. Thefaster assemblers had to wait for the slowerassemblers to complete his or her share ofwork. The wait time was generally betweentwo and five seconds for each bouquet. WhenJournal of Supply Chain and Operations Management, Volume 10, Number 2, September 201299
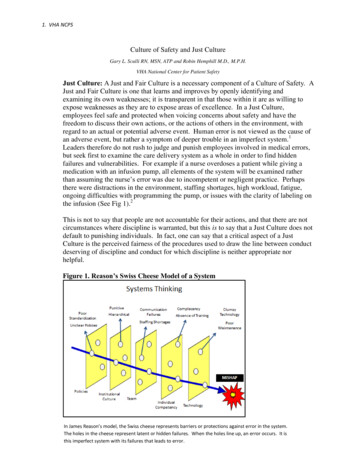
Raafat, Feraidoon and Grudnitski, GaryA Case Analysis on Productivity Improvement: Reducing Operating Costs by Increasing Efficiency at a Flora Companythe wait time is aggregated for the entireproduction day and for all the tables, it resultsin substantial nonproductive time.2.3 Process Waste - Methodology, Resultsand AnalysisThere are three major stages in theproductionprocess:set-up,bouquetmanufacturing, and end of day. All threestages were first observed to determine the“normal” processes that occurred eachproduction day. These observations identifiedthe process requirements for each stage in theproduction day. Next, each stage wasmonitored to document inefficient or out ofsequence or non-value-added activities inbouquet assembly or quality trackingprocesses.After the process waste for each stageof the production day was determined, theduration for each of the processes wasrecorded. The time data was used to create acost estimate for each process waste thatoccurred at each stage of production. To createa cost estimate a high, medium, and lowfrequency of occurrence for each individualprocess waste was estimated. The averagelabor rate for production workers andfrequency of occurrence was applied to eachtime estimate to create a low, medium andhigh cost estimate for each process. The costestimate shows the best, worst and most-likelypotential cost savings from removing orimproving process waste in each stage of theproduction process.Set up begins before the assemblersand the majority of the runners arrive. Theracks of flowers were brought out by thepullers and stored just outside of the rawmaterials cooler. During set up a runner placedflowers on the tables based on the first ordersof the day. Figure 3 shows a diagram of theproduction floor. The flowers are placed ontables in no systematic order. For example, therunner may start at Table #5, then set flowerson Table #9, and continue on to Table #6.Time is wasted as the runner madeunnecessary movements across the productionfloor.Figure 3 - Production Floor LayoutOccasionally, the runner left theproduction area to pull more racks of flowersfrom the area just outside of the raw materialscooler. Some of the runners did not know allof the flower types or could not match thecolor of the flowers that needed to be put onthe tables with those specified in the bill ofmaterials. The runner often left their assignedproduction table to ask another employee forassistance identifying flowers.The table leads read through the recipefor the first order of the day. Productionworkers organized flowers on the tables andcut the ties off the bundled flowers. Most ofthese flowers were unpackaged, but someremained in cardboard boxes and in protectiveJournal of Supply Chain and Operations Management, Volume 10, Number 2, September 2012100
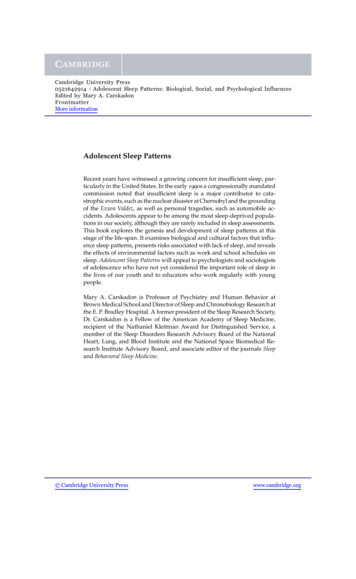
Raafat, Feraidoon and Grudnitski, GaryA Case Analysis on Productivity Improvement: Reducing Operating Costs by Increasing Efficiency at a Flora Companyplastic sleeves (see Figure 4 for an example ofboxed flowers on the production tables).Figure 4 - Boxes of Flowers on ProductionTableProduction workers cut open the boxesand removed any protective plastic sleeves. Asthe production tables were replenished withflowers for orders throughout the day, theyoccasionally received product that is still inboxes and protective sleeves. This was anotheroccurrence of waste for the productionworkers because they had to stop assemblingbouquets to remove the flowers from theirpackaging. Also, when flowers were removedfrom boxes in the production area, there wasan increased amount of trash in the productionarea. This caused the runner to spend timebreaking down the boxes. Anytime the runnerwas too busy to assist the production tables,the table lead left the production table, whichcaused the table to operate with one lessbouquet assembler.The production tables need to berestocked with flowers frequently. Therestocking is required because stackingflowers too high on the tables can causedamage to the products. The bouquetassemblers asked their runner to replenish theflowers. Occasionally, the flowers required foran order were not on the rack located directlynext to the production table in need. Therunner traveled distances of up to 72 feet in theproduction area to retrieve the flowersnecessary to complete the order. Frequent tripsto the raw materials cooler were being madethroughout the day. The runners or pullersonly retrieved small amounts of flowers ineach trip to the raw materials cooler.CF uses the two-way radio to allowemployees to contact one another. However,this tool was not used by table leads to contactrunners. A lack of immediate communicationbetween these groups caused increasednonproductive time by the production workers.There is an automatic cutter on one endof the table and a manual hand cutter on theother end. When regular box orders areproduced, only the automatic cutter is utilized.For smaller bouquet sizes the tables were splitin two, which required the hand cutters to beused at one end of the production table. Thehand cutters caused a large amount of debris topile up at the table and the debris needed to becleared periodically. Timing of the two cuttersshowed using the hand cutter requires 400%more time than the automatic cutter andrequired the use of a ruler on the table todetermine the correct length. Using the ruleron the table was difficult for workers becauseit was often covered by the flowers on thetables. This caused an increase in likelihood ofcutting the bouquets at an incorrect length.There were different quality issues thatoccurred at production tables and in thepackaging area. Quality control workersmonitored quality at two different checkpoints.One checkpoint was at the production tables.The quality control worker in the productionarea audited one to three tables at a time for aseries of quality issues. If the quality of thebouquets at these tables was below par, thebouquets were reworked to improve quality.When the quality supervisor audited aproduction table they wrote their findings on asmall piece of paper and then later traveled totheir workstation to fill out a quality controlform. This data was later fed into the qualitycontrol system. Daily reports were createdfrom the quality control system. When reportswere shared with a production table, theproduction workers often did not pay attentionJournal of Supply Chain and Operations Management, Volume 10, Number 2, September 2012101
Raafat, Feraidoon and Grudnitski, GaryA Case Analysis on Productivity Improvement: Reducing Operating Costs by Increasing Efficiency at a Flora Companyto the table lead as they explained the previousquality errors. A quality board was updatedmonthly and displayed outside the productionarea. The quality board displayed an outline ofthe percentage of quality defect occurrences ateach table.In packaging, a quality control workerchecked the quality of all orders and returnedany unacceptable bouquets to the productionarea for rework. Defects observed inpackaging were not tracked and were not partof the quality report given to each table or thequality board displayed outside the productionarea. At the end of the day, the productionworkers removed all remaining raw materialsfrom the production tables and placed themback onto the racks. The runners temporarilystored the racks in the finished goods coolerbefore they were returned to the raw materialcooler. Damaged raw materials werediscarded. Any pieces of flower or stemremaining on the tables were swept onto thefloor. The production workers swept debrisfrom under the rubber floor mats into piles.Not all debris was removed at this time. Thepiles of debris were discarded in the trash. Allof the production workers left and a separatecrew of cleaners arrived. The cleanersremoved the rubber floor mats and leafblowers were used to remove the remainingdebris.Table 5 is a summary of observed orestimated time for each process waste thatoccurred during the three stages of production.Most non-value added activities occurseveral times a day. From the list above a costestimate was created, which is shown in Table6.To standardize the set up process, CFhas to train its employees properly. Since CFdid not have a documented set up process, achecklist was created to assist the employeesand it can be found in Appendix G.All employees should be trained onflower types as well as different color varietiesto reduce time wasted asking other employeesfor assistance. To reduce time wasted onfinding flower food packets and rubber bandsduring the production day, a smaller binshould be used on the tables. The current binsare too large and are not being utilized by mostproduction tables because they are difficult toreach. This bin should be small enough andlight enough for production workers to pick upand remove its contents.The production set up time can bereduced by preparing the tables the afternoonbefore with all items except the flowers. CFknows the production schedule for thefollowing day, which means the requiredflower food packets and rubber bands could bestocked on the tables the afternoon before.Restocking the previous afternoon and usingthe new bins would cut down the amount oftime wasted trying to find flower food packetsand rubber bands during production.A form was developed to track qualityboth at the production tables and in thepackaging department. The form tracks theoccurrence of quality issues and the reason forthe occurrence of rework (see Appendix H). Itis recommended that the quality controlemployees fill out the quality control sheetwhile they are observing the quality issues inthe production or packaging area. Doing thishelps CF track all of the quality issuesefficiently and reduces the possibility ofquality issue tracking errors.2.4 Inventory- Methodology, Results andAnalysisTo manage inventory in the productionarea CF uses a colored bucket system to storethe excess, damaged, and questionableflowers. Damaged flowers that needed to bethrown away are placed into red coloredbuckets; if a worker is unsure if a flowershould be discarded she places it in a yellowcolored bucket. If there is excess inventorywhen an order is completed, the productionworkers place the reusable flowers in a greenbucket. A quality control worker examines theJournal of Supply Chain and Operations Management, Volume 10, Number 2, September 2012102
Raafat, Feraidoon and Grudnitski, GaryA Case Analysis on Productivity Improvement: Reducing Operating Costs by Increasing Efficiency at a Flora Companyflowers in the yellow buckets to determine ifthey should be discarded or reused. Thequality control worker reviews the type andquantity of flowers in t
Journal of Supply Chain and Operations Management, Volume 10, Number 2, September 2012 95 assemblers pick the stems based on a bill of materials, prepare the bouquet, cut the stems to the desired length, use rubber bands to tie the stems, wrap the bouquet, place the flower food on the stems of the bouquet, and then place it in a bucket.