Transcription
INTERNATIONAl TRADEAND ExchANgE RATEJong Woo KangNO. 498october 2016adb economicsworking paper seriesASIAN DEVELOPMENT BANK
ADB Economics Working Paper SeriesInternational Trade and Exchange RateJong Woo KangNo. 498 October 2016Jong Woo Kang (jkang@adb.org) is principal economistat the Economic Research and Regional CooperationDepartment, Asian Development Bank.I am grateful to Suzette Dagli for excellent researchassistance.
Creative Commons Attribution 3.0 IGO license (CC BY 3.0 IGO) 2016 Asian Development Bank6 ADB Avenue, Mandaluyong City, 1550 Metro Manila, PhilippinesTel 63 2 632 4444; Fax 63 2 636 2444www.adb.orgSome rights reserved. Published in 2016.Printed in the Philippines.ISSN 2313-6537 (Print), 2313-6545 (e-ISSN)Publication Stock No. WPS168472-2Cataloging-In-Publication DataAsian Development Bank.International trade and exchange rate.Mandaluyong City, Philippines: Asian Development Bank, 2016.1. Gravity model.2. Real effective exchange rate.3. Trade volume.I. Asian Development Bank.The views expressed in this publication are those of the authors and do not necessarily reflect the views and policiesof the Asian Development Bank (ADB) or its Board of Governors or the governments they represent.ADB does not guarantee the accuracy of the data included in this publication and accepts no responsibility for anyconsequence of their use. The mention of specific companies or products of manufacturers does not imply that theyare endorsed or recommended by ADB in preference to others of a similar nature that are not mentioned.By making any designation of or reference to a particular territory or geographic area, or by using the term “country”in this document, ADB does not intend to make any judgments as to the legal or other status of any territory or area.This work is available under the Creative Commons Attribution 3.0 IGO license (CC BY 3.0 o/. By using the content of this publication, you agree to be boundby the terms of this license.This CC license does not apply to non-ADB copyright materials in this publication. If the material is attributedto another source, please contact the copyright owner or publisher of that source for permission to reproduce it.ADB cannot be held liable for any claims that arise as a result of your use of the material.Attribution—You should always acknowledge ADB as the source using the following format:[Author]. [Year of publication]. [Title of the work in italics]. [City of publication]: [Publisher]. ADB. [URL or DOI][license].Translations—Any translations you create should carry the following disclaimer:Originally published by ADB in English under the title [title in italics]. ADB. [URL or DOI] [license]. The qualityof the translation and its coherence with the original text is the sole responsibility of the translator. The English originalof this work is the only official version.Adaptations—Any adaptations you create should carry the following disclaimer:This is an adaptation of an original work titled [title in italics]. ADB. [URL or DOI][license]. The views expressedhere are those of the authors and do not necessarily reflect the views and policies of ADB or its Board of Governorsor the governments they represent. ADB does not endorse this work or guarantee the accuracy of the data includedin this publication and accepts no responsibility for any consequence of their use.Please contact pubsmarketing@adb.org if you have questions or comments with respect to content, or if you wishto obtain copyright permission for your intended use that does not fall within these terms, or for permission to usethe ADB logo.Notes:1. In this publication, “ ” refers to US dollars.2. Corrigenda to ADB publications may be found at http://www.adb.org/publications/corrigenda
CONTENTSTABLES AND FIGURESivABSTRACTviI.INTRODUCTION1II.CHANGING TRENDS IN TRADE GROWTH1A.B.13III.IMPACT OF EXCHANGE RATES ON TRADE GROWTHA.B.C.IV.Trade Volume GrowthRole of Developed and Developing Countries in International TradeExchange Rate Movements and Their Impact on TradeDecomposition of Factors Affecting Sluggish Trade GrowthImpact of Exchange Rates on Trade 3
TABLES AND FIGURESTABLES12345Factor Decomposition of Trade Volume Growth between 2006 and 2015Gravity Model Estimation Results (2001–2015) under Base ModelGravity Model Estimation Results under Base Model(2003–2006 versus 2007–2010 versus 2012–2015)Gravity Model Estimation Results (2001–2015) under Extended ModelGravity Model Estimation Results under Extended Model(2003–2006 versus 2007–2010 versus 161718192021222324252627282930313233Trade VolumeGrowth DifferenceAsiaWorldTrade Volume Growth (trade weighted)Growth DifferenceTrade Volume Growth (developed)Trade Volume Growth (developing)Trade Volume Growth (developed, trade weighted)Trade Volume Growth (developing, trade weighted)Export Volume GrowthImport Volume GrowthExport Volume Growth (trade weighted)Import Volume Growth (trade weighted)Export Volume Growth (simple average, developing world versus developing Asia)Import Volume Growth (simple average, developing world versus developing Asia)Export Volume Growth (trade-weighted average, developing world versus developing Asia)Import Volume Growth (trade-weighted average, developing world versus developing Asia)REER Index, 2001–2006REER Index, 2012–2015Standard Deviation of REERREER Elasticity of Export VolumeREER Elasticity of Import VolumeTrade Volume Growth―depreciation, 2001–2006Trade Volume Growth―appreciation, 2001–2006Trade Volume Growth―depreciation, 2012–2015Trade Volume Growth―appreciation, 2012–2015Trade Volume―depreciation, 2001–2006Trade Volume―appreciation, 2001–2006Trade Volume―depreciation, 2012–2015Trade Volume―appreciation, 2012–2015REER versus Export Volume, 2001–2006REER versus Import Volume, 11
343536373839A2.1A2.2A2.3A2.4REER versus Export Volume, 2012–2015REER versus Import Volume, 2012–2015Counterfactual versus Actual―depreciation, 2012–2015Counterfactual versus Actual―appreciation, 2012–2015Counterfactual versus Actual―depreciation, 2001–2006Counterfactual versus Actual―appreciation, 2001–2006World Export Volume (2010 100)World Import Volume (2010 100)World Export Value (2010 100)World Import Value (2010 100)12121313141421212121
ABSTRACTTepid trade growth since the 2008/2009 global financial crisis (GFC) has been partly attributed tosluggish demand from developed countries. However, data reveals that developing countries play abigger role in holding back trade growth, while developed countries show quite robust import growth.Post-GFC, the exchange rate volatility has grown significantly. As decomposion of country groups bychanges in currency valuation shows, however, local currency depreciation is not contributing toexport growth as much as conventional wisdom dictates. On the other hand, countries withappreciating currencies show rising import intensity and significant export growth. This implies that themore countries undergo currency devaluation—the deeper the degree of devaluation and evencompetitive devaluations—the more likely international trade will grow slower.Keywords: gravity model, real effective exchange rate, trade volumeJEL codes: C23, F10, F31
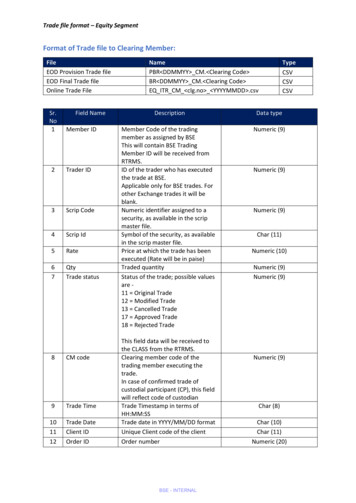
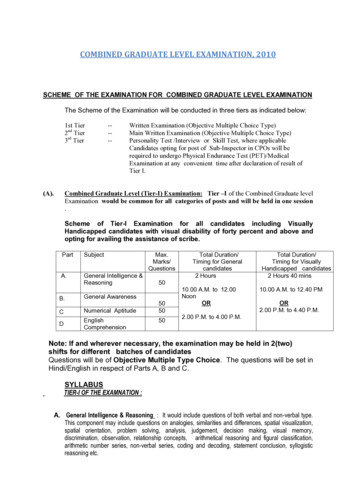
I.INTRODUCTIONAfter a short period of quick recovery following the 2008/2009 global financial crisis (GFC), therehave been protracted periods of slumping world trade growth. What bewilders policy makers andacademia alike is that not only trade value has stagnated—significantly affected by volatile and lowcommodity prices, especially oil—but trade volume seems to have stagnated as well. Pre-GFC, globaltrade growth outpaced gross domestic product (GDP) growth—trade growth from 1990 to 2008averaged 5.9%, while GDP grew 3.7%. Since the GFC, however, global trade volume growth averagedbehind the global GDP growth (World Economic Outlook 2015, International Monetary Fund;International Trade Statistics 2015, World Trade Organization). Historically then, the GFC posits animportant structural change in the pattern of global trade. Not only has the growth rate slumped, butthe dynamics between what drives trade growth and how it responds has changed significantly frompre- to post-GFC.One example is the effect of price movements in local currency. Depreciation would normallyincrease a country’s exports and reduce imports due to changes in terms of trade and the effect ofprice elasticity of demand. Changes in trade volume should capture this effect better than tradevalue—by looking at the pure elasticity effect, excluding the short-term terms-of-trade effect. Thelinkage between exchange rates and trade has long been studied to investigate the impact of exchangerates and exchange rate policies in calibrating a country’s external position as well as domesticeconomic stability. While much literature shows the significant impact in level and volatility of theexchange rate on trade, myriad research also points to some ambiguous or counterintuitive resultswhen it comes to the impact on real rather than nominal trade.Against this background, this paper examines whether structural changes have occurred intrade growth pattern pre- and post-GFC; and to what extent it can be explained by currencymovements. In examining the latter, we also test the impact of exchange rate movements on tradevolume to see if its impact changed pre- and post-GFC. The paper is organized as follows. Section IIexamines changing trends in trade growth during the 2000s, focusing on differences betweendeveloped and developing countries. Section III investigates the impact of exchange rates on tradegrowth through both factor decomposition methodology and empirical analysis, focusing on structuralchanges between pre- and post-GFC periods. Section IV concludes.II.A.CHANGING TRENDS IN TRADE GROWTHTrade Volume GrowthFast growing trade suffered large fluctuations during the GFC period and began stagnating afterward.Thus, when examining trade growth trends during the 2000s, we need to compare pre- and post-GFCperiods to discern any change in trade growth patterns. The export and import volume index—whichcaptures annual trade growth—grew rapidly until 2004, when both export and import volumessurpassed 10% growth. But they began tapering in 2005, and dropped precipitously in 2009 in themidst of the GFC. Trade volume rose steeply in 2010 partly due to the base effect, but growth hasstagnated since 2011. For 2001–2015, average annual export and import volume growth was 4.4% and5% respectively, while growth was 2.4% and 2.1%, respectively for the period 2012–2015 (Figure 1).11Based on World Trade Organization trade value data, our 60 country sample—chosen by available real effectiveexchange rate (REER) data—cover some 91% of total world trade.
2 ADB Economics Working Paper Series No. 498Figure 1: Trade VolumeFigure 2: Growth 12002Export indexImport indexSource: Author’s calculation based on the World Trade Organization’strade volume 20042003–1020022001020–2–3–4Source: Author’s calculation based on the World Trade Organization’strade volume index.With the exception of 2000, 2001, 2009, and more recently 2013 and 2015, import growthexceeded export growth (Figure 2). And overall trade growth fell below economic growth beginning2012. This phenomenon is more pronounced in Asia than the rest of the world, growing wider in 2015(Figures 3 and 4).Figure 3: AsiaFigure 4: otal trade growthGDP growthGDP gross domestic product.Notes: GDP growth is weighted using GDP at purchasing power parity.Total trade growth is the average of export volume growth and importvolume growth from the World Trade Organization.Source: ADB calculations using data from World Economic OutlookApril 2016 Database, International Monetary Fund and InternationalTrade Statistics 2015, World Trade 0072008200920102011201220132014201550Total trade growthGDP growthGDP gross domestic product.Notes: GDP growth is weighted using GDP at purchasing power parity.Total trade growth is the average of export volume growth and importvolume growth from the World Trade Organization.Source: ADB calculations using data from World Economic Outlook April2016 Database, International Monetary Fund and International TradeStatistics 2015, World Trade Organization.
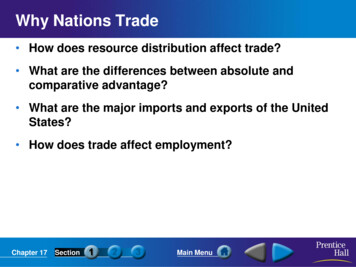
International Trade and Exchange Rate 3Seemingly dramatic decline since 2012, however, is less pronounced if trade weight average Bytrade-weighted average—which gives a more accurate picture of trade growth trends—internationaltrade grew in 2012–2015 not far below the 2001–2002 level. Volume jumped ahead in 2003 andmaintained a moderate growth trend (in the 2%–4% range) until the GFC (Figure 5). With theexception of 2003 and 2004, export growth was consistently higher than import growth (Figure 6).Figure 5: Trade Volume Growth(trade weighted)Figure 6: Growth 420012002Export index (trade weighted)Import index (trade weighted)Source: Author’s calculation based on the World Trade Organization’strade volume 062004–0.5020032001202002040–1.0–1.5Source: Author’s calculation based on the World Trade Organization’strade volume index.Role of Developed and Developing Countries in International Trade2It is widely believed the slump in international trade growth is largely due to weak demand fromadvanced economies. To test its accuracy, we can assess trade growth for developed and developingcountry groups separately. By both simple average and trade-weighted average, growth of exports andimports recovered in developed countries beginning 2013, while in developing countries it hasremained stagnant (Figures 7 and 8). In developed countries, export and import trade-weightedgrowth averaged 2.1% and 1.8%, respectively during 2012–2015, against 2.8% and 2.4% for the entire2001–2015 period (Figures 9 and 10). In contrast, developing country growth rates for exports andimports averaged 3.8% and 3.4%, respectively during 2012–2015, a more drastic decline in growthmomentum compared with their respective 7.3% and 7.4% rates over the entire 2001–2015 period.2Country classifications are based on the World Economic Situations and Prospects 2014 report. Of the 60 economies in thissample, 36 are classified as developed economies and 24 are developing economies (see Appendix 1).
4 ADB Economics Working Paper Series No. 498Figure 7: Trade Volume Growth(developed)Figure 8: Trade Volume Growth(developing)120140100120100808060Export indexImport indexSource: Author’s calculation based on the World Trade Organization’strade volume 15Export index200502006020032020042020014020026040Import indexSource: Author’s calculation based on the World Trade Organization’strade volume index.Figure 9: Trade Volume Growth(developed, trade weighted)Figure 10: Trade Volume Growth(developing, trade weighted)1401201201001008080606040Export index (trade weighted)Import index (trade weighted)Source: Author’s calculation based on the World Trade Organization’strade volume 0520062003200402001020022020024020Export index (trade weighted)Import index (trade weighted)Source: Author’s calculation based on the World Trade Organization’strade volume index.The comparison between developed and developing countries becomes starker when placingexport and import growth rates side by side. The gap in trade-weighted average export growth betweendeveloped and developing countries has narrowed since 2011—by 2015 the gap was less than onepercentage point (Figure 11). For imports, developed countries have recovered more strongly(Figure 12). In trade-weighted terms, developed countries’ average import growth surpassed
International Trade and Exchange Rate 5developing countries beginning 2014—and quite dramatically in 2015 (4.3% compared with 1.4% fordeveloping countries [Figures 13 and 14]).So attributing the slump in global trade growth to weak demand in developed countries doesnot jive with what is actually happening. The recent trade growth slump is increasingly due to sluggishtrade growth in developing countries.Figure 11: Export Volume GrowthFigure 12: Import Volume Growth1201401001208010080606040402020Export (trade weighted) developedExport (trade weighted) developingSource: Author’s calculation based on the World Trade Organization’strade volume 007120200520061402002Figure 14: Import Volume Growth(trade weighted)14020042009Source: Author’s calculation based on the World Trade Organization’strade volume index.Figure 13: Export Volume Growth(trade weighted)20032005Import (simple average) developedImport (simple average) developingSource: Author’s calculation based on the World Trade Organization’strade volume index.20012002200620072003Export (simple average) developedExport (simple average) 9200720082005200620042003200220010Import (trade weighted) developedImport (trade weighted) developingSource: Author’s calculation based on the World Trade Organization’strade volume index.
6 ADB Economics Working Paper Series No. 498Now, let us see if developing Asia is faring relatively better in trade among the developingcountry group. It appears developing Asia indeed outperformed the developing world in the 2000s.3But trade performance is less pronounced since the GFC. This is particularly true in imports. Whileexport volume growth remains higher in developing Asia than in the developing world overall, importgrowth has been almost the same and was even lower in 2012 and 2015 (Figures 15, 16, 17, and 18).Post-GFC, Asia’s contribution to global trade growth has tapered quickly.Figure 15: Export Volume Growth(simple average, developing world versusdeveloping Asia)Source: Author’s calculation based on the World Trade Organization’strade volume index.AsiaSource: Author’s calculation based on the World Trade Organization’strade volume 2003Figure 18: Import Volume Growth(trade-weighted average, developing worldversus developing Asia)1403AsiaSource: Author’s calculation based on the World Trade Organization’strade volume index.Figure 17: Export Volume Growth(trade-weighted average, developing worldversus developing 0200510020041202003120200114020021402002Figure 16: Import Volume Growth(simple average, developing world versusdeveloping Asia)AsiaSource: Author’s calculation based on the World Trade Organization’strade volume index.In our sample of countries with available REER data, developing Asia includes the People’s Republic of China (PRC), India,Indonesia, the Republic of Korea, Malaysia, the Philippines, and Thailand.
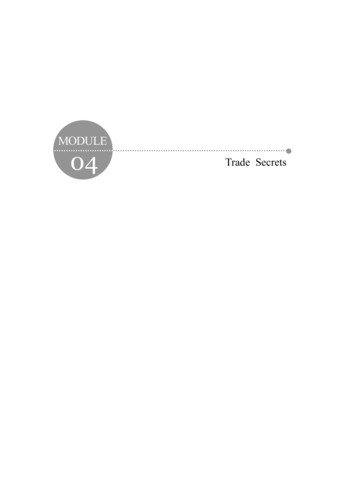
International Trade and Exchange Rate 7III.A.IMPACT OF EXCHANGE RATES ON TRADE GROWTHExchange Rate Movements and Their Impact on TradeAnalyzing the recent trade growth pattern a slump in trade growth or convergence toward moderatelonger-term growth rates and comparing it with the pre-GFC period reveals some interesting changesin trade growth patterns. Given conventional wisdom—that exchange rate appreciation contributes toan increase in imports and decreased exports, with depreciation acting vice versa—we examine theaverage export and import growth based on whether countries experienced local currencydepreciation or appreciation. First, we review the exchange rate movements since 2000 to see if thereare different patterns between pre- and post-GFC periods. Examining exchange rate movements overtime, we find that variations in real effective exchange rate (REER) movements across countriesdecreased pre-GFC (Figure 19). However, exchange rate variations across countries rapidly increasedpost-GFC (Figure 20). In fact, the standard deviation was as high as 37 for REER in 2015 (with 2010 asbase year).Figure 19: REER Index, 2001–2006Figure 20: REER Index, 0402020020000200220042006REER real effective exchange rate.Source: Author’s calculation based on Bank for InternationalSettlements REER annual average (2010 100).2008201120122013201420152016REER real effective exchange rate.Source: Author’s calculation based on Bank for InternationalSettlements REER annual average (2010 100).This also applies to exchange rate fluctuations over time within individual countries. When weconsider the standard deviation of REER for 2003–2006 and 2012–2015, more countries experiencedhigher exchange rate fluctuations post-GFC than pre-GFC (Figure 21). This corroborates theobservation that recent exchange rate movements have been unusually large.
8 ADB Economics Working Paper Series No. 498Figure 21: Standard Deviation of REER1412SD (2012–2015)108642002468SD (2003–2006)1012REER real effective exchange rate, SD standard deviation.Source: Author’s calculation based on Bank for International Settlements REERannual average (2010 100).On the other hand, the trade response to exchange rate changes has been smaller post-GFC.Many more countries had lower elasticity of both exports and imports with respect to changes in REERpost-GFC than pre-GFC (Figures 22 and 23).Figure 22: REER Elasticity of Export VolumeFigure 23: REER Elasticity of Import EER real effective exchange rate.Source: Author’s calculation based on Bank for InternationalSettlements REER annual average (2010 100) and the World TradeOrganization’s trade volume index (previous year 100).012003–20062REER real effective exchange rate.Source: Author’s calculation based on Bank for InternationalSettlements REER annual average (2010 100) and the World TradeOrganization’s trade volume index (previous year 100).This posits the possibility that the effect of exchange rate changes on trade growth may havechanged over time. So let us examine how exchange rate movements affected trade volume growthpost-GFC compared with the pre-GFC period. When we look at trade-weighted average trade growthfrom 2001 to 2006, those experiencing REER depreciation showed an overall increase in both export3
International Trade and Exchange Rate 9and import growth rates, except in 2005. And except for 2003, export volume growth was higher thanimport growth, supported by a depreciating REER (Figure 24). For those where REER appreciated,both export and import volumes grew, with import growth higher than export growth—basically in linewith what would be expected (Figure 25). However, pre-GFC, the overall trend of export and importgrowth outweighed the impact of currency movements.Figure 24: Trade Volume Growth―depreciation,2001‒2006Figure 25: Trade Volume 05Import2006REER real effective exchange rate.Source: Author’s calculation based on Bank for InternationalSettlements REER annual average (2010 100) and the World TradeOrganization’s trade volume index (previous year 100).200120022003Export200420052006ImportREER real effective exchange rate.Source: Author’s calculation based on Bank for InternationalSettlements REER annual average (2010 100) and the World TradeOrganization’s trade volume index (previous year 100).After the GFC, those whose local currencies depreciated saw both export and import growthincrease, but export growth was tepid—falling below import growth in 2014 before recovering in 2015(Figure 26). Unlike the overall pre-GFC trend of increasing export and import growth, both were tepidpost-GFC, dipping in 2014 in countries whose REER appreciated in 2012–2015 (Figure 27). The higherpre-GFC import to export growth reversed post-GFC, only starting to recover in 2015. This contradictsthe conventional wisdom that currency appreciation should boost imports more than exports.Overall, while the trade-weighted average export and import volume growth index for thosewith deprecating currencies was 108.6 and 107.1 pre-GFC, it fell significantly to 102.2 and 102 postGFC. The respective indexes for those with appreciating currencies declined from 104.4 for export and105.4 for import pre-GFC to 103.3 and 102.8 post-GFC. We can thus infer that tepid export growth incountries with depreciating currencies, coupled with sluggish import growth in those with appreciatingcurrencies, underlie the slump in trade growth post-GFC. This could imply currency depreciationmight not help shore up flagging exports and appreciation might not support import growth as much asthose used to. Nevertheless, the most recent trend in 2015 indicates a recovery in both exports of thedepreciation country group and imports of the appreciation country group, suggesting the usualrelationship between export and import growth rates and currency movements has been restored, atleast for now.The tepid growth of both exports and imports in countries with depreciating currencies is quitepronounced, reflected in drastic decline in growth rates post-GFC, even below those with appreciatingcurrencies. Overall, it appears that weaker currencies do not contribute to trade growth as before.
10 ADB Economics Working Paper Series No. 498Figure 26: Trade Volume 2.5102.0101.5101.0100.5100.099.599.0Figure 27: Trade Volume rt2015REER real effective exchange rate.Source: Author’s calculation based on Bank for InternationalSettlements REER annual average (2010 100) and the World TradeOrganization’s trade volume index (previous year 100).B.20122013Export20142015ImportREER real effective exchange rate.Source: Author’s calculation based on Bank for InternationalSettlements REER annual average (2010 100) and the World TradeOrganization’s trade volume index (previous year 100).Decomposition of Factors Affecting Sluggish Trade GrowthThe slump in trade growth also appears in recent aggregate export and export volume data. Bothaggregate export and import volumes for countries with depreciating currencies are increasing muchslower post-GFC than during the pre-GFC period. The same applies to those with appreciatingcurrencies, but with a stark contrast in aggregate import volume between pre- and post-GFC. Andimport volumes underperformed aggregate export volumes post-GFC (Figures 28, 29, 30, and 31).Figure 28: Trade Volume―depreciation,2001‒2006Figure 29: Trade 000 billion 012002Export volume2003200420052006Import volumeSources: Bank for International Settlements and World TradeOrganization.20012002Export volume2003200420052006Import volumeSources: Bank for International Settlements and World TradeOrganization.
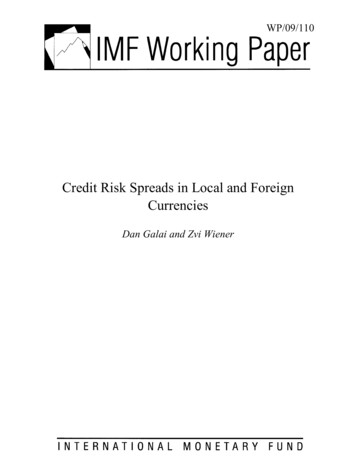
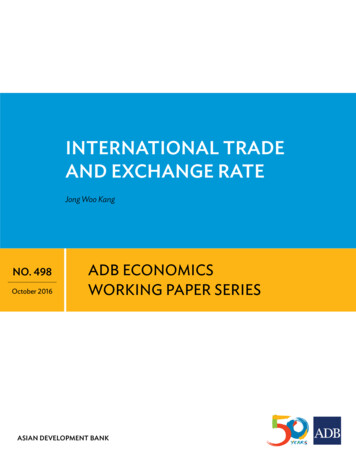
International Trade and Exchange Rate 11Figure 31: Trade 0006,5008,500 billion billionFigure 30: Trade 5007,0005,000201220132014Export volume2012201520132014Export volumeImport volumeSources: Bank for International Settlements and World TradeOrganization.2015Import volumeSources: Bank for International Settlements and World TradeOrganization.The same pattern appears when we look at the overall relationship between exchange ratemovements and trade performance pre- and post-GFC. For the 59 countires in our sample, currencyappreciation was accompanied by increases in both exports and imports pre-GFC. This relationshipbecame muted for exports and even slightly negative for imports post-GFC (Figures 32, 33, 34, and35). This corroborates the finding that before the GFC, the growing overall export and import trendoutweighed the impact of currency movements—and that import growth was tepid even for thosewith appreciating currencies post-GFC.Figure 33: REER versus Import Volume,2001‒200614141212Log (import volume)Log (export volume)Figure 32: REER versus Export ER real effective exchange rate.Source: Author’s calculation based on Bank for InternationalSettlements REER annual average (2010 100) and the World TradeOrganization’s trade volume index (previous year 100).050100150200REERREER real effective exchange rate.Source: Author’s calculation based on Bank for InternationalSettlements REER annual average (2010 100) and the World TradeOrganization’s trade volume index (previous year 100).
12 ADB Economics Working Paper Series No. 498Figure 35: REER versus Import Volume,2012–201514141212Log (import volume)Log (export volume)Figure 34: REER versus Export Volume,2012–2015108642108642000100200300REERREER real effective exchange rate.Source: Author’s calculation based on Bank for InternationalSettlements REER annual average (2010 100) and the World TradeOrganization’s trade volume index (previous year 100).0100200300REERREER real effective exchange rate.S
18 Import Volume Growth (trade-weighted average, developing world versus developing Asia) 6 19 REER Index, 2001-2006 7 20 REER Index, 2012-2015 7 21 Standard Deviation of REER 8 22 REER Elasticity of Export Volume 8 23 REER Elasticity of Import Volume 8 24 Trade Volume Growth―depreciation, 2001-2006 9