Transcription
152JOURNAL OF CLIMATEVOLUME 23Evaluation of AATSR and TMI Satellite SST DataRICHARD W. REYNOLDSNOAA/National Climatic Data Center, Asheville, North CarolinaCHELLE L. GENTEMANNRemote Sensing Systems, Santa Rosa, CaliforniaGARY K. CORLETTUniversity of Leicester, Leicester, United Kingdom(Manuscript received 21 May 2009, in final form 28 July 2009)ABSTRACTThe purpose of this paper is to investigate two satellite instruments for SST: the infrared (IR) AdvancedAlong Track Scanning Radiometer (AATSR) and the microwave (MW) Tropical Rainfall Measuring Mission(TRMM) Microwave Imager (TMI). Because of its dual view, AATSR has a potential for lower biases thanother IR products such as the Advanced Very High Resolution Radiometer (AVHRR), while the tropicalTMI record was available for a longer period of time than the global MW instrument, the AdvancedMicrowave Scanning Radiometer (AMSR).The results show that the AATSR IR retrievals are good quality with biases lower than or as low as othersatellite retrievals between 508S and 508N. Furthermore, the dual-view algorithm reduces the influence ofaerosol contamination. However, the AATSR coverage is roughly half that of AVHRR. North of 508N thereappear to be biases and high variability in summer daytime retrievals, with smaller but consistent biasesobserved below 508S. TMI data can significantly improve coverage offshore in regions where IR retrievals arereduced by cloud cover. However, TMI data have small-scale biases from land contamination that should beremoved by modifying the land–sea mask to remove more coastal regions.1. Introduction and purposeThe Group for High-Resolution Sea Surface Temperature (GHRSST; see Donlon et al. 2007) has improved andstandardized access to a number of different satellite datasets. These improvements have led to a number of globaland regional daily SST analyses. Analyses convert irregular spaced data in time and space into regular griddedfields. The purpose of most GHRSST analyses is to obtainthe highest accuracy and resolution possible. These twogoals often conflict with each other because as resolutionincreases, the relative number of grid boxes without localdata decreases along with accuracy. For example, infrared(IR) satellite retrievals have higher spatial resolution thanCorresponding author address: Richard W. Reynolds, NOAA/National Climatic Data Center, 151 Patton Ave., Asheville, NC28801-5001.E-mail: richard.w.reynolds@noaa.govDOI: 10.1175/2009JCLI3252.1Ó 2010 American Meteorological Societymicrowave (MW) retrievals while open-ocean MW retrievals have better coverage. If an IR instrument produces a 4-km resolution while a MW instrument producesa 25-km resolution, how will the 4-km resolution be maintained when the 4-km data are missing? Because of thecoverage difference, Reynolds et al. (2007) found a largeincrease in standard deviation and tighter gradients whenAdvanced Microwave Scanning Radiometer (AMSR) retrievals were added to a daily optimum interpolation (OI)analysis using only Advanced Very High Resolution Radiometer (AVHRR) retrievals. Because of this change invariability Reynolds et al. (2007) has two analyses: AVHRRonly (using AHVRR and in situ data) and AMSR1AVHRR (using AMSR, AVHRR, and in situ data).The purpose of this paper is to look at two additional polar-orbiting satellite datasets to determinehow adding them would impact the AVHRR-only andAMSR1AVHRR analyses. The two satellite datasetsconsidered are the Advanced Along Track Scanning
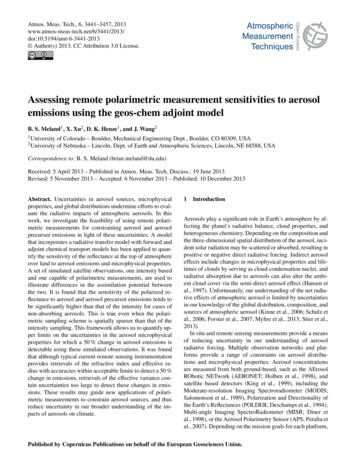
1 JANUARY 2010REYNOLDS ET AL.153FIG. 1. Spatial average daily bias of buoy and uncorrected ship data for three zonal bands:(top) 208–908N, (middle) 208S–208N, and (bottom) 908–208S. Biases are defined as differenceswith respect to the daily OI using AMSR and AVHRR data.Radiometer (AATSR) and the Tropical Rainfall Measuring Mission (TRMM) Microwave Imager (TMI).AATSR was selected because it has a potential for lowerbiases compared to AVHRR as will be discussed in thenext section. TMI was selected because of the strongimpact the global MW instrument, AMSR, has on analyses in midlatitudes. Two main questions will be consid-ered. What are the biases of these two instruments? Whatis the impact of using these data in an analysis and areseparate analysis versions necessary? To answer thesequestions, in situ data from ships and buoys and satellitedata from AVHRR and AMSR will be used. Analysisprocedures make nonlinear processing choices that filterand effectively ‘‘color’’ the final result. Thus, to access the
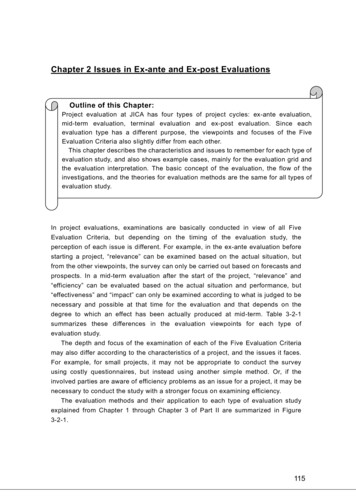
154JOURNAL OF CLIMATEVOLUME 23TABLE 1. Average percentage of global ocean 1/ 48 boxes with daily data to total ocean boxes. The boxes are weighted by the cosine oflatitude; boxes covered with sea ice are counted as ocean boxes.Type of dataCoverage: 908S–908NCoverage: 208S–208NBuoyShipDay AVHRR: NOAA-17Night AVHRR: NOAA-17Day AVHRR: NOAA-18Night AVHRR: NOAA-18Day AATSRNight AATSRDay AMSRNight AMSRAscending TMIDescending 5%39.1%39.1%accuracy of AATSR and TMI data, only one analysisproduct will be used. A separate paper is being preparedcomparing different analysis products.2. DataThe AATSR is a precision radiometer designed for theaccurate retrieval of SST from space for climate applica-tions (Llewellyn-Jones et al. 2001). The SST is retrievedfrom an algorithm based on radiative transfer theory (e.g.,Závody et al. 1995; Merchant et al. 1999), which performa regression of SST to simulated brightness temperatureswith nominal band centers located at 3.7, 11, and 12 mm,utilizing either the nadir view or a combination of the nadirand forward views. The 3.7-mm channel has solar contamination during the day. Thus, two different retrievalsFIG. 2. Average (1 Jan 2006–31 Dec 2008) daytime satellite bias with respect to the daily OI using AMSR andAVHRR data. (top left) AVHRR NOAA-17, (top right) AVHRR NOAA-18, (bottom left) AATSR, and (bottomright) AMSR. The left (right) panels show satellite observations with morning (afternoon) equatorial crossing times.
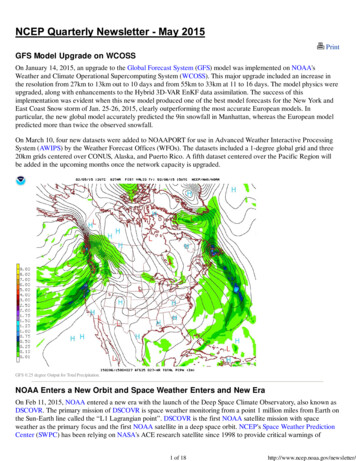
1 JANUARY 2010REYNOLDS ET AL.155FIG. 3. As in Fig. 2, but for the daily daytime satellite bias standard deviation bias with respect to the daily OI usingAMSR and AVHRR data for June, July and August for 2006–08.are implemented, namely dual-view two-channel, mainlydaytime, and dual-view three-channel, only at nighttime.SST fields are provided as either a 1-km swath product, oras a gridded spatially averaged product at several resolutions. Here, single swath 10-arcminute (;18 km at theequator) resolution data, referred to as the Meteo product,have been used by first creating daily composite files fordaytime and nighttime prior to ingestion into the analysis.A residual retrieval bias (Merchant et al. 2006) is accounted for by the addition of a latitudinal-dependentcorrection to all dual-view retrievals according to Birks(2006). An assessment of the accuracy of the Meteo product from AATSR was provided by O’Carroll et al. (2006),who found that the AATSR had a global bias of ;0.2 K.As the AATSR bias is of a similar size to the skin minusbulk SST difference (Donlon et al. 2002), no additionaladjustment was applied to convert the AATSR skin SSTto an equivalent bulk depth.Accurate microwave SSTs from TMI are availablefrom December 1997 through the present. Orbiting at analtitude of about 400 km, this sun-asynchronous satelliteis in an equatorial orbit retrieving data within 398 latitude of the equator. The orbit precesses through thediurnal cycle, measuring a complete cycle every 23 days(Kummerow et al. 1998). TMI has 8 channels, corresponding to 4 frequencies (11, 19, 24, and 37 GHz) andtwo polarizations (vertical and horizontal). This is thefirst microwave radiometer capable of accurate globalSSTs since the poorly calibrated Scanning MultichannelMicrowave Radiometer (SMMR) was launched in 1987(Wentz et al. 2000). (In addition to SST, TMI also measures surface wind speed, atmospheric water vapor, cloudliquid water, and rain rate.) Between 4 and 11 GHz thevertically polarized brightness temperature of the seasurface has an appreciable sensitivity to SST. In additionto SST, the brightness temperature depends on the seasurface roughness and on the atmospheric temperature and moisture profile. Fortunately, the spectraland polarimetric signatures of the surface roughnessand the atmosphere are quite distinct from the SSTsignature, and the influence of these effects can beremoved given simultaneous measurements at multiple frequencies and polarizations. All channels areused to simultaneously retrieve SST, wind speed, columnar water vapor, cloud liquid water, and rain rate(Wentz and Meissner 2000) using a multistage linear
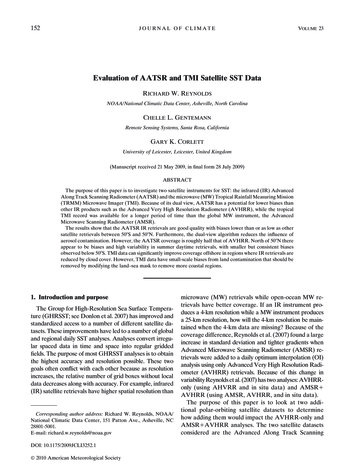
156JOURNAL OF CLIMATEVOLUME 23FIG. 4. As in Fig. 2, but for the average (1 Jan 2006–31 Dec 2008) nighttime satellite bias with respect to the daily OIusing AMSR and AVHRR data.regression algorithm derived through comprehensiveradiative transfer model simulations. SST retrieval isprevented only in regions with sun glint, rain, and nearland. Since only a small number of retrievals are unsuccessful, almost complete global coverage between398S and 398N is achieved daily. Any errors in retrieved wind speed, water vapor, or cloud liquid watermay result in errors in retrieved SST.3. Data comparisonsAnalyses using different in situ and satellite productsall need a reference field. Reynolds et al. (2007) uses insitu (ship and buoy) data as the standard. Other analysesmay use a satellite product or a climatology. Some adjustment of satellite data is necessary because of smallsatellite biases, which must be corrected to avoid discontinuities between satellite products. Of course thesediscontinuities can also occur simply because of different diurnal variability measured by the satellites at different observation times.The analysis procedure used here is version 2 of thedaily OI, which is done on a 1/ 48 spatial grid. Differencesbetween version 1 (Reynolds et al. 2007) and version 2are relatively small and mostly consist of additionaltemporal smoothing (more information is available online at apers/whats-new-v2.pdf). In particular 3 days of datawere used in version 2 where the off days (the day beforeand after the analysis day) have a reduced weighting (thenoise-to-signal standard deviation was doubled) compared to the central day.In the daily OI all the satellite data are adjusted to bothship and buoy data. As discussed in Reynolds and Smith(1994) ship data have larger random errors than buoydata. These differences can be accounted for in an OIprocedure. However, any biases must be corrected beforethe OI. Furthermore, buoy data were very sparse beforeabout 1989 (e.g., see Reynolds et al. 2002). Thus, ship dataneed to be used, and ship biases need to be corrected. Themethod of measuring almost all SST observations fromships has changed over time from temperatures measuredfrom uninsulated and insulated buckets to temperaturesmeasured at engine room intakes. Kent and Taylor (2006)have shown that ship observations made using bucketstend to be biased cold because of evaporation, while ship
1 JANUARY 2010REYNOLDS ET AL.157FIG. 5. Zonal and temporal averaged (1 Jan 2006–31 Dec 2008) nighttime satellite bias with respect to thedaily OI using AMSR and AVHRR data.observations from engine room intake tend to be biasedwarm because of engine room heating. The location, type,and frequency of measurements continually evolve. Todetermine the overall bias, monthly averaged ship biaseswere computed with respect to buoys. However, evenwith temporal smoothing, differences occurred at irregular intervals and did not seem to be related to seasonal orENSO events. Monthly scatterplots of the collocated average global ship and buoy anomaly were computed aswill be discussed in the appendix. A linear fitting procedure indicated that ships were warmer than buoys by0.138C. When the average global difference was computeddirectly, the ships were found to be warmer than buoysby 0.148C. As differences of 0.018C were not significant,0.148C was subtracted from all ship data before they wereused in the satellite bias correction and in the OI analysis.No adjustments were made to the buoy data.In the results that follow, important differences amongsatellite products will be presented. Some of these differences can be attributed to the sampling time and theinfluence of the diurnal cycle. However, others are moredifficult to explain especially at night when the diurnalsignal is very weak. Thus, it is critical to choose somestandard and correct all data products to it. In the analysespresented here, buoy- and bias-corrected ship data areused. In many GHRSST products, AATSR data are usedas the standard. There is no ‘‘best’’ answer to this problem.For example, using ship and buoy data requires smoothingin space and time because these data are sparse. Thus,some small-scale biases will be uncorrected. Furthermore,there are regions, especially at high latitudes, were thereare almost no in situ data and hence bias correction isdifficult. Using one satellite instrument (e.g., AATSR) asa bias correction standard is also risky because the correction is based on one instrument whose accuracy candeteriorate with time or even fail completely.The bias correction was performed using empirical orthogonal teleconnection (EOT) functions (see Van denDool et al. 2000). Smith and Reynolds (2003) used the SSTanomalies from Reynolds et al. (2002) analysis to definea set of 130 spatial EOT modes. To determine the satellitebiases, SST anomalies were computed separately for satellite and in situ data anomalies for a 15-day period on a 28spatial grid. EOT modes were then independently fit tothe two anomaly datasets with the restriction that modeswere not used unless the data coverage for that mode wereadequate for both the in situ and satellite anomaly fields.The restriction and other details of this procedure aredescribed in detail in Reynolds et al. (2007). The difference between the two reconstructed EOT fitted fields was
158JOURNAL OF CLIMATEVOLUME 23FIG. 6. Average daily satellite bias with respect to the OI for June, July, and August for2006–08. (top left) AVHRR NOAA-17, (top right) AVHRR NOAA-18, (middle left) AATSR,(middle right) AMSR, (bottom left) ascending TMI, and (bottom right) descending TMI data.then defined as the satellite bias adjustment. Because theEOT bias correction cannot be carried out without adequate in situ data, a zonal bias correction is made at highsouthern and northern latitudes were the EOT modescannot be used. The adjustment was applied separatelyfor day and night for each satellite instrument. The corrected satellite data were then used in the daily OI.In the comparison to follow, the daily OI AMSR1AVHRR analysis will be used as the standard. It wouldbe better to use the buoy and corrected ship data directly. However, the number of direct comparisons wouldbe greatly reduced because of the scarcity of in situdata and the need to restrict comparisons to collocated space and time data pairs. To better justify thechoice of the AMSR1AVHRR analysis instead ofthe in situ data, the uncorrected ship and buoy datawere compared with the daily OI analysis using AMSR1AVHRR data. Here daily ship and buoy observationswere averaged onto a 1/ 48 grid and subtracted fromthe daily analysis at the same grid point. The dailyzonal difference is shown for three bands in Fig. 1. Theship variability is larger than the buoys as expected
1 JANUARY 2010REYNOLDS ET AL.159FIG. 7. As in Fig. 6, but for the average corrected daily satellite bias with respect to the OI forJune, July, and August for 2006–08.(Reynolds and Smith 1994) and the ship variability inthe 908–208S band is larger than the ship variabilityin the other bands because of the limited ship traffic inthe southernmost band. The average uncorrected shipbiases for the three bands from south to north are 0.088,0.138, and 0.188C. The average buoy biases south tonorth are 0.008, 0.028, and 0.028C. The ship and buoybiases should be 0.148 and 08C, respectively. Thus,the AMSR1AVHRR analysis can be expected to bea satisfactory satellite standard for comparison. However, there will be regions with sparse in situ data orregions where biases have small spatial scales. In thosecases the AMSR1AVHRR analysis will not be corrected properly as will be discussed in more detaillater. However, with these restrictions in mind, ‘‘bias’’will be defined as the difference with respect to theAMSR1AVHRR daily OI for the remainder of thispaper.First, it is useful to examine the coverage of differentsatellite and in situ data. The coverage was computed asa percentage of 1/ 48 ocean boxes with data comparedto the total number of ocean boxes. Here boxes wereweighted by the cosine of the latitude, and boxes covered by sea ice are counted as ocean boxes. The averageglobal and tropical daily coverage for 2006–08 is shownin Table 1 for AVHRR [(National Oceanic and Atmospheric Administration) satellites NOAA-17 and NOAA-18]AMSR, AATSR, TMI, ships and buoys. The globalAVHRR had typical daytime coverage near 10%, withnighttime coverage 2%–3% higher. Global daytime
160JOURNAL OF CLIMATEVOLUME 23FIG. 8. Four daily SST analyses for 14 Jan 2007. The daily OI using (top left) AVHRR only, (top right)AATSR only, (bottom left) AMSR only, and (bottom right) AMSR1AVHRR.AATSR coverage was just above 5% for day and nighttime. The AATSR coverage (see Table 1) is roughlyhalf that of AVHRR because the AATSR swath widthis narrower. The global AMSR coverage was between40% for daytime, with nighttime coverage 10% higher.(AVHRR and AMSR daytime coverage is lower relativeto night due to sun glint. In addition, the AVHRR daytime coverage is further reduced by defining solar anglesless than 758 as day; A. Ignatov 2009, personal communication.) The TMI coverage was nearly 30%, lower thanAMSR because TMI data were only used between 358Sand 358N. The tropical coverage shows that the AMSRand TMI coverage was very similar. Satellite data all haveat least 10 times the coverage of either ships or buoys.To examine global satellite biases, daytime and nighttime differences were computed with respect to theAMSR1AVHRR daily OI. These differences will henceforth be referred to as biases. The average daytimebiases for 2006–08 are shown in Fig. 2. NOAA-17and AATSR have morning equatorial crossings, whileNOAA-18 and AMSR have afternoon equatorial crossings. Thus, the diurnal cycle should impact both NOAA-18and AMSR as shown by the warmer biases in the figurebetween roughly 608S and 608N. However, the NOAA-18biases in this region were larger than the AMSR values. Also the AMSR biases tended to be more positivethan the NOAA-17 biases. Outside of this range and inthe Davis Strait (between Greenland and Canada), insitu observations were low and it is difficult to knowwhich differences are actually biases. AATSR had thelargest positive biases at latitudes north of 708N andnegative biases south of 608S. However, in situ datawere sparse in these regions so the analysis accuracy isuncertain.The standard deviation of the daytime biases is shownin Fig. 3 for June–August 2006–08. AATSR showedlarger values than any of the other products north of358N. This may be due to AATSR’s reduced samplingcompared to the others. For other seasons for day andfor all seasons for night, the AATSR standard deviationwas not especially larger than the other products.The average nighttime biases for 2006–08 are shownin Fig. 4. The nighttime biases are especially importantbecause there is no diurnal warming signal within them.As expected, nighttime biases are smaller than thedaytime biases. The buoy and corrected in situ data usedin the AMSR1AVHRR daily OI are based on 15 daysof data. This strongly suppressed any diurnal cycle in thedaily OI. The consistent negative biases in the easternequatorial Pacific for all nighttime satellite productssuggest that the bias corrections in the daily OI may notbe correct there. In addition, it is not clear why both
1 JANUARY 2010REYNOLDS ET AL.161FIG. 9. Four daily SST analyses for 28 Feb 2008. The daily OI using (top left) AVHRR only, (top right)AATSR only, (bottom left) AMSR only, and (bottom right) TMI1AVHRR.AVHRR biases near 608S were positive and why theywere larger for NOAA-18. AATSR had the largestnegative biases at latitudes north of 708N and south of608S. To examine these biases in more detail, the nighttime zonal averages are shown in Fig. 5. The zonal biaseswere only shown between 608S and 608N to help ensurethat there was sufficient in situ data to define the biases.However, even if the reference OI is not perfect, thisfigure makes it clear that average zonal differences amongsatellite products were typically 0.18C and may exceedthat value south of 508S and north of 508N.It is more difficult to separate the TMI biases into dayand night because the TRMM satellite is not sun synchronous and because the TMI retrievals are restrictedto the tropics. Thus, biases are shown for a smaller regionin the tropical Atlantic in Fig. 6 where TMI ascendingand descending orbits were added to the nighttime fieldsshown in Fig. 4. Months of June, July, and August areshown because that is period when IR retrievals may bebiased cold due to large troposphere aerosols from dustblown off the Sahara Desert (see May et al. 1992; VázquezCuervo et al. 2004). The nighttime negative biases forboth NOAA-17 and NOAA-18 were very similar although NOAA-18 biases were more negative. Differences between TMI descending and ascending were veryclose as expected since both descending and ascendingparts of the orbit equally sample the diurnal cycle.Aerosols do not impact MW retrievals and the AATSRdual view can compensate for them, although the current retrieval appears to overcorrect resulting in smallpositive biases in regions of high tropospheric aerosol.Therefore, negative biases should only be expected inAVHRR, which are clearly demonstrated in the figure.The AMSR and TMI biases were even smaller than theIR products. Some of the warm biases off the coast ofAfrica in TMI may be due to diurnal warming, which isincluded in the TMI data. However, there is clearly landcontamination in the TMI retrievals. The relative smallscales of the biases cannot be eliminated by the largescale daily OI bias correction procedure. This can beclearly seen in Fig. 7, which uses the bias-corrected data.Here all biases are reduced from those in Fig. 6 except forthe TMI coastal biases. In future analyses, an extendedland–sea mask, available in the GHRSST TMI data asa quality flag, must be used to eliminate the coastal TMIvalues before they are used in the analysis.4. Special daily OI analysesTo determine how the data impacted the analysis,several additional daily OI version 2 analyses were computed: AMSR only, AATSR only, and TMI1AVHRR.
162JOURNAL OF CLIMATEVOLUME 23FIG. 10. Four daily SST analyses for 28 Jan 2007. The daily OI using (top left) AVHRR only, (top right)AMSR1AVHRR, (bottom left) AMSR only, and (bottom right) TMI1AVHRR.TMI was not analyzed separately because TMI wasonly used from 358S to 358N. These analyses were compared with the operational version 2 AVHRR-only andAMSR1AVHRR analyses. All satellite data were biascorrected using in situ data before being used in any ofthe OI analyses.Although AATSR reduced biases in uncorrectedareas, it should be used with other products in a dailyanalysis. This can be clearly shown in Fig. 8. In wintercold coastal water lies off the Carolina Coast between theGulf Stream and the coast. The figure shows that the coldwater is not properly resolved in the AATSR-onlyanalysis. The AATSR-only analysis has trouble resolvingthe colder water because of differential cloud screeningthat flags clear-sky cold water as being cloudy (e.g., seeMerchant et al. 2005). It is also not resolved in theAMSR-only analysis because MW retrievals cannot bemade near land. In addition, the warm water local maximum temperatures along the axis of the flow of theGulf Stream appear smoother in the daily OI analysesusing AMSR, a little rougher in the AVHRR-only analysis, and roughest in the AATSR-only analysis. In theAATSR-only analysis a large bull’s-eye occurs at roughly388N and 638W. This strengthened in the AATSR-onlyanalysis with time and persisted until the first week inFebruary. It also appeared in the AVHRR-only analysisalthough it was a little weaker and disappeared a fewdays earlier. The bull’s-eye was due to bad moored buoydata. The bad data impacted the analyses using IR databecause these data were sparse in this region due towinter cloud cover. Because MW data are not impactedby cloud cover, the AMSR-only and AMSR1AVHRRanalyses were able to compensate for the bad buoy data.(TMI was not able to impact the results at 388N becauseTMI data were not used north of 358N.)In the tropics, TMI had both a positive and negative impact. Figure 9 shows the negative impact for28 February 2007. Here, the AVHRR-only, AATSR-only,and AMSR-only analyses were very similar. However,the TMI1AVHRR analysis showed higher temperatures near the land. This was especially evident near theSolomon Islands (which lie east of New Guinea between1458 and 1608E). The TMI bias was due to land contamination also illustrated in Figs. 6 and 7. As mentionedearlier the scale of the land contamination was too smallto be corrected by the satellite bias correction procedure.Although lower biases did occur on other days, the example shown in Figs. 6 and 7 was not unique. A land–seamask, which excluded more coastal regions would eliminate the land contamination from the TMI data.It is easier to document the positive benefits ofAMSR than TMI data, because AMSR retrievals areavailable in the strong gradients of western boundarycurrents where winter cloud cover can severely limit IR
1 JANUARY 2010REYNOLDS ET AL.163FIG A1. Scatterplot of global collocated average monthly ship vs buoy anomaly for January 1989–December 2006. The first 9 yr are shown in the black and the second 9 yr are shown in red. Least squareslinear fits for the two periods are also shown.retrievals. However, a clear example of the benefit ofTMI can be seen in equatorial eastern Pacific just westof the Galapagos Islands as shown in Fig. 10. Here thefrontal boundary just north of the equator was noisy inthe AVHRR-only analysis. In particular, note the frontbetween 1008 and 958W. The noise occurred because IRretrievals are reduced by cloud cover while the MWretrievals are only reduced by precipitation. Thus, thefrontal feature looks more coherent in the AMSR,AMSR1AVHRR, and TMI1AVHRR analyses.5. Conclusions and recommendationsThe results show that the AATSR IR retrievals area high-quality product. Overall AATSR biases with respect to in situ data are lower than or as a low as theAVHRR (NOAA-17 and NOAA-18) and AMSR satellite retrievals between 508S and 508N. Furthermore, thedual-coverage algorithm reduces the influence of aerosolcontamination. North of 508N there do appear to be positive daytime and negative nighttime biases at very highlatitudes, as well as high variability in summer daytimeretrievals. South of 508S there are consistent negativebiases and both daytime and nighttime retrievals. However, as was noted earlier, the AATSR biases in highlatitude regions are difficult to verify using independentin situ data because of the sparseness of in situ data inthese regions. In addition, as the AATSR swath is narrower than that of AVHRR, it is recommended thatAATSR be used with other satellite data in analyses. Theresults show that using the present AATSR product asa bias standard may lead to analysis biases, and so it isalways necessary to continue to monitor AATSR biaseswith buoy data to ensure that instrument accuracy doesnot deteriorate. Also, it is important to point out that buoydata have an advantage of being made by independentinstruments. Thus, the bad buoy that was shown in Fig. 8would not be able to bias the entire analysis. However,buoy data are much sparser than AATSR retrievals, andthere are some regions without adequate in situ sampling,and so a combination of AATSR and in situ data mayprovide the best reference source for the analysis.TMI data were shown to have advantages and disadvantages. TMI data have small-scale biases from landcontamination. These data can easily be removed by amodifying the land–sea mask to remove more coastal
164JOURNAL OF CLIMATEregions. However, TMI can significantly improve openocean coverage in regions where IR retrievals are reducedby cloud cover. AMSR microwave data have a strongimpact on analyses in midlatitudes particularly in highgradient regions such as the Gulf Stream. TMI does nothave this impact because accurate TMI retrievals arelimited to the tropics. Thus, when TMI was added toAVHRR there was no large variability increase as therewas when AMSR was added to AVHRR. Therefore, itis not essential that a separate version of the daily OIanalysis be maintained with and without TMI data.Acknowledgments. We are grateful to NCDC and theNOAA/Office of Global Programs, which provided partial support for this work. The graphics were computedusing the Grid Analysis and Display System (GrADS;http://grads.iges.org/grads), Center for Ocean–Land–Atmosphere Studies. We also thank Tom Smith, KenKnapp, and Huai-Min Zhang and two anonymous reviewers for their constructive advice. Operational SSTdata from AATSR is provided by the European SpaceAgency (ESA; http://www.envisat.esa.int). G. Corlettis funded by the U.K. Department of Energy andClimate Change (DECC) through Space ConneXionsContract 2004-03-001/CPEG10. C. Gentemann’s workwas funded by NASA Physical Oceanography GrantNNH08CC60C.APPENDIXShip SST Biases with Respect to BuoysAs discussed in Reynolds and Smith (1994) andReynolds et al. (200
Average percentage of global ocean 1/48 boxes with daily data to total ocean boxes. The boxes are weighted by the cosine of latitude; boxes covered with sea ice are counted as ocean boxes. Type of data Coverage: 908S-908N Coverage: 208S-208N Buoy 0.5% 0.4% Ship 0.3% 0.2% Day AVHRR: NOAA-17 9.9% 11.2% Night AVHRR: NOAA-17 12.9% 16.9%