Transcription
PRODUCT DETAILSEuropean Retirement Industry 2020Addressing Pensions’ Evolving NeedsIncluded with Purchasey Key findingsy Digital report in PDF formaty Unlimited online firm-wide access y Analyst supporty Interactive Report Dashboardsy Exhibits in ExcelOVERVIEW & METHODOLOGYCerulli Associates’ first iteration of the European Retirement Industry builds on the legacy ofthe European Institutional Dynamics report and explores the European retirement landscape ingreater detail than ever before. It covers key themes shaping the market, including the growingdemand for fiduciary management, the rising adoption of defined contribution (DC) pensions, feepressure, and outsourcing of investment management. It provides readers a holistic overview of theopportunities and challenges in the European retirement industry, including the opportunity set forasset managers, and explores seven main markets in greater depth, namely the U.K., Netherlands,Switzerland, Germany, France, Italy, and Sweden.The report’s analysis centers on proprietary research that includes more than 80 qualitativeinterviews with pension trustees, investment consultants, search consultants, fiduciary managers,and institutional asset managers. In addition, the report leverages three proprietary surveys offiduciary managers, institutional asset managers, and pension funds to provide analysis anddiscussion of the latest developments in the region’s retirement industry.USE THIS REPORT TOy Review the European retirement industry’s size and growth projections, as well as managers’plans for addressing pensions’ needsy Evaluate the opportunity that exists for fiduciary managers across Europe, with particularattention on the U.K., given recent regulatory developmentsy Gain an understanding of the main drivers of fee pressure, how asset managers are respondingto fee pressure, and what is required to remain competitive in the evolving landscapey Outline the key themes in the U.K.’s DC market, including the uptake of responsible investmentproducts in default funds, shifting market structures in relation to consolidation and growingprominence of master trusts, and the role of private assetsQUESTIONS ANSWEREDy What opportunity do European pension markets offer asset managers and what is needed tomeet their evolving needs?y How should fiduciary managers position themselves to win business from the growing marketopportunity?y How are managers setting their fee levels, how do they structure their discounting strategies, andhow are they responding to fee pressure?y What products do asset managers need to develop to win assets in Europe’s evolving DC market?y How are liability-driven investment solutions evolving and what is the opportunity set for cashflow driven investments?Cerulli Associates info@cerulli.com www.cerulli.comInteractive ReportDashboardsInteract and explore selectreport data with Cerulli’svisualization tool.y European Retirement Landscape: Review in-depth sizing ofthe retirement market in Europe with pension assets undermanagement (AUM), outsourced pension assets, and DC AUM bycountry and year. Compare retirement AUM and asset allocationbreakdowns across major European markets.y Fiduciary Management: Analyze historical and projected fiduciarymanagement AUM, levels of opportunity for winning assets, anddrivers of business in the Netherlands and the U.K. Additionally,evaluate managers’ ways of improving competitiveness, types offiduciary solutions offered, and the proportion of assets managedin-house.y Fee Landscape: Understand expected changes in outsourcing bypension funds across the major markets in Europe and use a heatmap to gain insight into the degrees of fee pressure on a countryby-country basis. Explore asset managers’ sentiments on the mainfactors discounting mandates and the levels of fee pressure acrossgeneral accounts and pension funds.
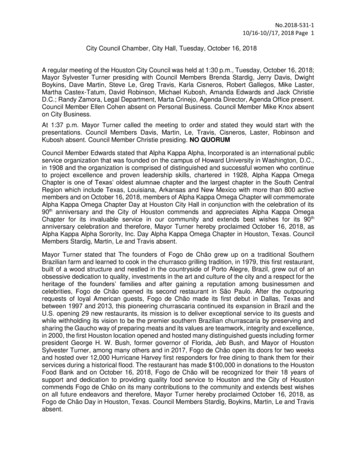
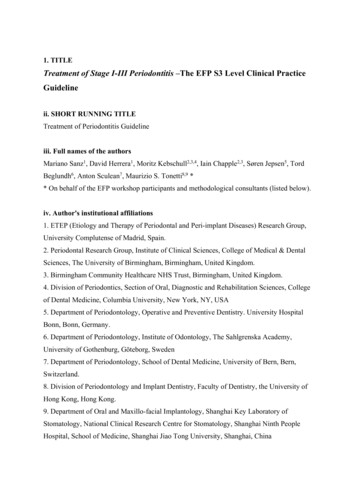
European OverviewChapter 4Exhibit 4.04Asset Managers: Level of Demand Expected for Cash-Flow Driven Investing Solutions by Market, 2020Source: Cerulli any8.3%7.7%7.7%SwedenItalyFranceSwitzerland As pension schemes mature and become cash-flow negative, they are increasingly focusing on CDI. For example, 87% of the asset managersCerulli surveyed expect significant demand for CDI from pensions in the UK, although the country’s CDI market is still in its early stages. In contrast,opportunities in the UK liability-driven investment (LDI) market are expected to come largely from manager turnover. Cerulli’s research shows that fees for CDI mandates can be between 7 basis points (bps) and 15 bps, depending on the asset classes used and thelevel of customization required. The UK LDI market is more homogeneous than most when it comes to fee levels. However, some LDI managershave started to charge for ancillary services, which is not something that consultants particularly like and could lead to changes in the LDI managerspensions use.Key Implication: Asset managers are starting to focus more on developing CDI solutions for smaller pension schemes and those that can providetailored pooled solutions will see most success. Smaller pension schemes are typically underfunded and do not want to sacrifice growth, so solutionsthat offer a combination of liability hedging and exposure to growth in a single pooled fund could gain traction over the next three to five years.The Cerulli Report European Retirement Industry 202097
Table of ContentsTable of Contents: ExpandedClick for InteractiveReport Dashboardof indicated exibitKey Questions Answered . . . . . . . . . . . . . . . . . . . . . . . . . . . . . . . . . . . . . . . . . . . . . . . . . . . . . . . . . . . . . . . . . . . . . . . . . 161. Which European markets offer the most opportunities for fiduciary managers? . . . . . . . . . . . . . . . . . . . . . . . . . . . . . . . . . . . . . . . . . . . . 162. How are managers responding to increased fee pressure from pension schemes? . . . . . . . . . . . . . . . . . . . . . . . . . . . . . . . . . . . . . . . . . . 173. Which sales channels do managers believe are most important when selling DC products? . . . . . . . . . . . . . . . . . . . . . . . . . . . . . . . . . . 184. What information do UK pensions expect managers to provide on their responsible investment practices? . . . . . . . . . . . . . . . . . . . . . . . . . . . . . 195. What impact will pension reforms have on Dutch pension funds’ asset allocation? . . . . . . . . . . . . . . . . . . . . . . . . . . . . . . . . . . . . . . . . . . 206. How do German liberal profession pension schemes allocate their assets? . . . . . . . . . . . . . . . . . . . . . . . . . . . . . . . . . . . . . . . . . . . . . . . . 21Exchange Rates . . . . . . . . . . . . . . . . . . . . . . . . . . . . . . . . . . . . . . . . . . . . . . . . . . . . . . . . . . . . . . . . . . . . . . . . . . . . . . . . . 22Chapter 1: Evolution, Challenges, and Growth in the Fiduciary Industry . . . . . . . . . . . . . . . . . . . . . . . . . . . . . . . . 23Exhibit 1.01. UK Pension and Fiduciary Assets Under Management, 2015–2024E . . . . . . . . . . . . . . . . . . . . . . . . . . . . . . . . . . . . . . . . . . . . . . 25Exhibit 1.02. UK Pensions: Main Drivers for Switching to a Fiduciary Management Model, 2020 . . . . . . . . . . . . . . . . . . . . . . . . . . . . . . . . . 26Exhibit 1.03. Dutch Fiduciary Management Assets Under Management, 2015–2024E . . . . . . . . . . . . . . . . . . . . . . . . . . . . . . . . . . . . . . . . . . 26Exhibit 1.04. Vehicles Fiduciary Managers Offer When Constructing Client Portfolios, 2020 . . . . . . . . . . . . . . . . . . . . . . . . . . . . . . . . . . . . . 27Exhibit 1.05. UK Pensions’ Level of Portfolio Customization, 2020 . . . . . . . . . . . . . . . . . . . . . . . . . . . . . . . . . . . . . . . . . . . . . . . . . . . . . . . . . . . 27Exhibit 1.06. Fiduciary Managers: Opportunities for Winning Business Over the Next 12–24 Months and the Next Three toFive Years by Market, 2020 . . . . . . . . . . . . . . . . . . . . . . . . . . . . . . . . . . . . . . . . . . . . . . . . . . . . . . . . . . . . . . . . . . . . . . . . . . . . . . . . . 28Exhibit 1.07. Fiduciary Managers’ Views on What Will Drive New Fiduciary Business in the UK and the Netherlands, 2020 . . . . . . . . . . . 29Exhibit 1.08. Fiduciary Managers’ Views on the Size of the Clients That Will Drive Growth in the UK, 2020 . . . . . . . . . . . . . . . . . . . . . . . . . 30Exhibit 1.09. Fiduciary Managers’ Views on the Importance of Total Portfolio and Sleeve Portfolio Fiduciary ManagementServices Over the Next 24 Months by Client Type, 2020 . . . . . . . . . . . . . . . . . . . . . . . . . . . . . . . . . . . . . . . . . . . . . . . . . . . . . . . . 31Exhibit 1.10. UK Pensions’ Plans to Split Fiduciary Management Mandates, 2020 . . . . . . . . . . . . . . . . . . . . . . . . . . . . . . . . . . . . . . . . . . . . . . 32Exhibit 1.11. Fiduciary Managers’ Views on the Main Challenges to Their Business, 2020 . . . . . . . . . . . . . . . . . . . . . . . . . . . . . . . . . . . . . . . 33Exhibit 1.12. Fiduciary Managers’ Plans to Improve Their Competitiveness Over the Next 12 Months, 2020 . . . . . . . . . . . . . . . . . . . . . . . 34Exhibit 1.13. Approaches Fiduciary Managers Take to Avoid Conflicts of Interests, 2020 . . . . . . . . . . . . . . . . . . . . . . . . . . . . . . . . . . . . . . . . 35Exhibit 1.14. Types of Platform Fiduciary Managers Offer and Proportion of Assets Managed In-House, 2020 . . . . . . . . . . . . . . . . . . . . . 36Exhibit 1.15. Fiduciary Managers: Reductions of Fees in the UK and the Netherlands in the Past Three Years, 2020 . . . . . . . . . . . . . . . . 37Exhibit 1.16. Fiduciary Managers’ Current Fee Structures in the UK and the Netherlands, 2020 . . . . . . . . . . . . . . . . . . . . . . . . . . . . . . . . . . 38Exhibit 1.17. Fiduciary Managers’ UK Fees by Client Size, 2020 . . . . . . . . . . . . . . . . . . . . . . . . . . . . . . . . . . . . . . . . . . . . . . . . . . . . . . . . . . . . . . 39Exhibit 1.18. UK Pensions’ Approaches When Adopting Fiduciary Management for the First Time, 2018 . . . . . . . . . . . . . . . . . . . . . . . . . . 40The Cerulli Report European Retirement Industry 20209
Table of ContentsExhibit 1.19. UK Pensions’ Experience of Running Tender Exercises, Switching, and Retendering, 2018 . . . . . . . . . . . . . . . . . . . . . . . . . . . 41Exhibit 1.20. UK Pensions’ Time Frames to Retender, 2020 . . . . . . . . . . . . . . . . . . . . . . . . . . . . . . . . . . . . . . . . . . . . . . . . . . . . . . . . . . . . . . . . . 42Exhibit 1.21. UK Pensions’ Levels of Satisfaction With Their Fiduciary Management Providers, 2020 . . . . . . . . . . . . . . . . . . . . . . . . . . . . . . 42Exhibit 1.22. UK Pensions’ Main Reasons for Retendering or Switching Fiduciary Management Provider, 2020 . . . . . . . . . . . . . . . . . . . . 42Exhibit 1.23. UK Pensions’ Key Considerations When Choosing Between Fiduciary Managers, 2020 . . . . . . . . . . . . . . . . . . . . . . . . . . . . . . 43Exhibit 1.24. UK Pensions’ Views on the Most Important Investment Capabilities When Selecting a Fiduciary Manager, 2020 . . . . . . . . 44Exhibit 1.25. Fiduciary Managers’ Engagement and Experience with Search Consultants in the UK, 2020 . . . . . . . . . . . . . . . . . . . . . . . . . 45Exhibit 1.26. UK Pensions’ Plans to Use a Search Consultant to Find a Fiduciary Manager, 2020 . . . . . . . . . . . . . . . . . . . . . . . . . . . . . . . . . 45Chapter 2: Fee Pressure and Outsourcing . . . . . . . . . . . . . . . . . . . . . . . . . . . . . . . . . . . . . . . . . . . . . . . . . . . . . . . . . . . 48Exhibit 2.01. European Pensions’ Outsourcing, 2019 . . . . . . . . . . . . . . . . . . . . . . . . . . . . . . . . . . . . . . . . . . . . . . . . . . . . . . . . . . . . . . . . . . . . . . 50Exhibit 2.02. Asset Managers’ Main Challenges When Working with European Pensions, 2020 . . . . . . . . . . . . . . . . . . . . . . . . . . . . . . . . . . 51Exhibit 2.03. Asset Managers: Main Factors When Discounting Institutional Segregated Mandates, 2020 . . . . . . . . . . . . . . . . . . . . . . . . . 52Exhibit 2.04. Asset Managers: Discounting Range Allowed for Lead Relationship Manager, 2020 . . . . . . . . . . . . . . . . . . . . . . . . . . . . . . . . 53Exhibit 2.05. Asset Managers: Pension Fee Pressure by Country, 2020 . . . . . . . . . . . . . . . . . . . . . . . . . . . . . . . . . . . . . . . . . . . . . . . . . . . . . . . 54Exhibit 2.06. Asset Managers: How Fee Pressure Is Changing by Asset Class, 2020 . . . . . . . . . . . . . . . . . . . . . . . . . . . . . . . . . . . . . . . . . . . . 55Exhibit 2.07. Average Segregated Mandate and Commingled Fund Fees by Asset Class and Mandate Size, 2020 . . . . . . . . . . . . . . . . . . . 56Exhibit 2.08. Average Management Fees for Europe-Based Managers’ Private Equity and Private Debt Strategies, 2014–2019 . . . . . . . 57Exhibit 2.09. Actions European Pensions Expect to Take to Address Asset Management Fees Over the Next 12–24 Months, 2020 . . . . 59Exhibit 2.10. European Pensions: Main Arguments Used to Lower Asset Management Fees, 2020 . . . . . . . . . . . . . . . . . . . . . . . . . . . . . . . 60Exhibit 2.11. European Passive Investment Landscape by Market, 2020 . . . . . . . . . . . . . . . . . . . . . . . . . . . . . . . . . . . . . . . . . . . . . . . . . . . . . . 61Exhibit 2.12. Actions Asset Managers Expect to Take on Fees Over the Next 12 Months, 2020 . . . . . . . . . . . . . . . . . . . . . . . . . . . . . . . . . . . 62Exhibit 2.13. European Pensions’ Views on Asset Management Fee Topics, 2020 . . . . . . . . . . . . . . . . . . . . . . . . . . . . . . . . . . . . . . . . . . . . . . 63Exhibit 2.14. Actions Asset Managers Expect to Take Over the Next 12–24 Months to Protect Profit Margins in the EuropeanInstitutional Market, 2020 . . . . . . . . . . . . . . . . . . . . . . . . . . . . . . . . . . . . . . . . . . . . . . . . . . . . . . . . . . . . . . . . . . . . . . . . . . . . . . . . . 64Chapter 3: The Rise of the UK Defined Contribution Market . . . . . . . . . . . . . . . . . . . . . . . . . . . . . . . . . . . . . . . . . . . 65Exhibit 3.01. European Defined Contribution Assets Under Management, 2015–2024E . . . . . . . . . . . . . . . . . . . . . . . . . . . . . . . . . . . . . . . . 67Exhibit 3.02. Strategic Priorities for UK Defined Contribution Pension Schemes Over the Next 12–24 Months, 2020 . . . . . . . . . . . . . . . . 68Exhibit 3.03. Asset Managers’ Main Channels for Selling Defined Contribution Products by Market Over the Next Three toFive Years, 2020 . . . . . . . . . . . . . . . . . . . . . . . . . . . . . . . . . . . . . . . . . . . . . . . . . . . . . . . . . . . . . . . . . . . . . . . . . . . . . . . . . . . . . . . . . . . 69Exhibit 3.04. UK Defined Contribution Pensions’ Approaches to Creating Their Standard Default Funds, 2020 . . . . . . . . . . . . . . . . . . . . . 70Exhibit 3.05. Default Funds Asset Managers Plan to Develop Over the Next 12–24 Months by Market, 2020 . . . . . . . . . . . . . . . . . . . . . . 72Exhibit 3.06. Current Proportion of UK Defined Contribution Pensions’ Default Funds Invested Into Passive and ActiveInvestments and Anticipated Change Over the Next 12–24 Months, 2020 . . . . . . . . . . . . . . . . . . . . . . . . . . . . . . . . . . . . . . . . 73Exhibit 3.07. Default Fund Design: Selected Master Trusts’ Asset Allocations, 2020 . . . . . . . . . . . . . . . . . . . . . . . . . . . . . . . . . . . . . . . . . . . . 7410The Cerulli Report European Retirement Industry 2020
Table of ContentsExhibit 3.08. Top 10 Diversified Growth Funds’ Assets Under Management and Net Flows, 2015–August 2020 . . . . . . . . . . . . . . . . . . . . 75Exhibit 3.09. UK Defined Contribution Pensions’ Priorities for Standard Default Fund Investments Over the Next12–24 Months, 2020 . . . . . . . . . . . . . . . . . . . . . . . . . . . . . . . . . . . . . . . . . . . . . . . . . . . . . . . . . . . . . . . . . . . . . . . . . . . . . . . . . . . . . . . 76Exhibit 3.10. UK Defined Contribution Pensions’ Positions on Introducing Illiquid Investments Into Their Default Funds, 2020 . . . . . . . 77Exhibit 3.11. UK Defined Contribution Pensions’ Views on the Key Barriers to Increasing the Percentage of Holdings inIlliquid Assets, 2020 . . . . . . . . . . . . . . . . . . . . . . . . . . . . . . . . . . . . . . . . . . . . . . . . . . . . . . . . . . . . . . . . . . . . . . . . . . . . . . . . . . . . . . . 78Exhibit 3.12. Fund Structures Asset Managers Plan to Use When Developing Illiquid Products for Defined ContributionSchemes in the UK Over the Next 12–24 Months, 2020 . . . . . . . . . . . . . . . . . . . . . . . . . . . . . . . . . . . . . . . . . . . . . . . . . . . . . . . . . 79Exhibit 3.13. Number of Self-Select Funds UK Defined Contribution Pensions Provide and Number of Asset Managers TheyUse Currently and Expected Changes Over the Next 12–24 Months, 2020 . . . . . . . . . . . . . . . . . . . . . . . . . . . . . . . . . . . . . . . . . 80Exhibit 3.14. UK Defined Contribution Pensions’ Planned Changes to Their Self-Select Fund Range Over the Next12–24 Months, 2020 . . . . . . . . . . . . . . . . . . . . . . . . . . . . . . . . . . . . . . . . . . . . . . . . . . . . . . . . . . . . . . . . . . . . . . . . . . . . . . . . . . . . . . . 81Exhibit 3.15. Number of Self-Select Funds Master Trusts Provide and the Asset Managers They Use, 2020 . . . . . . . . . . . . . . . . . . . . . . . . 82Exhibit 3.16. Asset Managers’ Priorities for Their Defined Contribution Business, 2020 . . . . . . . . . . . . . . . . . . . . . . . . . . . . . . . . . . . . . . . . . 83Exhibit 3.17. UK Defined Contribution Pensions’ Approaches to ESG Integration, 2020 . . . . . . . . . . . . . . . . . . . . . . . . . . . . . . . . . . . . . . . . . 84Exhibit 3.18. Examples of ESG Funds Master Trusts Are Using in Their Default Strategies and Self-Select Fund Ranges, 2020 . . . . . . . . 85Exhibit 3.19. UK Defined Contribution Pensions’ Current Assumed Outcome at Retirement for Members of Their StandardDefault Funds, 2020 . . . . . . . . . . . . . . . . . . . . . . . . . . . . . . . . . . . . . . . . . . . . . . . . . . . . . . . . . . . . . . . . . . . . . . . . . . . . . . . . . . . . . . . 89Exhibit 3.20. Asset Managers’ Plans to Develop Decumulation Products for the UK Defined Contribution Market Over theNext 12 Months, 2020 . . . . . . . . . . . . . . . . . . . . . . . . . . . . . . . . . . . . . . . . . . . . . . . . . . . . . . . . . . . . . . . . . . . . . . . . . . . . . . . . . . . . . 89Chapter 4: European Overview . . . . . . . . . . . . . . . . . . . . . . . . . . . . . . . . . . . . . . . . . . . . . . . . . . . . . . . . . . . . . . . . . . . . 90Exhibit 4.01. European Pension Assets Under Management, 2015–2024E . . . . . . . . . . . . . . . . . . . . . . . . . . . . . . . . . . . . . . . . . . . . . . . . . . . . 92Exhibit 4.02. European Pension Outsourcing and Market Growth Potential, 2019 . . . . . . . . . . . . . . . . . . . . . . . . . . . . . . . . . . . . . . . . . . . . . 94Exhibit 4.03. European Pensions’ Strategic Investment and Operational Priorities, 2020 . . . . . . . . . . . . . . . . . . . . . . . . . . . . . . . . . . . . . . . . 95Exhibit 4.04. Asset Managers: Level of Demand Expected for Cash-Flow Driven Investing Solutions by Market, 2020 . . . . . . . . . . . . . . . 97Exhibit 4.05. European Pensions: Expected Demand for Private Investments by Asset Class Over the Next 12–24 Months, 2020 . . . . . 98Exhibit 4.06. Cerulli’s Views on the Growth Opportunities in Selected Retirement Markets, 2020, Part One . . . . . . . . . . . . . . . . . . . . . . . 99Exhibit 4.07. Cerulli’s Views on the Growth Opportunities in Selected Retirement Markets, 2020, Part Two . . . . . . . . . . . . . . . . . . . . . . 100Chapter 5: United Kingdom . . . . . . . . . . . . . . . . . . . . . . . . . . . . . . . . . . . . . . . . . . . . . . . . . . . . . . . . . . . . . . . . . . . . . . 101Exhibit 5.01. UK Occupational Pension Assets Under Management, 2015–2019 . . . . . . . . . . . . . . . . . . . . . . . . . . . . . . . . . . . . . . . . . . . . . 103Exhibit 5.02. UK Private Defined Benefit Pension Asset Allocation, 2010–2019 . . . . . . . . . . . . . . . . . . . . . . . . . . . . . . . . . . . . . . . . . . . . . . 104Exhibit 5.03. UK Private Defined Benefit Pension Funding, 2016–August 2020 . . . . . . . . . . . . . . . . . . . . . . . . . . . . . . . . . . . . . . . . . . . . . . 105Exhibit 5.04. UK Private Defined Benefit Pensions’ Allocations to Return-Seeking Assets, 2019 . . . . . . . . . . . . . . . . . . . . . . . . . . . . . . . . 106Exhibit 5.05. UK Public Defined Benefit Pension Asset Allocation and Investment Management Fees, 2015–2019 . . . . . . . . . . . . . . . . 107Exhibit 5.06. LGPS Pooled Assets Under Management and Asset Managers Appointed, 2019 . . . . . . . . . . . . . . . . . . . . . . . . . . . . . . . . . 109The Cerulli Report European Retirement Industry 202011
Table of ContentsExhibit 5.07. UK Defined Contribution Trust Landscape by Scheme Size, 2015–2019 . . . . . . . . . . . . . . . . . . . . . . . . . . . . . . . . . . . . . . . . . 111Exhibit 5.08. Members’ Methods of Accessing Their UK Defined Contribution Pots, 2018–2019 . . . . . . . . . . . . . . . . . . . . . . . . . . . . . . . . 112Exhibit 5.09. UK Pensions’ ESG Integration Approaches and Reporting Requested from Third-Party Managers, 2020 . . . . . . . . . . . . . 113Chapter 6: Netherlands . . . . . . . . . . . . . . . . . . . . . . . . . . . . . . . . . . . . . . . . . . . . . . . . . . . . . . . . . . . . . . . . . . . . . . . . . 115Exhibit 6.01. Dutch Occupational Pension Assets Under Management by Pension Type, 2015–2Q 2020 . . . . . . . . . . . . . . . . . . . . . . . . 117Exhibit 6.02. Dutch Occupational Pension Asset Allocation, 2015–2Q 2020 . . . . . . . . . . . . . . . . . . . . . . . . . . . . . . . . . . . . . . . . . . . . . . . . . 118Exhibit 6.03. Dutch Occupational Pension Funds’ Allocations to Alternatives, 2015–2Q 2020 . . . . . . . . . . . . . . . . . . . . . . . . . . . . . . . . . . 119Exhibit 6.04. Number of Dutch Occupational Pension Funds and Schemes, 2015–2019 . . . . . . . . . . . . . . . . . . . . . . . . . . . . . . . . . . . . . . 120Exhibit 6.05. Premium Pension Institution Landscape, 2015–2Q 2020 . . . . . . . . . . . . . . . . . . . . . . . . . . . . . . . . . . . . . . . . . . . . . . . . . . . . . 122Exhibit 6.06. Dutch Pensions’ Approaches to ESG Integration and Reporting Requested from Third-Party Managers, 2020 . . . . . . . . 123Chapter 7: Switzerland . . . . . . . . . . . . . . . . . . . . . . . . . . . . . . . . . . . . . . . . . . . . . . . . . . . . . . . . . . . . . . . . . . . . . . . . . . 125Exhibit 7.01. Swiss Occupational Pension Assets Under Management and Number of Pension Funds by Type, 2014–2018 . . . . . . . . 127Exhibit 7.02. Swiss Occupational Pension Asset Allocation Breakdown, 2014–2018 . . . . . . . . . . . . . . . . . . . . . . . . . . . . . . . . . . . . . . . . . . 129Exhibit 7.03. Swiss Occupational Pension Asset Allocation by Private Law and Public Law Pensions, 2014–2018 . . . . . . . . . . . . . . . . . 130Exhibit 7.04. Swiss Occupational Pension Funds’ Alternative Allocations, 2010–2018 . . . . . . . . . . . . . . . . . . . . . . . . . . . . . . . . . . . . . . . . . 132Exhibit 7.05. Swiss Pension Funds’ Investment Implementation Strategies, 2019 . . . . . . . . . . . . . . . . . . . . . . . . . . . . . . . . . . . . . . . . . . . . 134Exhibit 7.06. Asset Management Fees for Swiss Pensionskassen’s Cost-Transparent Investments, 2015–2019 . . . . . . . . . . . . . . . . . . . . 135Exhibit 7.07. Swiss Private Pension Assets Under Management by Channel, 2014–2018 . . . . . . . . . . . . . . . . . . . . . . . . . . . . . . . . . . . . . . 136Exhibit 7.08. Swiss Pensions’ Approaches to ESG Integration and Reporting Requested from Third-Party Managers, 2020 . . . . . . . . 137Chapter 8: Germany . . . . . . . . . . . . . . . . . . . . . . . . . . . . . . . . . . . . . . . . . . . . . . . . . . . . . . . . . . . . . . . . . . . . . . . . . . . . 139Exhibit 8.01. German Liberal Profession Pension Schemes, 2018 . . . . . . . . . . . . . . . . . . . . . . . . . . . . . . . . . . . . . . . . . . . . . . . . . . . . . . . . . . 141Exhibit 8.02. German Occupational Pension Assets Under Management by Funding Mechanism, 2014–2018 . . . . . . . . . . . . . . . . . . . 142Exhibit 8.03. German Occupational Pension Asset Allocation Breakdown, 2015–2019 . . . . . . . . . . . . . . . . . . . . . . . . . . . . . . . . . . . . . . . . 144Exhibit 8.04. German Occupational Pension Asset Allocation Breakdown by Vehicle, 2016–2019 . . . . . . . . . . . . . . . . . . . . . . . . . . . . . . 146Exhibit 8.05. Largest 10 Pensionskassen and Pensionsfonds by Assets, 2016–2018 . . . . . . . . . . . . . . . . . . . . . . . . . . . . . . . . . . . . . . . . . . . . 148Exhibit 8.06. German Spezialfonds Landscape, 2015–2019 . . . . . . . . . . . . . . . . . . . . . . . . . . . . . . . . . . . . . . . . . . . . . . . . . . . . . . . . . . . . . . . . 150Exhibit 8.07. Largest 10 Providers of German Spezialfonds and Mandates, 2018–2019 . . . . . . . . . . . . . . . . . . . . . . . . . . . . . . . . . . . . . . . . 152Exhibit 8.08. German Pensions’ Approaches to ESG Integration and Reporting Requested from Third-Party Managers, 2020 . . . . . . 153Chapter 9: France . . . . . . . . . . . . . . . . . . . . . . . . . . . . . . . . . . . . . . . . . . . . . . . . . . . . . . . . . . . . . . . . . . . . . . . . . . . . . . . 155Exhibit 9.01. French Pension Market Assets Under Management, 2014–2018 . . . . . . . . . . . . . . . . . . . . . . . . . . . . . . . . . . . . . . . . . . . . . . . 157Exhibit 9.02. Selected French Pension Funds’ Asset Allocation, 2018 . . . . . . . . . . . . . . . . . . . . . . . . . . . . . . . . . . . . . . . . . . . . . . . . . . . . . . . 15912The Cerulli Report European Retirement Industry 2020
Table of ContentsExhibit 9.03. Products French Asset Managers Plan to Develop for Defined Contribution Pensions Over the Next12–24 Months, 2020 . . . . . . . . . . . . . . . . . . . . . . . . . . . . . . . . . . . . . . . . . . . . . . . . . . . . . . . . . . . . . . . . . . . . . . . . . . . . . . . . . . . . . 160Exhibit 9.04. French Institutional Investors’ Green Investments, 2017–2018 . . . . . . . . . . . . . . . . . . . . . . . . . . . . . . . . . . . . . . . . . . . . . . . . 161Exhibit 9.05. French Pensions’ Approaches to ESG Integration and Reporting Requested from Third-Party Managers, 2020 . . . . . . . 162Chapter 10: Italy . . . . . . . . . . . . . . . . . . . . . . . . . . . . . . . . . . . . . . . . . . . . . . . . . . . . . . . . . . . . . . . . . . . . . . . . . . . . . . . . 164Exhibit 10.01. Italian First-Pillar Pension Landscape, 2014–2018 . . . . . . . . . . . . . . . . . . . . . . . . . . . . . . . . . . . . . . . . . . . . . . . . . . . . . . . . . . 166Exhibit 10.02. Italian Occupational Pension Assets Under Management by Type, 2015–2019 . . . . . . . . . . . . . . . . . . . . . . . . . . . . . . . . . . 168Exhibit 10.03. Number of Occupational Pension Funds in Italy and Average Size, 2010–2019 . . . . . . . . . . . . . . . . . . . . . . . . . . . . . . . . . . 169Exhibit 10.04. Italian Occupational Pension Asset Allocation 2015–2019 . . . . . . . . . . . . . . . . . . . . . . . . . . . . . . . . . . . . . . . . . . . . . . . . . . . . 171Exhibit 10.05. Italian Occupational Pension Funds’ Asset Allocation by Type, 2015–2019 . . . . . . . . . . . . . . . . . . . . . . . . . . . . . . . . . . . . . 172Exhibit 10.06. Closed and Open Pension Fund Assets Under Management by Fund, 2019 . . . . . . . . . . . . . . . . . . . . . . . . . . . . . . . . . . . . 173Exhibit 10.07. Italian Private Pension Assets Under Management and Asset Allocation, 2015–2019 . . . . . . . . . . . . . . . . . . . . . . . . . . . . 175Exhibit 10.08. Italian Pensions’ Approaches to ESG Integration and Reporting Requested From Third-Party Managers, 2020 . . . . . . 176Chapter 11: Sweden . . . . . . . . . . . . . . . . . . . . . . . . . . . . . . . . . . . . . . . . . . . . . . . . . . . . . . . . . . . . . . . . . . . . . . . . . . . . . 178Exhibit 11.01. Swedish and Nordic Pension Assets Under Management, 2015–2019 . . . . . . . . . . . . . . . . . . . . . . . . . . . . . . . . . . . . . . . . . 180Exhibit 11.02. Swedish Buffer Funds’ Asset Allocation Breakdown by Asset Class and Assets Managed Internally, 2015–2019 . . . . . . 181Exhibit 11.03. Swedish Life Insurers’ Asset Allocation, 2015–2019 . . . . . . . . . . . . . . . . . . . . . . . . . . . . . . . . . . . . . . . . . . . . . . . . . . . . . . . . . 183Exhibit 11.04. Swedis
y Unlimited online firm-wide access y Exhibits in Excel y European Retirement Landscape: Review in-depth sizing of the retirement market in Europe with pension assets under management (AUM), outsourced pension assets, and DC AUM by country and year. Compare retirement AUM and asset allocation breakdowns across major European markets.