Transcription
Grain Transportation ReportA weekly publication of the Agricultural Marketing Servicewww.ams.usda.gov/GTRContact UsMay 19, icatorsRailBargeTruckExportsOceanBrazilMexicoGrain Truck/OceanRate AdvisoryDatasetsWEEKLY HIGHLIGHTSFMC Proposes Requiring Free Access to Carriers’ Tariff InformationA new notice of proposed rulemaking (NPRM) by the Federal Maritime Commission (FMC) seeks public comment, on or before June 9,on whether carriers should be required to post their tariffs online and allow access to this information, free of charge. Seven of the 10leading ocean carriers serving the United States already provide this service. FMC believes requiring universal free tariff publicationwould benefit trade by giving shippers more pricing information to consider. In the same NPRM, FMC proposes changing its definition ofco-loading to apply only to less-than-container loads. Furthermore, FMC proposes that documentation for full-container-load shipmentsbe annotated with the names of all non-vessel operating common carriers (NVOCCs) associated with the container’s cargo. Three otherproposed changes in the NPRM would allow NVOCCs to cross-reference certain aspects of other carriers’ terms in their tariffs; clarify theability of NVOCCs to reflect increases in certain charges passed on by other entities without notice; and make other miscellaneousupdates and clarifications to current FMC code.Latest USDA Projections Signal Lower Demand for Grain Transportation in MY 2022/23On May 12, USDA released its May World Agricultural Supply and Demand Estimates report, which contains the agency’s most recentprojections—the first update since February—for the next marketing year (MY), 2022/23. If realized, projected MY 2022/23 soybeanproduction would be a record 4.64 billion bushels. Even when combined with wheat production that is estimated to exceed MY 2021/22,total production of grain (corn, soybeans, and wheat) is projected to decrease 2 percent from MY 2021/22 to MY 2022/23. Domestic useand exports are projected to slip for corn and wheat, but to increase for soybeans. Domestic use and exports of the three crops combinedare predicted to decrease 2 percent and 1 percent, respectively, in MY 2022/23 from 2021/22. Such declines would dampen the demandfor grain transportation.FMCSA Expands Emergency HOS Waiver to Cover PropaneOn May 13, the Federal Motor Carrier Safety Administration (FMCSA) added propane, which is used for grain drying, to its list ofqualifying items in support of emergency relief efforts. First issued in March 2020 for the COVID-19 pandemic, FMCSA’s emergencydeclaration offers regulatory relief for truckers who provide direct assistance. This includes some relief from standard hours-of-service(HOS) regulations. Though modified several times, the emergency declaration, has remained in effect for more than 2 years. The mostrecent extension is set to expire on May 31 and covers feed, ethanol, and fuel.Snapshots by SectorExport SalesFor the week ending May 05, unshipped balances of wheat, corn, and soybeans for marketing year 2021/22 totaled 29.6 million metrictons (mmt), down 1 percent from the same time last year and down 6 percent from the previous week. Net corn export sales were 0.193mmt, down 75 percent from the previous week. Net soybean export sales were 0.144 mmt, down 80 percent from the previous week. Netweekly wheat export sales were 0.014 mmt, down 88 percent from the previous week.RailU.S. Class I railroads originated 22,402 grain carloads during the week ending May 7. This was a 5-percent increase from the previousweek, 11 percent fewer than last year, and 3 percent lower than the 3-year average.SpecialistsAverage May shuttle secondary railcar bids/offers (per car) were 2,425 above tariff for the week ending May 12. This was 582 lessthan last week and 2,546 more than this week last year.SubscriptionInformationBargeFor the week ending May 14, barged grain movements totaled 835,730 tons. This was 7 percent lower than the previous week and 4percent lower than the same period last year.-------------The nextrelease isMay 26, 2022For the week ending May 14, 513 grain barges moved down river—36 fewer barges than the previous week. There were 683 grainbarges unloaded in the New Orleans region, 15 percent more than last week.OceanFor the week ending May 12, 32 oceangoing grain vessels were loaded in the Gulf—6 percent fewer than the same period last year.Within the next 10 days (starting May 13), 50 vessels were expected to be loaded—9 percent fewer than the same period last year.As of May 12, the rate for shipping a metric ton (mt) of grain from the U.S. Gulf to Japan was 82.00. This was 3 percent more than theprevious week. The rate from the Pacific Northwest to Japan was 46.50 per mt, 4 percent more than the previous week.FuelFor the week ending May 16, the U.S. average diesel fuel price decreased 1.0 cents from the previous week to 5.613 per gallon, 236.4cents above the same week last year.Preferred citation: U.S. Department of Agriculture, Agricultural Marketing Service. Grain Transportation Report. May 19, 2022.Web: http://dx.doi.org/10.9752/TS056.05-19-2022
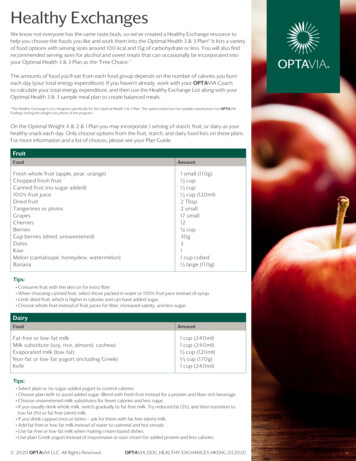
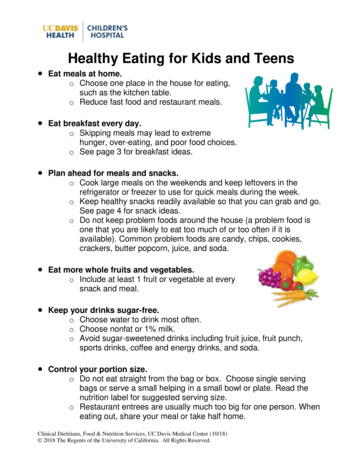
Feature Article/CalendarA Review and Outlook on Ongoing Rail Service IssuesOver the past few months, rail shippers (including agricultural shippers) have raised strong concerns overincreasingly poor service. Despite garnering heightened attention across the industry and from multipleFederal agencies, rail service has not yet shown signs of improvement. This article describes the latest railservice data and highlights recent actions the Surface Transportation Board (STB) has taken to addressservice issues.Metrics Tell the StoryA shortage of labor and locomotive power has resulted in cascading problems through agricultural railsupply chains. Elevators report they have grain to move and cannot purchase more from farmers becauseof a lack of outbound train service. This bottleneck, in turn, has jeopardized downstream customers—such as flour and feed mills and livestock operations—that cannot obtain the grain they need.1 GTRfigure 3 shows the moving average of grain carloads has declined for a few months, falling below the 3year average in recent weeks. According to STB rail service data, fertilizer shipments, like grain carloads,have declined in recent weeks, despite normally peaking at this time of year. Fertilizer shippers havecomplained of railroads restricting their shipments.2 For the week ending May 11, fertilizer shipmentswere 12 percent below the 2018-21 average for the same week. Further reflecting service failures, theaverage dwell time in an origination yard was 68 percent above average for grain trains and 128 percentabove average for ethanol trains. Ethanol shippers report having to slow or even shut down their plantsbecause of poor rail service.3FMLM. Since the implementation of Precision Scheduled Railroading (PSR), starting in 2017, railshippers have expressed concern over rail service on the first- and last-mile (FMLM) portions ofshipments, where railroads and shippers interact.4 Notably, STB’s existing rail service metrics do notcapture many aspects of FMLM service. However, FMLM service is partly captured with one metric: thenumber of empty cars shippers have ordered that railroads have not yet filled. This year, the number ofunfilled grain car orders (for manifest service) has been at its highest level since STB’s data collectionstarted in 2017. In the latest week of data,unfilled orders were 265 percent aboveaverage (fig. 1).Secondary market. Shippers usingcommon (public tariff, non-contract) railcarriage can order rail cars in a fewdifferent ways. For instance, they can orderthem on a queued, first-come-first-servedbasis or through a lottery. Alternatively, forshippers to better ensure they receive thecars they need, some turn to the railcarauction markets. Shippers make bids eitherdirectly to the railroads that offer cars inprimary auction markets, or to othershippers in the secondary market. Rates inthe secondary market show how much1March 24, 2022, letter from the National Grain and Feed Association to the STB Chair.April 14, 2022, press release from CF Industries, “Union Pacific Curtails Fertilizer Shipments, Delaying Deliveries andPreventing New Rail Orders from Being Taken.”3“Renewable Fuels” presentation at STB’s April 20, 2022, Rail Energy Transportation Advisory Committee meeting.4For example, at STB’s May 22, 2019 Oversight Hearing on Demurrage and Accessorial Charges, shippers and their associationsdescribed FMLM as the “challenge,” where Class I railroads are “struggling,” and the “root cause to a lot of the issues.”2Grain Transportation Report2May 19, 2022
shippers are willing to pay for the certainty of guaranteed car service, compared to the uncertainty ofobtaining cars in the queue or lottery. Rates in the secondary market have been extremely high in recentmonths. In the latest week of data, bids for shuttle train service in May on Union Pacific reached 4,300(table 6). For a shuttle train shipment from Iowa to California, that number represents a roughly 80percent increase in the cost of rail service (table 7).STB Fosters Communication and Takes Up ReformPublic hearings and testimony. Concerned about poor rail service, the USDA Secretary wrote to STBon March 30 urging immediate action to address significant rail service issues for agriculture. At a publicSTB hearing on rail service issues (April 26-27), the USDA Deputy Secretary’s testimony detailed theissues experienced by agricultural rail shippers. She recommended railroads face heavier penalties forpoor rail service, and urged STB to finalize several open proceedings that would incentivize railroads toprovide better service.Railroads have stated they are committed to restoring service. For example, BNSF’s CEO said thecompany is taking “aggressive measures” to restore service, and Norfolk Southern’s CEO said“restor[ing] service to the quality our customers expect and deserve” is the company’s top priority.5However, some—including some shippers, analysts, and STB members—are skeptical that service issueswill turn around soon. At the STB hearing, rail labor expressed grave concern over railroads’ PSR-relatedworkforce cuts and new “draconian” attendance policies. Train crews take time to recruit and train, andwithout sufficient labor, rail service will struggle to improve. In his May 12 written testimony before theHouse Committee on Transportation and Infrastructure, the STB Chair noted “Given the challenges therailroads now recount regarding hiring and retaining employees I am not optimistic about significantimprovement in rail service in the near term.” Analysts at the April STB hearing suggested service couldremain poor through the rest of 2022 and possibly into 2023. Such delayed improvement would affect theupcoming wheat, corn, and soybean harvests.STB initiatives toward reform. STB has been actively seeking to restore service as soon as possible. OnApril 22, STB proposed new emergency service rules to facilitate shippers’ obtaining directed service inemergencies.6 In addition, on May 6, STB required the four largest Class I railroads to provide servicerecovery plans on May 20 and to meet with STB every 2 weeks. The plans will explain the specificactions each carrier will take to improve service. Additionally, weekly, all seven Class I carriers will haveto submit a number of new service metrics starting May 18. These include (but are not limited to) data onterminal dwell times at 10 additional locations; shares of scheduled services that were fulfilled; and sharesof cars dropped off within 24 hours of the estimated time of arrival.STB also has open proceedings that could increase incentives for railroads to provide better service overthe long term. For example, in March, STB held a public hearing on reciprocal switching and isconsidering collecting FMLM data. Further, on April 1, STB initiated a proceeding to examine aproposal to charge railroads demurrage-like fees for inefficient car use.7 The agency also has importantopen proceedings aimed at making rate review more accessible in small disputes. In his May 12 writtentestimony, the STB Chair expressed hope about potential decisions STB may issue fairly soon: he hopesSTB will act on its rate review proceedings by this fall and on reciprocal switching by the end of theyear.Jesse.Gastelle@usda.gov, PeterA.Caffarelli@usda.gov5Trains May 11, 2022, article, “BNSF Taking ‘Aggressive Measures’ To Restore Service, Farmer Says.” Also, NorfolkSouthern May 12, 2022, press release, "Norfolk Southern CEO Shares Customer-Centric and Operations-Driven Vision WithShareholders."6Comments are due May 23 and replies by June 6.7Comments are due June 30 and replies by August 1.Grain Transportation Report3May 19, 2022
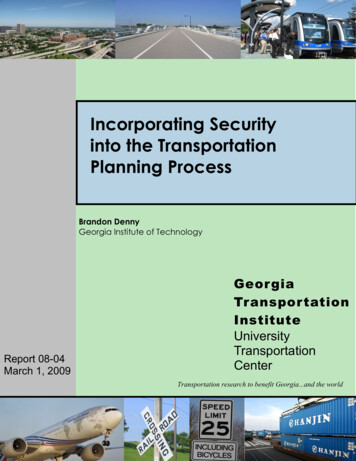
Grain Transportation IndicatorsTable 11GrainGrain transporttransport costcost indicatorsindicators 1TruckTruckForFor thethe weekweek endingending05/18/22RailRailSS huttlehuttle31830837705/18/223770%# D IV / 0 !3773183180%05/11/2205/11/22# D IV / 0 !3771BargeBargeNon-SNon-S acific259367330- 11%3%259- 11%2912913673%3304%4%356316356316Indicator: Base year 2000 100. Weekly updates include truck diesel ( /gallon); rail near-month secondary rail market bid and monthly tariffIndicator:Baseyear 2000 100.Weeklyupdatesinclude diesel ( /gallon); near-monthmarketbid andmonthly tariffratewith fuelsurcharge( /car);barge IllinoisRiverbargetruckrate (indexpercent of railtariffrate); ocean secondary routes torailJapan( /metricton);ratesurcharge ( /car); barge Illinois River barge rate (index percent of tariff rate); ocean routes to Japan ( /metric ton);n/a withnot fuelavailable.n/a notUSDA,available.Source:Agricultural Marketing Service.1Source: USDA, Agricultural Marketing Service.Table 2Market Update: U.S. origins to export position price spreads ( SND–Portland-2.16-2.14Note: nq no quote; n/a not available; HRW hard red winter wheat; HRS hard red spring wheat.Source: USDA, Agricultural Marketing Service.The grain bid summary illustrates the market relationships for commodities. Positive and negative adjustments in differentialbetween terminal and futures markets, and the relationship to inland market points, are indicators of changes in fundamental market supply and demand. The map may be used to monitor market and time differentials.Figure 1Grain bid summaryGrain Transportation Report4May 19, 2022
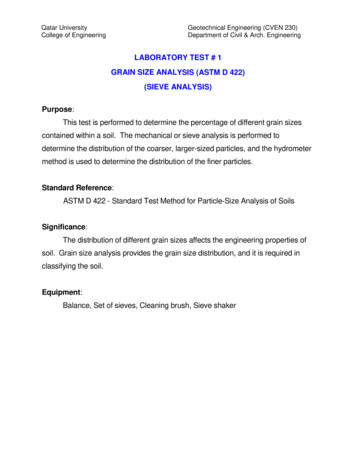
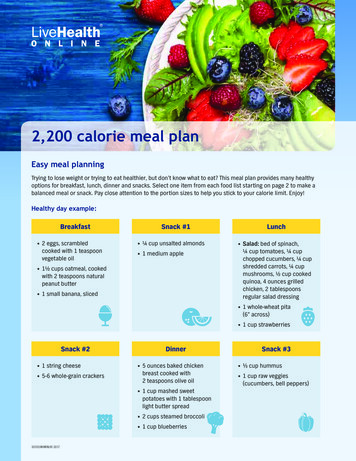
Rail TransportationTable 3Rail deliveries to port (carloads) 1MississippiFor the week ending5/11/2022pr5/4/20222022 YTD rr2021 YTD2022 YTD as % of 2021 YTD2Last 4 weeks as % of 2021Last 4 weeks as % of 4-year avg.2Total 2021Total 2020PacificAtlantic &GulfTexas GulfNorthwestEast GulfTotalWeek 9,0658,369171,790192,105895/7/20224/30/20222022 YTD2021 YTD% change 105458,169433,750Last 4wks. % 2021Last 4wks. % 4 yr.Total 2021Total 202096105147,859128,714Cross-border31Data is incomplete as it is voluntarily provided.Compared with same 4-weeks in 2021 and prior 4-year average.3Cross-border weekly data is approximately 15 percent below the Association of American Railroads' reported weekly carloads received by Mexican railroadsto reflect switching between Kansas City Southern de Mexico (KCSM) and Grupo Mexico.YTD year-to-date; p preliminary data; r revised data; n/a not available; wks. weeks; avg. average.Source: USDA, Agricultural Marketing Service.2Railroads originate approximately 24 percent of U.S. grain shipments. Trends in these loadings are indicative ofmarket conditions and expectations.Figure 2Rail deliveries to /191000 carloads - 4-week average12P acific Northwest: 4 weeks ending 5/11—down 12% from same period last year; down 3% from the 4-year average.Texas Gulf: 4 weeks ending 5/11—down 30% from same period last year; down 11% from the 4 -year average.Mississippi River: 4 weeks ending 5/11—up 14% from same period last year; up 77% from the 4-year average.Cross-border: 4 weeks ending 5/7—down 4% from same period last year; up 5% from the 4-year average.Source: USDA, Agricultural Marketing Service.Grain Transportation Report5May 19, 2022
Table 4Class I rail carrier grain car bulletin (grain carloads originated)For the week ending:5/7/2022EastCS XTWestNSBNS FKCSUPCanadaU.S . totalCNCPThis week1,5932,60411,9269315,34822,4023,1463,485This week last year1,6742,93913,0187076,87725,2155,0455,7172022 ,9092021 ,9572022 YTD as % of 2021 YTD92908811890907168Last 4 weeks as % of 2021*9492819476827058Last 4 weeks as % of 3-yr. 8,0021,207,559Total 2021210,216242,533*T he past 4 weeks of this year as a percent of the same 4 weeks last year.**T he past 4 weeks as a percent of the same period from the prior 3-year average. YT D year-to-date; avg. average; yr. year.Note: NS Norfolk Southern; KCS Kansas City Southern; UP Union Pacific; CN Canadian National; CP Canadian Pacific.Source: Association of American Railroads.Figure 3Total weekly U.S. Class I railroad grain carloads311,000 carloads29For the 4 weeks ending May 7, grain carloads were down 2 percent from the previous week, down 18 percent fromlast year, and down 9 percent from the 3-year average.27252321191715Prior 3-year, 4-week averageCurrent 4-week averageSource: Association of American Railroads.Table 5Railcar auction offerings 1 ( /car)2For the week ending:5/12/2022Delivery g-21BNSF3CO T grain unitsCO T grain single-carno offerno offerno offerno offerno offerno offerno bids0no bids0no bids0no bids000UP4GCAS/Region 1GCAS/Region 2no offerno offerno offerno offerno offerno offerno offerno offerno offerno offerno offerno offern/an/an/an/a1Auc tio n o ffe rings a re fo r s ingle -c a r a nd unit tra in s hipm e nts o nly.2Ave ra ge pre m ium /dis c o unt to ta riff, la s t a uc tio n. n/a no t a va ila ble .3B NS F - C OT B NS F R a ilwa y C e rtific a te o f Tra ns po rta tio n; no rth gra in a nd s o uth gra in bids we re c o m bine d e ffe c tive the we e k e nding 6/24/06.4UP - GC AS Unio n P a c ific R a ilro a d Gra in C a r Allo c a tio n S ys te m .R e gio n 1 inc lude s : AR , IL, LA, M O, NM , OK, TX, WI, a nd Duluth, M N.R e gio n 2 inc lude s : C O, IA, KS , M N, NE, WY, a nd Ka ns a s C ity a nd S t. J o s e ph, M O.S o urc e : US DA, Agric ultura l M a rke ting S e rvic e .Grain Transportation Report6May 19, 2022
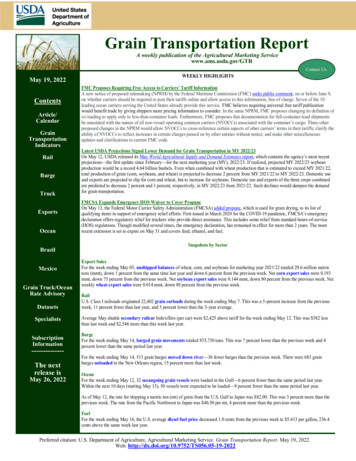
The secondary rail market information reflects trade values for service that was originally purchased from the railroad carrieras some form of guaranteed freight. The auction and secondary rail values are indicators of rail service quality and 2/2022BNS FUPn/an/a 600 4,250Non-shuttleS huttleShuttleShuttle prior 3-yr. avg. (same /202109/30/2021Average premium/discount to tariff( /car)Figure 4Secondary market bids/offers for railcars to be delivered in May 2022Non-shuttleNon-shuttle prior 3-yr. avg. (same week)There were no non-shuttle bids/offers this week.Average shuttle bids/offers fell 582 this week and are 582 below the peak.Note: Non-shuttle bids include unit-train and single-car bids. n/a not available; avg. average; yr. year; BNSF BNSF Railway; UP Union P acific Railroad .Source: USDA, Agricultural Marketing Service.BNS FUPNon-shuttlen/an/aS huttle 75n/a5/12/2022ShuttleShuttle prior 3-yr. avg. (same verage premium/discount to tariff( /car)Figure 5Secondary market bids/offers for railcars to be delivered in June 2022Non-shuttleNon-shuttle prior 3-yr. avg. (same week)There were no non-shuttle bids/offers this week.Average shuttle bids/offers fell 313 this week and are 1,413 below the peak.Note: Non-shuttle bids include unit-train and single-car bids. n/a not available; avg. average; yr. year; BNSF BNSF Rail way; UP Union P acific Railroad.Source: USDA, Agricultural Marketing Service.Grain Transportation Report7May 19, 2022
6005004003002001000-100BNS FUPNon-shuttlen/an/aS huttle 50n/a5/12/2022ShuttleShuttle prior 3-yr. avg. (same 21-20012/2/2021Average premium/discount to tariff( /car)Figure 6Secondary market bids/offers for railcars to be delivered in July 2022Non-shuttleNon-shuttle prior 3-yr. avg. (same week)There were no non-shuttle bids/offers this week.Average shuttle bids/offers fell 25 this week and are 500 below the peak.Note: Non-shuttle bids include unit-train and single-car bids. n/a not available; avg. average; yr. year; BNSF BNSF Rail way; UP Union P acific Railroad.Source: USDA, Agricultural Marketing Service.Table 6Weekly secondary railcar market ( /car) 1Delivery periodFor the week ending:May-22Jun-22Jul-22Aug-22S ep-22Oct-22BNSF-GFn/an/an/an/an/an/aChange from last weekn/an/an/an/an/an/aChange from same week nge from last weekn/an/an/an/an/an/aChange from same week 44(163)4174,250n/an/an/an/a1,000Change from last week(104)n/an/an/an/an/aChange from same week 20214,483n/an/an/an/a75BNSF-GFShuttleChange from last week1Change from same week 2021UP-PoolAve ra ge pre m ium /dis c o unt to ta riff, /c a r-la s t we e k.No te : B ids lis te d a re m a rke t indic a to rs o nly a nd a re no t gua ra nte e d pric e s . n/a no t a va ila ble ; GF gua ra nte e d fre ight; P o o l gua ra nte e d po o l;B NS F B NS F R a ilwa y; UP Unio n P a c ific R a ilro a d.Da ta fro m J a m e s B . J o ine r C o ., Tra de we s t B ro ke ra ge C o .S o urc e : US DA, Agric ultura l M a rke ting S e rvic e .Grain Transportation Report8May 19, 2022
The tariff rail rate is the base price of freight rail service. Together with fuel surcharges and any auction and secondary railvalues, the tariff rail rate constitutes the full cost of shipping by rail. Typically, auction and secondary rail values are a smallfraction of the full cost of shipping by rail relative to the tariff rate. However, during times of high rail demand or short supply,high auction and secondary rail values can exceed the cost of the tariff rate plus fuel surcharge.Table 7Tariff rail rate s for unit and shuttle train shipme nts 1TariffMay 2022PercentFuelsurcharge Tariff plus surcharge per: changebushel 2Y/Y4per carmetric tonOrigin region 3Destination region 3Wichita, KSSt. Louis, MO 3,695 309 39.76 1.085Grand Forks, NDDuluth-Superior, MN 3,658 0 36.33 0.99-13Wichita, KSLos Angeles, CA 7,290 0 72.39 1.972Wichita, KSNew Orleans, LA 4,436 543 49.44 1.355Sioux Falls, SDGalveston-Houston, TX 7,026 0 69.77 1.903Colby, KSGalveston-Houston, TX 4,712 595 52.70 1.436Amarillo, TXLos Angeles, CA 5,121 828 59.07 1.6110Champaign-Urbana, IL New Orleans, LA 4,000 614 45.82 1.1612Toledo, OHRaleigh, NC 8,130 671 87.40 2.2212Des Moines, IADavenport, IA 2,505 130 26.17 0.665Indianapolis, INAtlanta, GA 6,227 504 66.84 1.7013Indianapolis, INKnoxville, TN 5,247 326 55.34 1.4111Des Moines, IALittle Rock, AR 4,000 382 43.51 1.119Des Moines, IALos Angeles, CA 5,880 1,112 69.43 1.7613Minneapolis, MNNew Orleans, LA 4,431 951 53.44 1.4540Toledo, OHHuntsville, AL 6,714 478 71.42 1.949Indianapolis, INRaleigh, NC 7,422 680 80.46 2.1914Indianapolis, INHuntsville, ALrate/carUnit trainWheatCornSoybeans 5,367 323 56.50 1.548Champaign-Urbana, IL New Orleans, LA 4,665 614 52.42 1.438Great Falls, MTPortland, OR 4,193 0 41.64 1.134Wichita, KSGalveston-Houston, TX 4,411 0 43.80 1.194Chicago, ILAlbany, NY 6,670 633 72.53 1.9715Grand Forks, NDPortland, OR 5,851 0 58.10 1.583Grand Forks, NDGalveston-Houston, TX 5,199 0 51.63 1.41-13Colby, KSPortland, OR 5,923 975 68.50 1.868Minneapolis, MNPortland, OR 5,380 0 53.43 1.364Sioux Falls, SDTacoma, WAS huttle trainWheatCornSoybeans 5,340 0 53.03 1.354Champaign-Urbana, IL New Orleans, LA 3,920 614 45.02 1.1412Lincoln, NEGalveston-Houston, TX 4,080 0 40.52 1.035Des Moines, IAAmarillo, TX 4,420 480 48.66 1.249Minneapolis, MNTacoma, WA 5,380 0 53.43 1.364Council Bluffs, IAStockton, CA 5,300 0 52.63 1.344Sioux Falls, SDTacoma, WA 6,050 0 60.08 1.643Minneapolis, MNPortland, OR 6,100 0 60.58 1.653Fargo, NDTacoma, WA 5,950 0 59.09 1.613Council Bluffs, IANew Orleans, LA 4,895 708 55.64 1.519Toledo, OHHuntsville, AL 4,954 478 53.94 1.4710Grand Island, NEPortland, OR 5,280 999 62.35 1.70121A unit train refers to shipments of at least 25 cars. Shuttle train rates are generally available for qualified shipments of2Approximate load per car 111 short tons (100.7 metric tons): corn 56 pounds per bushel (lbs/bu), wheat and soybeans 60 lbs/bu.75-120 cars that meet railroad efficiency requirements.3Regional economic areas are defined by the Bureau of Economic Analysis (BEA).4Percentage change year over year (Y/Y) calculated using tariff rate plus fuel surcharge.Source: BNSF Railway, Canadian National Railway, CSX T ransportation, and Union Pacific Railroad.Grain Transportation Report9May 19, 2022
Table 8Tariff rail rates for U.S. bulk grain shipments to MexicoDate: December 2021OriginCommodity stateDestination regionWheatMTChihuahua, CIOKCuautitlan, EMKSGuadalajara, JATXSalinas Victoria, NLTariff rateper car1 7,699 6,900 7,619 4,420Fuelsurchargeper car2 0 230 719 138Tariff rate plusfuel surcharge per:metric ton 3bushel 3 78.67 2.14 72.85 1.98 85.19 2.32 46.57 1.27Percentchange 4Y/Y4674CornIASDNESDMOSDGuadalajara, JACelaya, GJQueretaro, QASalinas Victoria, NLTlalnepantla, EMTorreon, CU 9,102 8,300 8,322 6,905 7,687 7,825 663 0 462 0 450 0 99.77 84.81 89.75 70.55 83.14 79.95 2.53 2.15 2.28 1.79 2.11 2.03625052SoybeansMONEIAKSBojay (Tula), HGGuadalajara, JAEl Castillo, JATorreon, CU 8,647 9,207 9,510 8,109 614 646 0 466 94.63 100.67 97.17 87.61 2.57 2.74 2.64 2.385515SorghumNEKSNENECelaya, GJQueretaro, QASalinas Victoria, NLTorreon, CU 7,932 8,108 6,713 7,225 597 287 231 438 87.15 85.77 70.94 78.29 2.21 2.18 1.80 1.9963361Rates are based upon published tariff rates for high-capacity shuttle trains. Shuttle trains are available for qualifiedshipments of 75-110 cars that meet railroad efficiency requirements.2Fuel surcharge adjusted to reflect the change in Ferrocarril Mexicano, S.A. de C.V railroad fuel surcharge policy as of 10/01/2009.3Approximate load per car 97.87 metric tons: Corn & Sorghum 56 lbs/bu, Wheat & Soybeans 60 lbs/bu.Percentage change calculated using tariff rate plus fuel surchage; Y/Y year over year.5As of January 1, both BNSF and Union Pacific changed their billing and reporting of rates to Mexico.As we incorporate the change, T able 8 updates will be delayed.4Sources: BNSF Railway, Union Pacific Railroad, Kansas City Southern.Figure 7Railroad fuel surcharges, North American weighted average 1 0.80Dollars per railcar mile 0.70M ay 2022: 0.61/mile, up 21 cents from last month's surcharge of 0.4/mile; up 45 cents from the M ay 2021surcharge of 0.16/mile; and up 48 cents from the M ay prior 3-year average of 0.13/mile. 0.60 0.503-year monthly averageFuel surcharge* ( /mile/railcar) 0.40 0.30 0.20 0.10 0.00Weighted by each Class I railroad's proportion of grain traffic for the prior year.* Beginning January 2009, the Canadian Pacific fuel surcharge is computed by a monthly average of the bi -weekly fuel surcharge.**CSX strike price changed from 2.00/gal. to 3.75/gal. starting January 1, 2015.Sources: BNSF Railway, Canadian National Railway, CSX T ransportation, Canadian Pacific Railway, Union Pacific Railroad, Kansas CitySouthern Railway, Norfolk Southern Corporation.1Grain Transportation Report10May 19, 2022
Barge TransportationFigure 8Illinois River barge freight rate 1,2Percent of tariff1,2001,000For t he week of May 17: 11 percent lower t han last week; 25 percent higher t hanlast year; and 36 percent higher t han t he 3 -year average.800Weekly rate6003-year 2106/15/2106/01/21005/18/212001Rat e percent of 1976 t ariff benchmark index (1976 100 percent ); 2 4-week moving average of t he 3-year average.*Source: USDA, Agricult ural Market ing Service.Table 9Weekly barge freight rates: Southbound onlyTwinCitiesMidMississippiLowerIllinoisRiverSt. 6 t week % change from the 3460360433433329August616581575513556556519Last year3-year avg. 2Rate11Rate percent of 1976 tariff benchmark index (1976 100 percent)
tons (mmt), down 1 percent from the same time last year and down 6 percent from the previous week. Net corn export sale s were 0. 193 mmt, down 75 percent from the previous week. Net soybean export sales were 0.144 mmt, down 80 percent from the previous week. Net weekly wheat export sales were 0. 014 mmt, down 88 percent from the previous week.