Transcription
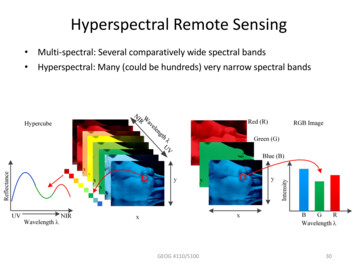
(IJACSA) International Journal of Advanced Computer Science and Applications,Vol. 9, No. 8, 2018The Role of Hyperspectral Imaging: A LiteratureReviewMuhammad Mateen, Junhao Wen, Nasrullah, Muhammad Azeem AkbarSchool of Big Data and Software Engineering,Chongqing University,Chongqing, 401331, ChinaAbstract—Optical analysis techniques are used recently todetect and identify the objects from a large scale of images.Hyperspectral imaging technique is also one of them. Vision ofhuman eye is based on three basic color (red, green and blue)bands, but spectral imaging divides the vision into many morebands. Hyperspectral remote sensors achieve imagery data in theform of hundreds of adjoining spectral bands. In this paper, ourpurpose is to illustrate the fundamental concept, hyperspectralremote sensing, remotely sensed information, methods forhyperspectral imaging and applications based on hyperspectralimaging. Moreover, in the forensic context, the novel methodsinvolving deep neural networks are elaborated in this paper. Theproposed idea can be useful for further research in the field ofhyperspectral imaging using deep ectrum;hyperspectral imaging; imaging spectroscopy; multispectralimaging; remote sensingI.INTRODUCTIONIn hyperspectral, the term ―hyper‖ means ―too many‖ andit refers to the huge amount of measured wavelength bands.Hyperspectral images are used to provide sufficient spectralinformation to recognize and differentiate spectrallydistinctive materials. Optical analysis techniques are used todetect and identify the objects from a large scale of images.Hyperspectral imaging technique is one of them. Vision ofhuman eye is based on three basic colors (red, green and blue)bands, but spectral imaging divides the vision into many morebands. Hyperspectral remote sensors achieve imagery data inthe form of hundreds of adjoining spectral bands.The collective data is used to obtain a constant spectrumfor each imagery pixel mentioned in Fig. 1. After tuning thesensor, terrain and atmospheric belongings are applied [1].These imagery spectrums can be analyzed with laboratory orfield reflectance spectra to know and map surface materialssuch as specific kind of plants or indicative minerals with oredeposits.Imaging spectrometers are instruments used to producehyperspectral images. The remote imaging and spectroscopyare two basic technologies used to develop the hyperspectralsensors. Spectroscopy is a field of study about light emissionor reflection from different materials and the changes occurredin energy with wavelength.In the field of optical remote sensing, spectroscopy actswith the spectra of sunlight that is scattered by objects at orinside the earth. Remote images are planned to capture andcalculate the light returned from adjoining areas on the surfaceof earth. Hyperspectral imaging can be applied to try,biophysics, industrial monitoring and remote sensing to collectthe information for analysis.Chinese Academy of Science played a vital role in thefield of hyperspectral imaging and developed two outstandingimagers, one of them is known as Push broom HyperspectralImager (PHI) and another one is Operative Modular ImagingSpectrometer (OMIS). In 2000, another invention aboutimaging came out in the form of Hyperspectral DigitalCamera (HSDC)which supports limited spectral bands withhigh quality of spectral resolution [2]. HSDC plays a flexiblerole for different observation objects and applicationsincluding environmental and agricultural monitoring.Analysis of Hyperspectral imager can be performed by twodifferent ways one of them is perspective of spectral analysisand another is based on image processing. It is more importantthat the data should be well organized before selection of anykind of approach. In spectroscopic analysis, the spectra shouldbe extracted by region of interest that is usually calculated bythree different ways such as threshold an image with singlewaveband, ratio or difference image. In image processing, fewimages are selected from the collection of images for rapidcomputation. Selection of those images is based on theimportance of their wavelength for shifting carefully. In Fig. 2[3] for careful shifting, spectra provides an option for peaksand valleys whether in [4] based on original or preprocessedformat.There are several other methods to achieve the same goal,for example, partial least square regression and principalcomponent analysis. Additionally, some data compressiontechniques such as singular value decomposition and Fouriertransform are used for the process of more images to increasethe ability of hyperspectral imaging [5]. After the achievementof healthy data, the next step is to make dependentstandardized models. Before implementation of Chemometricalgorithm, it is compulsory to overcome the noisy data toincrease the quality of signals. Moreover, image processingincludes filtering and binning, which can increase the qualityof data. In calibration model, the same routine is followed byspectroscopy and spectral analysis as shown in Fig. 2.51 P a g ewww.ijacsa.thesai.org
(IJACSA) International Journal of Advanced Computer Science and Applications,Vol. 9, No. 8, 2018Fig. 1. Measurement of hyperspectral remote sensor.Fig. 2. Flowchart of hyperspectral imaging processing.In this model different techniques such as principalcomponent analysis, partial least square discriminate analysis,fisher’s linear discriminate technique, support vector machine,artificial neural network and fuzzy inference are offered [3].As a result prediction map can be progressed with the use ofpost- processing techniques and the information is achieved.52 P a g ewww.ijacsa.thesai.org
(IJACSA) International Journal of Advanced Computer Science and Applications,Vol. 9, No. 8, 2018The rest of the paper is organized as: related work of thestudy is discussed in Section II. Study findings are reported inSection III, and Section IV covers the future work of thestudy. The applications of hyperspectral imaging are explainedin Section V. Finally, the findings are concluded inSection VI.II. RELATED WORKLight emitted by sun strikes on the molecules, causing inabsorption and reflection of light which depends on thestructure or architecture of molecules. The wavelength ofabsorption or reflection of atomic bonds and molecule makesdetection or identification of a specific object. To collect theamount of light reflected by a specific object or earth surfaceis used for identification of that object. There are differenttypes of sensors used to collect the scattered data includingtruck-mounted sensor, airborne sensor and satellite-basedsensor. With the help of fast computers and development ofsensors, the immense research [6] is being carried out in thefield of ―Hyperspectral remote sensing‖.In [7], Sun, L et al. introduced a novel approach based onsupervised classification for hyperspectral imaging.Supervised classification model includes a spatially weightedrandom fields and spectral data reliability. To progress thequality of classification, the real labels of training datasamples are fixed as a constraint in the model of proposedapproach. In [8], Sun, L. et al. introduced noise (deadlines,strip noises, impulse and Gaussian) reduction technique forhyperspectral imaging with the use of low-rank representationon the spectral image. According to the proposed techniquespectral space of hyperspectral image recline in the low-ranksubspace. The low rank representation based on spectral spacewas oppressed by nuclear norm of image with the spectraldimension. It causes potential for the removal of deadlines,strips, sparse noise and Gaussian noise on the level of eachband.In the field of image classification, high dimensionality ofimaging data is a challenge. Hyperspectral imaging data alsocontains high dimensionality, so the spatial-spectralclassification methods are demands for computational viewpoint. In [9], Wu, Z. et al. introduced a novel technique forparallel implementation of spatial-spectral classification on thebasis of adaptive random fields. In this technique, logisticregression classifier is used for spectral information. In thisresearch, graphics processing units are used for parallelimplementation. GPU sets the work allocation, input andoutput between the CPU and the graphics processing unithaving fully computational control of GPUs with low latencyand high bandwidth of shared memory.In [10], Sun, L. et al. introduced a novel approach fornoise reduction in the hyperspectral images. Noise reductiontechnique is based on the super pixel-based low level rank ofrepresentation for hyperspectral imaging. Under the model ofa linear mixture, the hyperspectral cube is considered as a lowrank in the spectral area, which is divided HSI data into thesub-matrices of lower ranks.In 1985, a technique named as ―Imaging spectrometry‖was used for the remote sensing of the earth. In addition, therewas a motivation for the development of digital imageprocessing methodologies by multispectral data analysis [11].In the early stage, Goetz et al. [6] defined Hyperspectralremote sensing as ―The collection of images in dozens tohundreds of adjacent registered spectral bands so that forevery cell of an image a glowing spectrum can be calculated.‖According to this definition, spectral regions of VIS (visible),NIR (Near Infrared), SWIR (Shortwave Infrared), MWIR(Midwave Infrared), LWIR (Longwave Infrared) and UV(Ultraviolet) are covered.A. Hyperspectral Remote SensingThe hyperspectral sensor is used to study soil science,geology, mining, land use, and hydrology to map and identifygeometric and chemical patterns of land. Information obtainedby hyperspectral sensor is used to identify valuable mineralsand petroleum. Imaging spectroscopy is a technique used toabsorb specific features of chemical bonds in minerals.Material mapping includes water, ice, snow, mineral mixtures,vegetation, environmental materials, atmospheric gases, andman-made materials. Hyperspectral airborne scanners wereused in 1998 to identify rocks and soils containinghydrocarbon [12]. This experiment was named as ―Pro SmartExperiment‖ managed by German Aerospace Center to testthe Hyperspectral ―HyMap‖ designed by the AustralianCompany Integrated Spectronics Ltd. In Hyperspectral dataanalysis, several factors are involved to make it complex forrefined techniques and algorithms.To demonstrate the hyperspectral data analysis, themes aremanaged in six main areas including un-mixing, data fusion,target detection, physical parameter retrieval, classificationand fast computing based on image processing, machinelearning, and signal processing. According to [13], researchersdescribed all the areas one by one in the paper. In the datafusion, various strategies are defined including restoration ofthe signal to noise ratio (SNR) and spatialresolution, spectraldata fusion to overcome high spectral redundancy, spatial datafusion used to enhance the resolution of imaging sensor at thesub-pixel level. There is another sensor named as ―Dual pushbroom hyperspectral sensor‖ which contains two variousdevices (covers different wavelengths) that are normallyattached to the similar bench. ―Co-registration of pixels‖ and―Peer of the field of view‖ are problems lead by thisconfiguration called Bore sight Effect. To observe and detectspectral phenomena, A. Brook et al. [14] proposed a prior toits correction with the use of Bore sight Effect that is used toprovide supplementary information not located in thecorrected images.B. Remotely Sensed DataHyperspectral sensors collect the data from the surface ofthe earth with the help of different parameters. It is importantto measure the accurate values of identified objects. There area lot of methods and techniques, developed to measure thevalues of vegetation. Some techniques show that the resultscan be obtained in highly accurate form but few techniquesshow the results in moderately accurate form.In [15], Mutanga et al. studied on a small number ofchemicals, for example, chlorophyll and another kind ofpigments. The pigments including carotenes and chlorophyll53 P a g ewww.ijacsa.thesai.org
(IJACSA) International Journal of Advanced Computer Science and Applications,Vol. 9, No. 8, 2018are identifiable with 80 per cent accuracy in sample fields.Nitrogen can also be detected with accuracy. But the othernutrients namely magnesium, calcium, sodium, potassium, andphosphorus have less notified by Mutanga et al. in hisresearch. Even though this is very expensive for projects toanalyze with a lot of samples, the impending of remotesensing is not totally oppressed. In the [16], research relatedwith Geoinformation science and earth analysis for modelingand management of environment designed a remote sensingdata model in which ―spot vegetation‖ concerned with georeferenced and ―Corine land cover data‖ concerned withstudy area that provides qualitative and quantitativeinformation of earth surface. This research work used datasetswith some characteristics including geometric accuracy betterthan 100 m, thematic accuracy greater than 85 percent, andspatial resolution of 30m.For the development of South African ImagingSpectroscopy Landscape, an overview is explained in briefabout analysis techniques and challenges [17]. According toAfrican research and application, indicators can be derived bythe full width of the spectral response for example slopes,integrals, and curve derivatives. The purpose is to identifydata source from the imaging spectroscopy, in which spectralattributes are required to notify an application of interest.According to [18], object-based classification approach is usedto classify the remotely sensed data. In 2000, Walter andFritsch introduced a concept using multispectral remotesensing data to automatically revise the geographicalinformation system databases. In object-based classification,not only single pixel is classified but the group of pixels isalso classified based on geographical information systemdatabase. This approach depends on two main steps, the firststep is based on supervised likelihood classification and thesecond step is based on matching of existing GIS objects withclassified objects to detect the change occurred or to identifythe faulty data. This approach develops and makes the betterresult of the classification. At the end, the result is obtained inthe form of fully classified, partly classified and not found bythe use of a threshold, iteratively defined by a user. In [19], asurface bidirectional reflectance model has been designed. Themodel is applicable for heterogeneous surfaces and follows asemi-empirical approach. There are three parameters used todescribe the nature of the surface and these parameters areused in the effective algorithm of correction and processingthe remote sensing data. The model based on surfacebidirectional reflectance is collection of two basic processes,one of them is to diffuse reflection component which explainsthe geometrical structure on surface and also understands theshadow effects while the second process defines the volumescattering properties obtained by isolated surfaces. Invisibleand near-infrared spectral bands, model and situ annotationsdemonstrate the better association for common investigatedsurface types. The model is good to reduce the largelyunwanted variations related to surface bidirectional results inremotely sensed data.U.C. Benz et al. [20] proposed object-oriented analysisassociated with fuzzy methods to implement information andexplained workflow from remote sensing imagery to graphicalinformation system. During proposed method, software namedas ―eCognition‖ is used to offer the suitable connectionbetween remote sensing imagery and graphical informationsystem. Thus object-oriented technique can provide powerfulautomatic and semiautomatic evaluation to allocate practicedknowledge to GIS.III. DISCUSSIONSHyperspectral imagery process follows some methods toaccomplish the proposed task. These methods contain studyarea, which means where experiment is performed; fieldsampling, meaning the sample data gathered from study area;Chemical analysis, which means evaluation of chemicalcompounds and Spectral processing, which means to performoperation on sample of spectra to overcome noisy data,statistical formulas are used for prediction of parameters. D.Liao et al. [21] proposed method to visualize hyperspectralimage in normal color by the coordination of HSI and highresolution image through multiple alignments. Manifoldalignment identifies the matching color points and displays itinto pair wise alignment, while the spaces between them playthe role of bridges. Association of hyperspectral imaging andRGB image generates a spatial image in the natural format.This approach has advantage of flexibility that’s why it can beapplied for different scenario. The same approach is also wellknown because of user’s customization, in which user canscan visual resultant bands according to the specified interest.Chemometric and spectroscopy areas provided methods andanalysis tools including ―Partial Least Squares RegressionAnalysis‖ and ―Principal Component‖, which are useful forthe process of hyperspectral image [22]. Workflow ofhyperspectral image processing is different from the workflowof color image processing but both data types are multivariateand multidimensional. Hyperspectral imaging methods such asimage acquisition, spectral and spatial preprocessing,dimensionality reduction, calibration, feature extraction andselection are used for HSI processing as shown in Fig. 2. Pushbroom line scanner is commonly used as distributedhyperspectral imaging sensor. Push broom scans allwavelength data points with the same spatial coordinates. Inthe hyperspectral imaging system, calibration is a method thatensures the repeatability and accuracy of results gained byhyperspectral imaging data. Calibration is a procedure thatconnects wavelengths with band numbers. Spatial calibrationis a method of measuring the correlation of each image pixelsuch as meters. Spatial preprocessing is also a method used inhyperspectral imaging to minimize the noisy data from theimages. Spatial post-processing is considered more valuablethan spatial preprocessing because prediction andclassification images are common images that need spatialmanipulation, interpretation and pattern identification. Spatialsampling and Region of Interest (ROI) is a basic method ofhyperspectral imaging used to mention the study area orlocation of interest for hyperspectral sensors. Spatial samplingcan also be considered as background masking produced bybinary images [22]. Transformation to absorbance is also usedduring reflectance or transmittance of data for analysis [23].Hyperspectral imaging contains noisy data during scanning alarge scale of image. To reduce noisy data, de-noisingalgorithm is performed in the spectral domain of hyperspectralimaging [24]. Feature extraction is also essential method used54 P a g ewww.ijacsa.thesai.org
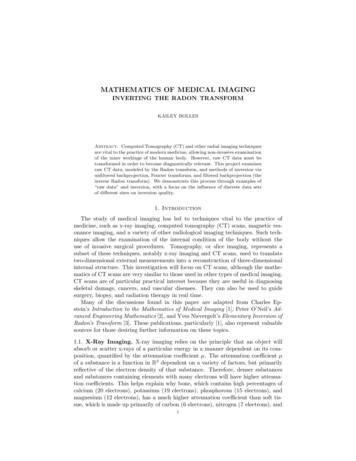
(IJACSA) International Journal of Advanced Computer Science and Applications,Vol. 9, No. 8, 2018to transform the existing features to a set of new features.Selection of subset from input feature without transformationis called selection extraction. It is also called feature subsetselection. Mosaic based images [25] which are merged into aparticular hyperspectral image, is used for the data analysisand classification algorithms.In [26], affinity propagation method is used for theselection of bands in hyperspectral imaging. In this methodcentered based clustering approach is used to classify thesimilar color bands. AP is applied by factor graph and thenoperation performed by the centralized data points throughmessage passing until an appropriate set of bands is achieved.The presentation of band selection is analyzed by theclassification of a pixel inside the specific image.Classification of pixels is better performed by affinitypropagation instead of all other approaches. Unlikeconventional methods of clustering named as K-means,agglomerative clustering, a proposed technique (AP) obtainedbetter results of band selection through message passingmethod. Hyperspectral imaging contains massive informationof colored bands. Collection of colored bands can have noisydata that is considered to remove before processing. Duringpreprocessing manual band removal technique is used toremove the noisy data. In [27], problem related with MBR isidentified, because during MBR an important data can also beremoved. For this problem, a proposed technique is introducedto automatically select the noisy bands instead of MBRselection. In the proposed technique, first wavelet reduction isapplied to de-noise the bands of specified image and thenAffinity Propagation approach is used to classify therepresentative bands from the noisy data with a smart way. Toovercome noisy data in an efficient way, two sensors areapplied, so the experimental results show that proposedtechnique is better performed than Manual Band Removaltechnique.To overcome the noisy data from hyperspectral images isalso introduced by [28], a proposed technique of sparserepresentation based on noise reduction method. Thistechnique depends on a non-noisy component which can besparsely decayed over redundant dictionary rather than a noisycomponent. The paper shows the correlation of spectral-spatialstructure of HSI by use of three dimensional blocks instead oftwo dimensional patches for sparse representation. Gaussianand Poisson noise models are collectively used for signaldependent and signal independent noises in hyperspectralimagery. The proposed technique is good for virtual and realdata sets of HS remote sensing.Naganathan et al. [29] proposed meat tenderness for thesatisfaction of consumers. Purpose of this proposal was tobuild up and test a near infrared/visible hyperspectral imagingsystem to guess tenderness of cooked beef by hyperspectralimages. For this purpose, a push-broom hyperspectral imagingsystem associated with diffuse floodlighting system wasdesigned and standardized. Three tenderness categoriesincluding tender, intermediate and tough were used to identifythe features of meat tenderness. Statistical textual featuresobtained from Slice Shear Force (SSF) analysis are used in―canonical discriminate model‖ for prediction. The resultssignify that hyperspectral imaging played a vital role in theprediction of meat tenderness.Fig. 3. Schematic diagram of the ISL hyperspectral imaging system.55 P a g ewww.ijacsa.thesai.org
(IJACSA) International Journal of Advanced Computer Science and Applications,Vol. 9, No. 8, 2018TABLE I.DETECTION RESULTS OF SKIN TUMORImageNo. ofRealTumorsNo. ofDetectionsNo. of FalsePositivesNo. of ysis standard [33]. J. Liang et al. [34], proposed randomsampling approach for spatial-spectral techniques to decreasethe overlapping between testing and training samples and offermore intention and precise evaluation. Random samplingapproach [35] is often used because it cares all tagged dataevenly and every sample is picked with the similar likelihood.In [36], there is a review of hyperspectral imaging analysiswith different techniques. In [36], Artificial Neural Network,Auto-Encoder, Stack Auto-Encoder, Conventional NeuralNetwork and deep leaning is discussed for the analysis ofHyperspectral Imaging. After comparison of all thesetechniques and getting results, the author mentioned that deeplearning outperformed in the analysis of hyperspectralimaging among all other stated techniques.Hyperspectral Imaging system is used for detection of skintumor [30] , in which first of all the carcass of chicken isanalyzed for the usage of spectral information as shown inFig. 3, and results are applied for the detection of skin tumoras shown in Table I.There was a little deficiency about detection that tumorless than 3 millimeters in diameter could not be identified.This step in research opens a gate for the detection of tumorsby hyperspectral imaging and can also be improved forcomputational complexity.In the field of poultry farms, hyperspectral imaging is usedto design a rapid, accurate and non-distractive method todetect the embryo and fertility improvement in eggs [31]. Anear infrared spectral imaging system was introduced for theidentification of fertility and early embryo improvement. Forthe experiment, totally 174 white shell eggs were usedincluding 18 infertile eggs and 156 fertile eggs incubated for 4days. During the inspection by hyperspectral imaging, eggswere categorized into two parts one for fertile and other forinfertile and the dataset of each category is different with theday of incubation. Gabor filter used to extract the imagetexture information of eggs. K means clustering technique isalso applied to cluster out the data and top results wereachieved as 84.1% at day 4, 81.8% at day 3, 74.1% at day 2and 100 % at day 0. The result shows that last three bandswere used for detection because of maximum response ofspectral transmission and can be applied for real-timedetection system for early embryo and fertility of chickeneggs. In the field of hyperspectral imaging, a large number ofresearchers are focused to design different kinds of spectralspatial techniques while remaining are paying attentiontowards experimental development [32]. To evaluate thehyperspectral imaging classification techniques, it needs thereliable plan of testing including suitable standardized datasets, sampling procedure for training and testing data, and fairFurthermore in [37], there is a new model named as RVCANet designed in the context of deep learning forclassification of hyperspectral imaging. R- VCANet model isa combination of Rolling Guidance Filter and VertexComponent Analysis Network. R-VCANet is useful whenthere is limited sampling for feature extraction ofhyperspectral data. R-VCANet is based on naturalcharacteristics of HIS data, spectral properties, and spatialinformation. Hence the method proposed in [37] hasperformed better for hyperspectral image classification,especially when the sampling labels are limited.Geophysics plays a vital role to study about gravesdetection after some changes are occurred in Buried graves.To detect the clandestine graves, local environment anddifferent types of soils can be observed and data can becollected which is used for analysis. So it is important tobecome familiar with the equipment and hardware that is usedfor data acquisition and data analysis. John J. Schultz [38]used ground-penetrating radar for detection of clandestinegraves. To use the GPR, it is also important to adjust theantenna for the best frequency of forensic work, whichdepends on spoidosol environment. Electromagnetic inductionmeter is also used to locate the clandestine graves, but EMI islimited for forensic research, so the lack of published researchwith the use of EMI meter to detect clandestinely buriedbodies became deem in the forensic context. As mentionedabove that EMI is limited for forensic research, a new idea isintroduced to do better in the forensic field. According to that,buried remains can be easily detected by hyperspectralimaging. By hyperspectral image, a large scale of an imagecan be achieved and with the application of deep neuralnetworks, it can be classified in a more précised way.For un-mixing, classification and target detection ofhyperspectral images, there are frequently used methodsincludes, sparse linear models, Gaussian mixture models,latent linear models, ensemble learning, directed graphicalmodels, support vector machines, linear regression, logisticregression, Gaussian models, clustering and deep learning.The summary of all these methods is highlighted in Table IIwith referred research articles.56 P a g ewww.ijacsa.thesai.org
(IJACSA) International Journal of Advanced Computer Science and Applications,Vol. 9, No. 8, 2018TABLE II.MethodsUn-mixingLinearSparse Linear Modelsspatial-spectral[39]METHODS FOR HYPERSPECTRAL IMAGINGNon-linearGaussian Mixture ModelsLatent Linear Models[45]Directed Graphical ModelsSupport Vector MachinesLinear RegressionPixel-wisefeature extraction [40]feature extraction [41][42][48]un-supervised [43]dimensionality reduction[47]transfer learning [49][55]band selection [56]semi-supervised [61]band selection [62]feature extraction [46]Ensemble Learningsub-pixelmapping [51]end memberextraction andsub-pixelmapping [53][59]ClassificationSpatial-spectralTarget c RegressionGaussian Modelstransfer learning [63]Clusteringun-supervised [66]supervised featurelearning [70]un-supervised featurelearning [71]un-supervised featurelearning [68]supervised featurelearning [69]Deep LearningIV. FUTURE WORKTo locate clandestine graves is a challenge for government(forensic department) after any victims. There is a lot oftraditional ways to locate and detect the clandestine graves, forexample with the help of forensic trained dogs, groundpenetrating radar, electromagnetic induction meter, and hyperspectral sensor, in the forensic context. There are lots ofresearchers who are doing work to facilitate the detection ofclandestine graves. In case of sudden disaster, the governmentforensic agencies play a vital role to detect the victims.Forensic archaeologist and anthropologists face a lot ofchallenges in forensic context.One problem which Saudi emergency responders have todeal with is that sometimes heavy rains result in the flood.Victims of floods get buried deep in sand at ranges from 50cmup to 2 meters. The soil under which the victims are buried islikely clayey loam and poorly drained, and it can be coveredwith water for some time (few days). T
calculate the light returned from adjoining areas on the surface applications including medicines, biogeochemistry, biophysics, industrial monitoring and remote sensing to collect the information for analysis. Chinese Academy of Science played a vital role in the field of hyperspectral imaging and developed two outstanding