Transcription
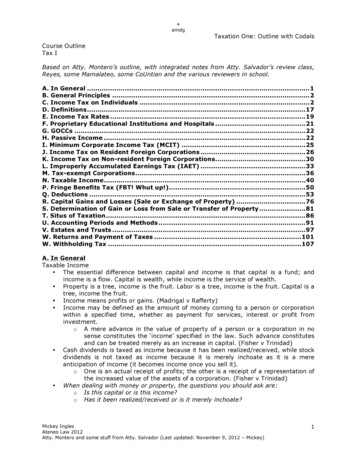
Center for Immigration StudiesC I S December 201863% of Non-Citizen HouseholdsAccess Welfare ProgramsCompared to 35% of native householdsBy Steven A. Camarota and Karen ZeiglerNew “public charge” rules issued by the Trump administration expand the list of programs that are considered welfare, receipt of which may prevent a prospective immigrant from receiving lawful permanentresidence (a green card). Analysis by the Center for Immigration Studies of the Census Bureau’s Surveyof Income and Program Participation (SIPP) shows welfare use by households headed by non-citizens is veryhigh. The desire to reduce these rates among future immigrants is the primary justification for the rule change.Immigrant advocacy groups are right to worry that the high welfare use of non-citizens may impact the abilityof some to receive green cards, though the actual impacts of the rules are unclear because they do not include allthe benefits non-citizens receive on behalf of their children and many welfare programs are not included in thenew rules. As welfare participation varies dramatically by education level, significantly reducing future welfareuse rates would require public charge rules that take into consideration education levels and resulting income andlikely welfare use.Of non-citizens in Census Bureau data, roughly half are in the country illegally. Non-citizens also include longterm temporary visitors (e.g. guestworkers and foreign students) and permanent residents who have not naturalized (green card holders). Despite the fact that there are barriers designed to prevent welfare use for all of thesenon-citizen populations, the data shows that, overall, non-citizen households access the welfare system at highrates, often receiving benefits on behalf of U.S.-born children.Among the findings: In 2014, 63 percent of households headed by a non-citizen reported that they used at least one welfareprogram, compared to 35 percent of native-headed households. Welfare use drops to 58 percent for non-citizen households and 30 percent for native households if cashpayments from the Earned Income Tax Credit (EITC) are not counted as welfare. EITC recipients payno federal income tax. Like other welfare, the EITC is a means-tested, anti-poverty program, but unlikeother programs one has to work to receive it. Compared to native households, non-citizen households have much higher use of food programs (45percent vs. 21 percent for natives) and Medicaid (50 percent vs. 23 percent for natives). Including the EITC, 31 percent of non-citizen-headed households receive cash welfare, compared to 19percent of native households. If the EITC is not included, then cash receipt by non-citizen households isslightly lower than natives (6 percent vs. 8 percent). While most new legal immigrants (green card holders) are barred from most welfare programs, as areillegal immigrants and temporary visitors, these provisions have only a modest impact on non-citizenhousehold use rates because: 1) most legal immigrants have been in the country long enough to qualify;2) the bar does not apply to all programs, nor does it always apply to non-citizen children; 3) some statesSteven A. Camarota is the director of research and Karen Zeigler is a demographer at the Center. Fax 202.466.8076 www.cis.org1629NW,NW,SuiteSuite600, Washington,DC 20006 DCPhone202.466.81851629KKStreet,Street,600 Washington,20006 (202) 466-8185 center@cis.org www.cis.org1
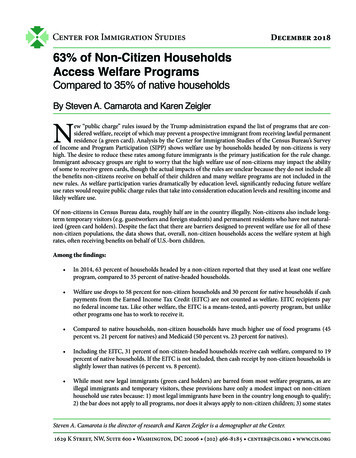
Center for Immigration Studiesprovide welfare to new immigrants on their own; and, most importantly, 4) non-citizens (including illegal immigrants) can receive benefits on behalf of their U.S.-born children who are awarded U.S. citizenship and full welfareeligibility at birth.The following figures include EITC: No single program explains non-citizens’ higher overall welfare use. For example, not counting school lunch andbreakfast, welfare use is still 61 percent for non-citizen households compared to 33 percent for natives. Not countingMedicaid, welfare use is 55 percent for immigrants compared to 30 percent for natives. Welfare use tends to be high for both newer arrivals and long-time residents. Of households headed by non-citizensin the United States for fewer than 10 years, 50 percent use one or more welfare programs; for those here more than10 years, the rate is 70 percent. Welfare receipt by working households is very common. Of non-citizen households receiving welfare, 93 percenthave at least one worker, as do 76 percent of native households receiving welfare. In fact, non-citizen households aremore likely overall to have a worker than are native households.1 The primary reason welfare use is so high among non-citizens is that a much larger share of non-citizens have modest levels of education and, as a result, they often earn low wages and qualify for welfare at higher rates than natives. Of all non-citizen households, 58 percent are headed by immigrants who have no more than a high school education, compared to 36 percent of native households. Of households headed by non-citizens with no more than a high school education, 81 percent access one or morewelfare programs. In contrast, 28 percent of non-citizen households headed by a college graduate use one or morewelfare programs. Like non-citizens, welfare use also varies significantly for natives by educational attainment, with the least educatedhaving much higher welfare use than the most educated. Using education levels and likely future income to determine the probability of welfare use among new green cardapplicants — and denying permanent residency to those likely to utilize such programs — would almost certainlyreduce welfare use among future permanent residents. Of households headed by naturalized immigrants (U.S. citizens), 50 percent used one or more welfare programs.Naturalized-citizen households tend to have lower welfare use than non-citizen households for most types of programs, but higher use rates than native households for virtually every major program. Welfare use is significantly higher for non-citizens than for natives in all four top immigrant-receiving states. InCalifornia, 72 percent of non-citizen-headed households use one or more welfare programs, compared to 35 percentfor native-headed households. In Texas, the figures are 69 percent vs. 35 percent; in New York they are 53 percent vs.38 percent; and in Florida, 56 percent of non-citizen-headed households use at least welfare program, compared to35 percent of native households.2
Center for Immigration StudiesMethodsPrograms Examined. The major welfare programs examined in this report are Supplemental Security Income (SSI), Temporary Assistance to Needy Families (TANF), the Earned Income Tax Credit (EITC), the Women, Infants, and Children (WIC)food program, free or subsidized school lunch and breakfast, food stamps (officially called the Supplemental Nutrition Assistance Program or SNAP), Medicaid, public housing, and rent subsidies.Data Source. Data for this analysis comes from the public-use file of the 2014 Survey of Income and Program Participation(SIPP), which is the newest SIPP data available.2 The SIPP is a longitudinal dataset consisting of a series of “panels”. Eachpanel is a nationally representative sample of U.S. households that is followed over several years. The survey was redesignedfor 2013 with 2014 as the second wave of the new panel. We use the 2014 SIPP for this analysis. Like all Census surveys ofthis kind, welfare use is based on self-reporting in the SIPP, and as such there is some misreporting in the survey. All meansand percentages are calculated using weights provided by the Census Bureau.Why Use the SIPP? The SIPP is ideally suited for studying welfare programs because, unlike other Census surveys that measure welfare, the SIPP was specifically designed for this purpose. As the Census Bureau states on its website, the purpose ofthe SIPP is to “provide accurate and comprehensive information about the income and program participation of individualsand households.”3 In addition to the SIPP, the only other government surveys that identify immigrants and at the same timemeasure welfare use for the entire population are the American Community Survey (ACS) and the Current Population Survey’s Annual Social and Economic Supplement, often abbreviated as CPS ASEC or just ASEC. The ACS is a very large survey,but only asks about a few programs. The ASEC is released on a more timely basis than the SIPP and asks about more programs than the ACS, but it does not include the EITC; the ASEC also is not specifically designed to capture receipt of welfareprograms. As we discuss at length in a prior study published in 2015, based on 2012 SIPP data, there is general agreementamong researchers that the SIPP does a better job of capturing welfare use than other Census Bureau surveys, including theASEC and ACS.4 More recent analysis confirms this conclusion.5One recent improvement in the SIPP that was not available when we conducted our 2015 study is the inclusion of a question on use of the EITC, making for even more complete coverage of the nation’s welfare programs. The EITC is by far thenation’s largest cash program to low-income workers, paying out nearly 60 billion in 2014.6 Unfortunately for immigrationresearch, the SIPP survey for 2014 no longer asks respondents about their current immigration status.7 As other researchershave pointed out, individuals in prior SIPPs who are non-citizens and report that they are currently not permanent residentsare almost entirely illegal immigrants, with a modest number of long-term temporary visitors (e.g., guestworkers and foreignstudents) also included.8As we showed in our 2015 analysis using the 2012 SIPP, 66 percent of households headed by non-citizens who do not havea green card, and who are mostly illegal immigrants, have very high welfare use rates — excluding the EITC.9 With the new2014 SIPP, we can no longer identify likely illegal immigrants with the same ease. However, we do know that about half ofnon-citizens in Census Bureau data are illegal immigrants, which we would expect to make welfare use for non-citizens ingeneral low, as those in the country without authorization are barred from almost all federal welfare programs.10 But like ourprior analysis using the 2012 SIPP, this report shows that welfare use by households headed by illegal immigrants must besignificant for the overall rate of welfare use among non-citizens to look as it does in this report.Examining Welfare Use by Household. A large body of prior research has examined welfare use and the fiscal impact ofimmigrants by looking at households because it makes the most sense. The National Research Council did so in its fiscalestimates in 1997 because it argued that “the household is the primary unit through which public services are consumed.”11In their fiscal study of New Jersey, Deborah Garvey and Thomas Espenshade also used households as the unit of analysisbecause “households come closer to approximating a functioning socioeconomic unit of mutual exchange and support.”12Other analyses of welfare use and programs, including by the U.S. Census Bureau, have also used the household as the basisfor studying welfare use.13 The late Julian Simon of the Cato Institute, himself a strong immigration advocate, pointed outthat, “One important reason for not focusing on individuals is that it is on the basis of family needs that public welfare, Aidto Families with Dependent Children (AFDC), and similar transfers are received.”143
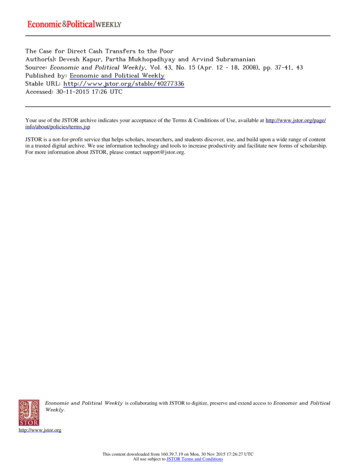
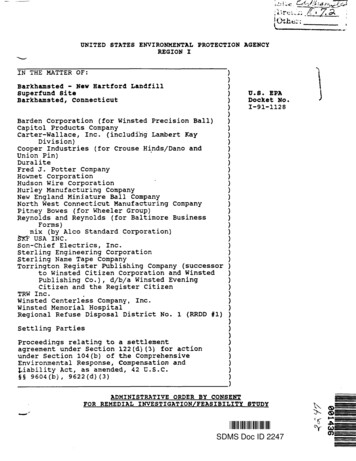
Center for Immigration StudiesThe primary reason researchers have not looked at individuals is that, as Simon pointed out, eligibility for welfare programsis typically based on the income of all family or household members. Moreover, welfare benefits can often be consumed byall members of the household, such as food purchased with food stamps. Also, if the government provides food or healthinsurance to children, it creates a clear benefit to adult members of the household who will not have to spend money on thesethings. In addition, some of the welfare use variables in the SIPP are reported at the household level, not the individual level.Some advocates for expansive immigration argue that household comparisons are unfair or biased against immigrants because someday the children who receive welfare may possibly pay back the costs of these programs in taxes as adults. Ofcourse, the same argument could be made for the children of natives to whom immigrants are compared in this analysis.Moreover, excluding children obscures the fundamental issue that a very large share of immigrants are unable to supporttheir own children and turn to taxpayer-funded means-tested programs. In terms of the policy debate over immigration andthe implications for public coffers, this is the central concern.Figure 1. Welfare use is higher for every type of immigrant household than for nativehouseholds, with the exception of housing programs.Non-Citizen Households70%60%50%40%63%All Immigrant Households (Citizen and Non-Citizen)55%50%35%30%Naturalized Citizen HouseholdsNative Households31% 29%50%45%42%37%35%28%28%20%23%21%19%10%04% 5% 6% 5%Any WelfareCashFoodMedicaidHousingSource: 2014 Survey of Income and Program Participation.Cash welfare includes the EITC, SSI, and TANF. Food assistance includes food stamps, WIC, and the school lunch/breakfast programs. Housing includes subsidized and public housing.4
n-CitizenHeaded Households w/o AdultNatives1Source: 2014 Survey of Income and Program Participation.1Households with natives 21 and older are excluded.2Arrived in 2005 or later.3Arrived before 0.4%3.8%15.2%23.3%4.7%CashCash (Excluding EITC)SSITANFEITCFoodSchool Lunch and/or BreakfastWICSNAPMedicaidHousingWeighted NSample Size34.6%30.4%Any WelfareAny Welfare (Excluding lds2,630,71138126.4%2.2%1.5% .5%25.4%32.0%20.8%15.7%16.4%38.5%3.0%49.6%42.1% 10 8.1%26.5%56.1%4.4%69.6%66.1% 10 yrs.3Households Headed byNon-Citizen in U.S. 5.3%49.9%NaturalizedAll ImmiAll ImmigrantNaturalized- Citizen-Head- grant-Headed Headed HouseCitizen- ed HouseholdsHouseholds holds (Citizen &Headedw/o Adult(Citizen & Non-Citizen w/oHouseholdsNatives1 Non-Citizen)Adult Natives1Table 1. Welfare Use Based on Nativity of Household HeadCenter for Immigration Studies5
Center for Immigration StudiesTable 2. Welfare Use by Nativity, Excluding One Program at a TimeNative- Non-CitizenHeadedHeadedHouseholds HouseholdsAny WelfareExcluding EITCExcluding SSIExcluding TANFExcluding School LunchExcluding WICExcluding SNAPExcluding MedicaidExcluding HousingWeighted NSample SizeNon-Citizen NaturalizedHeaded HouseCitizenholds w/o AdultHeadedNatives* HouseholdsAll ImmigrantHeaded Households (Citizen 34,4552,859Source: 2014 Survey of Income and Program Participation.* Households with natives 21 and older are excluded.6
Center for Immigration StudiesTable 3. Welfare Use by Nativity and EducationNative-Headed HouseholdsLess thanH.S.No morethan a H.S.H.S. Only Education1Non-Citizen-Headed HouseholdsSomeCollegeBachelor’sor MoreLess thanH.S.No morethan a H.S.H.S. Only Education1SomeCollegeBachelor’sor MoreAny WelfareAny Welfare (Excluding 19.6%CashCash (Excluding EITC)SSITANFEITCFoodSchool Lunch and/or ,5025,92438,578,249 d NSample SizeNaturalized-Citizen-Headed HouseholdsLess thanH.S.No morethan a H.S.H.S. Only Education1All Immigrant-Headed Households2SomeCollegeBachelor’sor MoreLess thanH.S.No morethan a H.S.H.S. Only Education1SomeCollegeBachelor’sor MoreAny WelfareAny Welfare (Excluding 26.7%CashCash (Excluding EITC)SSITANFEITCFoodSchool Lunch and/or 23,4603924,390,740 78,745,506 3,530,3851,4835056,858,563895Weighted NSample SizeSource: 2014 Survey of Income and Program Participation.1Combines those with less than a high school education and those with only a high school education.2Naturalized and non-citizens.7
Center for Immigration StudiesTable 4. Welfare Use for Households with ChildrenNative- Non-CitizenHeadedHeadedHouseholds HouseholdsNon-Citizen NaturalizedHeaded HouseCitizenholds w/o AdultHeadedNatives* HouseholdsAll ImmigrantHeaded Households (Citizen &Non-Citizen)Any WelfareAny Welfare (Excluding 68.1%CashCash (Excluding EITC)SSITANFEITCFoodSchool Lunch and/or 09Weighted NSample SizeSource: 2014 Survey of Income and Program Participation.* Households with natives 21 and older are excluded.Table 5. Welfare Use for Households without ChildrenNative- Non-CitizenHeadedHeadedHouseholds HouseholdsNon-Citizen NaturalizedHeaded HouseCitizenholds w/o AdultHeadedNatives* HouseholdsAll ImmigrantHeaded Households (Citizen &Non-Citizen)Any WelfareAny Welfare (Excluding 32.5%CashCash (Excluding EITC)SSITANFEITCFoodSchool Lunch and/or BreakfastWICSNAPMedicaidHousing12.8%6.4%5.9% 0.5%7.0%11.3% 0.5% 0.5%11.1%15.1%4.1%19.9%6.6%6.2% 0.5%14.8%12.8% 0.5%1.7%11.9%21.4%4.8%19.8%5.9%5.7% 0.5%15.0%12.5% 0.5%1.5%11.4%20.2%5.2%24.4%13.8%13.0% 0.5%11.7%14.2% 0.5%0.9%13.7%29.2%7.9%23.0%11.6%11.0% 0.5%12.7%13.8% 2,545,6743786,948,7539939,996,2081,451Weighted NSample SizeSource: 2014 Survey of Income and Program Participation.* Households with natives 21 and older are excluded.8
Center for Immigration StudiesTable 6. Households with at Least One WorkerNative- Non-CitizenHeadedHeadedHouseholds HouseholdsNon-Citizen NaturalizedHeaded HouseCitizenholds w/o AdultHeadedNatives* HouseholdsAll ImmigrantHeaded Households (Citizen &Non-Citizen)Any WelfareAny Welfare (Excluding 49.1%CashCash (Excluding EITC)SSITANFEITCFoodSchool Lunch and/or 2,450Weighted NSample SizeSource: 2014 Survey of Income and Program Participation.* Households with natives 21 and older are excluded.9
Center for Immigration StudiesTable 7. Welfare Use by Nativity & Education for Households with at Least One WorkerNative-Headed HouseholdsLess thanH.S.No morethan a H.S.H.S. Only Education1Non-Citizen-Headed HouseholdsSomeCollegeBachelor’sor MoreLess thanH.S.No morethan a H.S.H.S. Only Education1SomeCollegeBachelor’sor MoreAny WelfareAny Welfare (Excluding 19.4%CashCash (Excluding EITC)SSITANFEITCFoodSchool Lunch and/or 63,98625,137,022 d NSample SizeNaturalized-Citizen-Headed HouseholdsLess thanH.S.No morethan a H.S.H.S. Only Education1All Immigrant-Headed Households2SomeCollegeBachelor’sor MoreLess thanH.S.No morethan a H.S.H.S. Only Education1SomeCollegeBachelor’sor MoreAny WelfareAny Welfare (Excluding 25.5%CashCash (Excluding EITC)SSITANFEITCFoodSchool Lunch and/or 8003043,279,814 27,293,057 3,122,3481,2294426,210,870796Weighted NSample SizeSource: 2014 Survey of Income and Program Participation.1Combines those with less than a high school education and those with only a high school education.2Naturalized and non-citizens.10
Center for Immigration StudiesTable 8. Welfare Use Based on Nativityand Region of Origin of Household ativesAny WelfareAny Welfare (Excluding 30.4%CashCash (Excluding EITC)SSITANFEITCFoodSchool Lunch and/or BreakfastWICSNAPMedicaidHousing18.7%3.6%3.6% 0.5%18.7%14.1%4.4%6.0%12.6%24.3%2.0%16.3%3.2%2.3% 2%33.1%61.2%46.7%23.5%29.6%64.4%5.1%22.0%1.2%1.2% 0.5%22.0%24.8%14.9%11.0%12.4%28.9% 454,45619,432Weighted NSample SizeNaturalized y WelfareAny Welfare (Excluding 30.4%CashCash (Excluding EITC)SSITANFEITCFoodSchool Lunch and/or ghted NSample SizeAll Immigrants (Naturalized and esAny WelfareAny Welfare (Excluding 30.4%CashCash (Excluding EITC)SSITANFEITCFoodSchool Lunch and/or ghted NSample SizeSource: 2014 Survey of Income and Program Participation.11
Center for Immigration StudiesTable 9. Welfare by the Nativityand Race of the Household HeadNon-CitizensHispanicWhiteBlackAsianAllAny WelfareAny Welfare (Excluding 57.7%CashCash (Excluding EITC)SSITANFEITCFoodSchool Lunch and/or .3%64.1%49.0%25.2%30.7%66.2%4.9%13.5%3.6%3.6% 0.5%12.1%13.9%6.3%3.2%10.5%23.9%1.9%28.9%3.4%3.4% 0.5%26.3%29.8%21.2%9.2%16.8%41.2%5.0%16.9%3.5%2.6% d NSample SizeNaturalized CitizensHispanicWhiteBlackAsianAllAny WelfareAny Welfare (Excluding 44.3%CashCash (Excluding EITC)SSITANFEITCFoodSchool Lunch and/or 25.3%41.3%27.1%9.1%19.6%47.4%6.2%20.0%10.1%9.4% % Weighted NSample SizeSource: 2014 Survey of Income and Program Participation.Hispanics can be of any race and are excluded from the other categories.12
Center for Immigration StudiesTable 9. Welfare by the Nativityand Race of the Household Head (Cont.)All Immigrants (Naturalized and Non-Citizen)HispanicWhiteBlackAsianAllAny WelfareAny Welfare (Excluding 49.5%CashCash (Excluding EITC)SSITANFEITCFoodSchool Lunch and/or ghted NSample SizeAll NativesHispanicWhiteBlackAsianAllAny WelfareAny Welfare (Excluding 30.4%CashCash (Excluding EITC)SSITANFEITCFoodSchool Lunch and/or 9,432Weighted NSample SizeSource: 2014 Survey of Income and Program Participation.Hispanics can be of any race and are excluded from the other categories.13
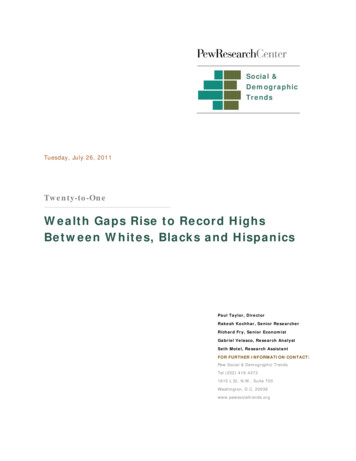
Center for Immigration StudiesFigure 2. The share of immigrant households using at least one welfareprogram is higher than natives in every top immigrant-receiving state.Non-Citizen HouseholdsAll Immigrant Households (Citizen and Non-Citizen)72%Naturalized Citizen Households63%Native Households57%53%57% 59%69%56% 57% 58%57%44%38%35%CaliforniaNew York35%Texas35%FloridaSource: 2014 Survey of Income and Program Participation.Cash welfare includes the EITC, SSI, and TANF. Food assistance includes food stamps, WIC, and the school lunch/breakfast programs. Housing includes subsidized and public housing.14
Center for Immigration StudiesTable 10. Welfare Use in CaliforniaNative- Non-CitizenHeadedHeadedHouseholds HouseholdsNon-Citizen NaturalizedHeaded HouseCitizenholds w/o AdultHeadedNatives* HouseholdsAll ImmigrantHeaded Households (Citizen &Non-Citizen)Any WelfareAny Welfare (Excluding 58.2%CashCash (Excluding EITC)SSITANFEITCFoodSchool Lunch and/or 9Non-Citizen NaturalizedHeaded HouseCitizenholds w/o AdultHeadedNatives* HouseholdsAll ImmigrantHeaded Households (Citizen &Non-Citizen)Weighted NSample SizeSource: 2014 Survey of Income and Program Participation.* Households with natives 21 and older are excluded.Table 11. Welfare Use in New YorkNative- Non-CitizenHeadedHeadedHouseholds HouseholdsAny WelfareAny Welfare (Excluding 52.4%CashCash (Excluding EITC)SSITANFEITCFoodSchool Lunch and/or BreakfastWICSNAPMe
Analysis by the Center for Immigration Studies of the Census Bureau's Survey of Income and Program Participation (SIPP) shows welfare use by households headed by non-citizens is very . In contrast, 28 percent of non-citizen households headed by a college graduate use one or more welfare programs. Like non-citizens, welfare use also .