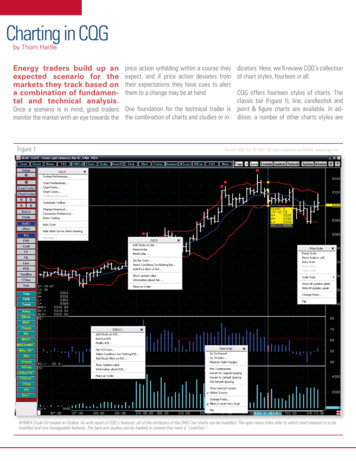
Transcription
Point and FigureChartingAlan Clement
About Alan Clement Been involved with financial markets forover 20 yearsIFTA Certified Financial TechnicianTrading for a living for 7 yearsUse 100% Technical AnalysisMechanical TraderDesign mechanical trading systemsContribute to The Age Technical Analysiscolumn
What I Use PriceIntermarket AnalysisCandlestick ChartsIchimoku Cloud ChartsPoint & Figure Charts
What is Point & Figure Charting? A method of charting price, withoutreference to time.One of the oldest price chartingmethods known.A very efficient method of followingprice action as it develops.An objective method of determiningtrends and price breakouts.
Why Use Point & Figure? Get clarity on the “Big Picture”Objectively gauge trends andconsolidationEasily spot areas of potential supportand resistanceEasily locate areas of congestionCalculate price targetsDerive trading signals and easilymeasure risk/reward ratios
Point & Figure Advantages Removes noise giving greater clarityGranularity can be easily controlledProvides an objective indication oftrendStrength of trend can be easilymeasuredAreas of future support / resistancecan be objectively determinedUncannily accurate price targets
How Point & Figure Differs Less detail on chartNo gapsTraditional patterns less obviousNo time dimensionArguably stronger trading signals
Chart Example
Point & Figure Construction Box Size? General rule of thumb is to use 1% ofthe current price rounded to nearest 1,5, 10, 100 etc Reversal Size? 3 box reversal is standard Price element? Closing price
P&F Construction
P&F Construction136513501335132013051290127512601245
P&F Construction13651350X1335XX O X1320X O X O X1305X O X O X1290X OO X1275XO1260X1245X
S&P500 Weekly 15 x 3
Adjusting Granularity Increase and decrease box size to seemore granularity on the chartThis is analogous to switching timeframeson bar / candle chartsSmaller box size will introduce more“noise” in the price action.Larger box size will compress chart data.Think of it like zooming in and zoomingout.
S&P500 15 box size
S&P500 10 box size
S&P500 5 box size
S&P500 15 box size
S&P500 25 x 3
Patterns & Signals
Patterns & Signals
Patterns & Signals
Patterns & Signals
Bullish Shakeout or BearishCatapult setting up?13651350X1335XX O X1320X O X O X1305X O X O X1290X OO X1275XO1260X1245X
Low PoleHigh PoleSellBuy
Let’s Find Some Patterns
Trends Trendlines always drawn at 45degrees to the square grid fromsignificant high or lowTrend broken when a break oftrendline occurs with a valid patternAs soon as a valid trend breakoccurs, a trendline in the oppositedirection can be drawn
Trendlines
Support & Resistance
cf. Candlestick
Targets Vertical Targets are calculated from thefirst major thrust off a significant high orlow.Target Number of Xs or Ox in firstthrust column times box size timesreversal size added to low or subtractedfrom high.Easy way: 3 times height of first columnfrom high / lowTargets given must be activated with apattern before valid
Target ExamplesShort Target example:High (1575) less [10 “O”s X boxsize (15) X reversal (3)](10 X 15 X 3) 4501575 – 450 1110Long Target example:Low (690) plus [17 “X”s X boxsize (15) X reversal (3)](17 X 15 X 3) 765690 765 1455
Some Target Tips Targets have no timescaleAre previous targets in the samedirection being achieved?Clustered counts enhance probabilityCount negationOpposing countsCombine counts with trendlines
Target Tips
Using P&F for Entry Signals Don’t take every DTBO and DBBOLook for congestion followed byhigher probability patternTake signals in the direction of thetrendUse column lows / highs to positionyour stopUse targets to calculate risk / rewardratio
Entry Signals
That’s enough theory, let’sanalyse some charts!
Swiss Franc 1 x 3
Hang Seng 250 x 3
Gold 15 x 3
Feed Cattle 1 x 3
Silver 50 x 3
US Dollar 0.5 X 3
Corn 5 x 3
Wheat 10 x 3
Wheat 5 x 3
AUD/USD 0.01 X 3
AUD/USD 0.0075 X 3
AUD/USD 0.005 X 3
Advanced Topics to Investigate Different reversal sizesLog Scale ChartsHorizontal CountsUse P&F as an IndicatorUse as Market Breadth indicationMoving AveragesParabolic SARBollinger Bands
Summary P&F is a great addition to your tradingarmoury, to be used alongside your othertechniquesGet the Big Picture and an objective viewof trend and targetsStart with a 1% box size and drill downand up for more / less granularityLook for highest probability setups whentrading off P&F chartsLook for clustering targets in the directionof the trend
Further StudyThe Definitive Guide to Point andFigure – Jeremy du PlessisKaplan – Short Course 9063:Specialist Techniques in TAas part of the ATAA Diploma in TASee www.ataa.com.au
Point & Figure Advantages Removes noise giving greater clarity Granularity can be easily controlled Provides an objective indication of trend Strength of trend can be easily measured Areas of future support / resistance can be objectively determined Uncannily accurate price targets.