Transcription
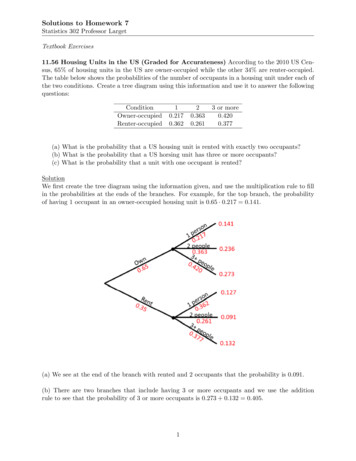
Solutions to Homework 7Statistics 302 Professor LargetTextbook Exercises11.56 Housing Units in the US (Graded for Accurateness) According to the 2010 US Census, 65% of housing units in the US are owner-occupied while the other 34% are renter-occupied.The table below shows the probabilities of the number of occupants in a housing unit under each ofthe two conditions. Create a tree diagram using this information and use it to answer the ccupied10.2170.36220.3630.2613 or more0.4200.377(a) What is the probability that a US housing unit is rented with exactly two occupants?(b) What is the probability that a US horsing unit has three or more occupants?(c) What is the probability that a unit with one occupant is rented?SolutionWe first create the tree diagram using the information given, and use the multiplication rule to fillin the probabilities at the ends of the branches. For example, for the top branch, the probabilityof having 1 occupant in an owner-occupied housing unit is 0.65 · 0.217 0.141.(a) We see at the end of the branch with rented and 2 occupants that the probability is 0.091.(b) There are two branches that include having 3 or more occupants and we use the additionrule to see that the probability of 3 or more occupants is 0.273 0.132 0.405.1
(c) This is a conditional probability (or Bayes? rule). We have:P (rent if 1) P (rent and 1 person)0.1270.127 0.474P (1person)0.141 0.1270.268If a housing unit has only 1 occupant, the probability that it is rented is 0.474.11.83 Owner-Occupied Household Size (Graded for Accurateness) The table below givesthe probability function for the random variable giving the household size for an owner-occupiedhousing unit in the (a) Verify that the sums of the probabilities is 1 (up to round-off error).(b) What is the probability that a unit has only one or two people in it?(c) What is the probability that a unit has five or more people in it?(d) What is the probability that more than one person lives in a US owner-occupied housingunit?Solution(a) We see that 0.217 0.363 0.165 0.145 0.067 0.026 0.018 1.001. This is different from1 just by round-off error on the individual probabilities.(b) We have p(1) p(2) 0.217 0.363 0.580.(c) We have p(5) p(6) p(7) 0.067 0.026 0.018 0.111.(d) It is easiest to find this probability using the complement rule, since more than 1 occupantis the complement of 1 occupant for this random variable. The answer is 1 p(1) 1 0.217 0.783.11.85 Average Household Size for Owner-Occupied Units (Graded for Accurateness)The table shown in the previous question gives the probability function for the random variablegiving the household size for an owner-occupied housing unit in the US.(a) Find the mean household size.(b) Find the standard deviation for household size.Solution(a) We multiply the values of the random variable by the corresponding probability and add upthe results. We haveµ 1(0.217) 2(0.363) 3(0.165) 4(0.145) 5(0.067) 6(0.026) 7(0.018) 2.635The average household size for an owner-occupied housing unit in the US is 2.635 people.(b) To find the standard deviation, we subtract the mean of 2.635 from each value, square thedifference, multiply by the probability, and add up the results to find the variance; then take asquare root to find the standard deviation.σ 2 (1 2.635)2 · 0.217 (2 2.635)2 · 0.363 · · · (7 2.635)2 · 0.0182
2.03072 σ 2.03072 1.42511.87 Fruit Fly Lifetimes (Graded for Completeness) Suppose that the probability functionshown below reflects the possible lifetimes (in months after emergence) for fruit flies.xp(x)10.302?30.2040.1550.1060.05(a) What proportion of fruit flies die in their second month?(b) What is the probability that a fruit fly lives more than four months?(c) What is the mean lifetime for a fruit fly?(d) What is the standard deviation of fruit fly lifetimes?SolutionLet the random variable X measure fruit fly lifetimes (in months).(a) The probabilities must add to 1, so the proportion of dying in the second month isP (X 2) 1 (0.30 0.20 0.15 0.10 0.05) 1 0.80 0.20(b) P (X 4) P (X 5) P (X 6) 0.10 0.05 0.15(c) The mean fruit fly lifetime isµ 1(0.30) 2(0.20) 3(0.20) 4(0.15) 5(0.10) 6(0.05) 2.7 months(d) The standard deviation of fruit fly lifetimes isσ (1 2.7)2 · 0.30 (2 2.7)2 · 0.20 · · · (6 2.7)2 · 0.05 2.31 1.52 months11.95 Getting to the Finish (Graded for Completeness) In a certain board game participantsroll a standard six-sided die and need to hit a particular value to get to the finish line exactly. Forexample, if Carol is three spots from the finish, only a roll of 3 will let her win; anything else andshe must wait another turn to roll again. The chance of getting the number she wants on any rollis p 1/6 and the rolls are independent of each other. We let a random variable X count thenumber of turn until a player gets the number needed to win. The possible values of X are 1,2,3,.and the probability function for any particular count is given by the formulaP (X k) p(1 p)k 1(a) Find the probability a player finishes on the third turn.(b) Find the probability a player takes more than three turns to finish.Solution(a) Using the formula for the probability function with p 1/6 and k 3 we have 211 3 115P (X 3) 1 0.11666663
(b) The event “more than three turns to finish” or X 3 includes X 4, 5, 6, ., an infinite numberof possible outcomes! Fortunately we can use the complement rule.P (X 3) 1 (p(1) p(2) p(3))" 1 2 #15 01515 1 666666 1 [0.1667 0.1389 0.1157] 1 0.4213 0.578711.117 Boys or Girls? (Graded for Completeness) Worldwide, the proportion of babies whoare boys is about 0.51. A couple hopes to have three children and we assume that the sex of eachchild is independent of the others. Let the random variable X represent the number of girls in thethree children, so X might be 0, 1, 2, or 3. Give the probability function for each value of X.SolutionA probability function gives the probability for each possible value of the random variable. Thisis a binomial random variable with n 3 and p 0.49 (since we are counting the number of girlsnot boys). The probability of 0 girls is: 3(0.490 )(0.513 ) 1 · 1 · 0.513 0.133P (X 0) 0The probability of 1 girl is: 3P (X 1) (0.491 )(0.512 ) 3 · (0.491 )(0.512 ) 0.3821The probability of 2 girls is: 3P (X 2) (0.492 )(0.511 ) 3 · (0.492 )(0.511 ) 0.3672The probability of 3 girls is: 3P (X 3) (0.493 )(0.510 ) 1 · (0.493 ) · 1 0.1183We can summarize these results with a table for the probability function.xp(x)00.13310.38220.36730.118Notice that the four probabilities add up to 1, as we expect for a probability function.11.121 Owner-Occupied Housing Units (Graded for Accurateness) In the 2010 US Census, we learn that 65% of all housing units are owner-occupied while the rest are rented. If we takea random sample of 20 housing units, find the probability that:4
(a) Exactly 15 of them are owner-occupied.(b) 19 or more of them are owner-occupied.SolutionIf X is the random variable giving the number of owner-occupied units in a random sample of 20housing units in the US, then X is a binomial random variable with n 20 and p 0.65.(a) To find P (X 15), we first calculate2015 20!15!(5!) 15, 504. We then find 20P (X 15) (0.6515 )(0.355 ) 15, 504(0.6515 )(0.355 ) 0.1272.15(b) We know that P (X 18) P (X 18) P (X 19) P (X 20), and we calculate each ofthe terms separately and add them up. We have 20P (X 18) (0.6518 )(0.352 ) 190(0.6518 )(0.352 ) 0.010018 20P (X 19) (0.6519 )(0.351 ) 20(0.6519 )(0.351 ) 0.002019 20P (X 20) (0.6520 )(0.350 ) 1 · (0.6520) · 1 0.000220Then we haveP (X 18) P (X 18) P (X 19) P (X 20) 0.0100 0.0020 0.0002 0.012211.128 Airline Overbooking (Graded for Accurateness) Suppose that past experience showsthat about 10% of passengers who are schedule to take a particular flight fail to show up. For thisreason, airlines sometimes overbook flights, selling more tickets than they have seats, with theexpectation that they will have some no shows. Suppose an airline used a small jet with seatingfor 30 passengers on a regional route and assume that passengers are independent of each other inwhether they show up for the flight. Suppose that the airline consistently sells 32 tickets for everyone of these flights.(a) On average, how many passengers will be on each flight?(b) How often will they have enough seats for all of the passengers who show up for the flight?SolutionLet X measure the number of passengers (out of 32) who show up for a flight. For each passengerwe have a 90% chance of showing up, so X is a binomial random variable with n 32 and p 0.90.(a) The mean number of passengers on each flight is µ np 32(0.9) 28.8 people.(b) Everyone gets a seat when X 30. To find this probability we use the complement rule(find the chance too many people show up with X 31 or X 32, then subtract from one.)P (X 30) 1 [P (X 31) P (X 32)] 3232311320 1 0.9 0.1 0.9 0.131325
1 [32 · 0.931 (0.1) 1 · 0.932 · 1] 1 [0.122 0.034] 1 0.156 0.844Everyone will have a seat on about 84.4% of the flights. The airline will need to deal with overbooked passengers on the other 15.6% of the flights.Computer ExercisesFor each R problem, turn in answers to questions with the written portion of the homework.Send the R code for the problem to Katherine Goode. The answers to questions in the written partshould be well written, clear, and organized. The R code should be commented and well formatted.R problem 1 (Graded for Completeness) Use the data on page 280 from Exercise 4.136to use R to compute a p-value from the exact probability distribution. Compare with the answeryou get from 10,000 simulations of the randomization distribution using R. (Either write new codeor reuse code from a previous assignment for the randomization test.)SolutionIn 1980, it was shown that the active ingredient in marijuana outperformed a placebo in reducingnausea in chemotherapy patients. Further experiments have been performed to determine if thedrug has other medicinal uses. The experiment which we are interested in done on 55 patients withHIV. The patients were randomly assigned to two groups. One group received cannabis (marijuana)and the other group received a placebo. All of the patients had severe neuropathic pain, and theresponse variable is whether or not pain was reduced by 30% or more. The following table showsthe data from the experiment.CannabisPlaceboTotalPain Reduced14721Pain Not Reduced132134Total272855We are interested in determine whether marijuana is more effective than the placebo in relievingpain.pc proportion of cannabis patients who had their pain reduced by more than 30%pp proportion of placebo patients who had their pain reduced by more than 30%Thus, we are interested in testing the following hypotheses.H0 : pc pp vs HA : pc ppOur observed statistics are as follows.pc 14 0.51927pp 67 0.2528
CannabisPlaceboPain Reduced156Pain Not Reduced1222In order to determine the p-value, we need to consider the cases where the number of cannabispatients who had reduced pain is greater than 14 since these are the cases, which are more extreme.The following table is one case.Let X be the number of patients out of a sample of 27 cannabis patients who have reduced pain inthis study which has a total of 55 patients of which 21 have reduced pain. Thus, we consider thefollowing probability, which is our p-value.P (14 X 21) P (X 14 X 15 X 16 X 17 X 18 X 19 X 20 X 21) P (X 14) P (X 15) P (X 16) P (X 17) P (X 18) P (X 19) P (X 20) P (X 21)Consider thatP (X 14) # of ways to choose 27 cannabis patients out of the 55 total so 14 have reduced paintotal # of ways 27 cannabis patients can be chosen(choose 14 from 21 with reduced pain) (choose other 13 from 34 with no reduction)choose 27 from 55 total 211434 135527Thus,P (14 X 21) P (X 14 X 15 X 16 X 17 X 18 X 19 X 20 X 21) P (X 14) P (X 15) P (X 16) P (X 17) P (X 18) P (X 19) P (X 20) P (X 21) 21 3421 3421 13145527 12155527 3411 165527 3472120 ··· 5527 3462121 5527 0.03774This value can be found using all of the following methods in R.choose(21,14)*choose(34,13)/choose(55,27) choose(21,15)*choose(34,12)/choose(55,27) choose(21,16)*choose(34,11)/choose(55,27) choose(21,17)*choose(34,10)/choose(55,27) choose(21,18)*choose(34,9)/choose(55,27) choose(21,19)*choose(34,8)/choose(55,27) choose(21,20)*choose(34,7)/choose(55,27) (14:21,m 21,n 34,k 27))1-phyper(13,m 21,n 34,k 27)mat matrix(c(14, 7, 13, 21), nrow 2, ncol 2)matfisher.test(mat, alternative "greater")7
Now we use R to create a randomization with 10,000 simulations. This is done using the followingcode.p.hat - numeric(10000)p.c.observed.2 - 14/27for (i in 1:10000){c.2 - sum(sample(c(rep(1,21),rep(0,34)),size 27,replace FALSE))p.hat[i] - c.2/27}pvalue - sum(p.hat p.c.observed)/10000Doing this simulation, we calculate a p-value of 0.037. We note that this value is very similar tothe p-value calculated from the exact probability distribution.R problem 2 (Graded for Accurateness) Consider a hypothesis test H0 : µ 100 versusHA : µ 100 from data where the test statistic X̄ is normally distributed with mean µ and standard deviation 5 (so the sample size is large enough for the standard error to be 5).1. What would the p-value be if X̄ 108.7?SolutionThe p-value is calculated as follows.P (X̄ 108.7) 1 P (X̄ 108.7) 0.0409We used the following code in R to calculate this value.1-pnorm(108.7,100,5)2. What number c would X̄ need to exceed for the p-value to be less than 0.05?SolutionWe determine c in the following manner.P (X̄ c) 0.05 1 P (X̄ c) 0.05 0.95 P (X̄ c) 108.2243 cWe used the following code in R to calculate this value.qnorm(1-0.05,100,5)3. If the null hypothesis is true, what is the probability that the p-value, as calculated by an areaunder a normal curve, is less than 0.05?Solution8
First consider that when we calculate a p-value, we always assume the null hypothesis is true.Thus, we first calculateP (X̄ a) 0.05 P (X̄ a) 0.95 a 108.2243under the assumption that µ 100 and σ 5. Now, we are interested in determining theprobability that we would obtain a value that is greater than or equal to a 108.2243, and we aretold that the true distribution has µ 100. Thus,P (X̄ 108.2243) 1 P (X̄ 108.2243) 0.05We used the following code in R.qnorm(0.95,100,5)1-pnorm(108.2243,100,5)However, we also could have gotten the answer in this manner.1-pnorm(qnorm(0.95,100,5),100,5)4. If the true mean is 104, what is the probability that the p-value is less than 0.05?SolutionWe go through a similar process as in part (c), but this time, the true mean is 104. Thus, when wecalculate the probability that we would obtain a value that is greater than or equal to a 108.2243,we need to use µ 104, instead of µ 100. We obtain a probability of 0.199 using the followingR code.1-pnorm(qnorm(0.95,100,5),104,5)R problem 3 (Graded for Completeness) A male fruit fly is equally likely to have genotypeA or genotype B. If he has genotype A, then in a given cross, all offspring will have red eyes. If hehas genotype B, each offspring is equally likely to have red or white eyes, independent of all others.Assume that there are five offspring, all with red eyes.1. Given all five offspring have red eyes, what is the probability that the fly has genotype A?SolutionLetA genotype AB genotype BR all 5 offspring have red eyes9
ThenP (A R) P (A R)P (R)P (R A)P (A)P (R A) P (R B)P (R A)P (A)P (R A)P (A) P (R B)P (B) (1) 12 5 1 (1) 12 21212121 64 0.9696972. Given all five offspring have red eyes, what is the probability that a sixth offspring will also havered eyes?SolutionLetR all 5 offspring have red eyesS 6th offspring has red eyesThenP (S R) P (S R)P (R)P (S R A) P (S R B)P (R A) P (R B)P (S R A)P (A) P (S R B)P (B)P (R A)P (A) P (R B)P (B) 6 1 (1) 21 212 5 1 (1) 21 212 11 72 2 1 61 220.9848485R problem 4 (Graded for Accurateness) In a test to see if a person has ESP, the personidentifies a correct shape 33 out of 125 trials. The test is designed so that the number of correctanswers should be binomial with p 0.2 if the null hypothesis of no ESP is true.1. Use the R function pbinom() to compute a p-value for this hypothesis test.10
SolutionWe are interested in testing the following hypotheses.H0 :p 0.2HA :p 0.2We observed p̂ 33/125 0.264. If we let X the number of correctly identified shapes, thenthe p-value that we are interested in isP (33 X 125) 0.0502The R code used to compute this value is as follows. Any of these compute the correct answer.pbinom(125, 125, 0.2) - pbinom(32, 125, 0.2)sum(dbinom(33:125, 125, 0.2))1-pbinom(32,125,0.2)2. Use R to find a p-value from a randomization distribution (using code from a previous homeworkor new code). Compare to the previous result.SolutionIn order to find a p-value from a randomization distribution, I used the function created from aprevious homework for finding the p-value for a single proportion. The code is shown below.pvalue.p function(n,x,p0,R,alternative c("not.equal","less","greater")) {alternative match.arg(alternative)p.hat numeric(R)for ( i in 1:R ) {p.hat[i] mean(sample(c(0,1),size n,replace TRUE,prob c(1-p0,p0)))}p.sample x/nif ( alternative "not.equal" ) {if ( p.sample p0 ) {p.value 1}else if ( p.sample p0 ) {p.value 2*sum( p.hat p.sample ) / R}else if ( p.sample p0 ) {p.value 2*sum( p.hat p.sample ) / R}}else if ( alternative "less" ) {p.value sum( p.hat p.sample ) / R}else if ( alternative "greater" ) {p.value sum( p.hat p.sample ) / R}return( p.value )}11
For this particular problem, we have n 125, x 33, p0 0.2, and the alternative is greater than.We choose do 10,000 simulations. We obtain a p-value of 0.0488 using the following code.pvalue.p(125,33,0.2,10000,alternative "greater")We see that this p-value is similar to the one calculated in part (a).3. Find the mean and standard deviation of the number of correct guesses assuming no ESP.Calculate a p-value by approximating the binomial probability with an area under a normal curvewith the same mean and standard deviation. Compare the answer to the first result.SolutionSince X has a binomial distribution, we have thatµ np 125 · 0.2 25pp σ np(1 p) 125 · 0.2(1 0.2) 20 4.472136Now, we approximate the probabilityP (33 X 125) P (X 33)under the assumption that X N (25, 4.472).P (X 33) 1 P (X 33) 0.0368We obtain the p-value using the following R Code1-pnorm(33,25,4.472)12
Solutions to Homework 7 Statistics 302 Professor Larget Textbook Exercises 11.56 Housing Units in the U