Transcription
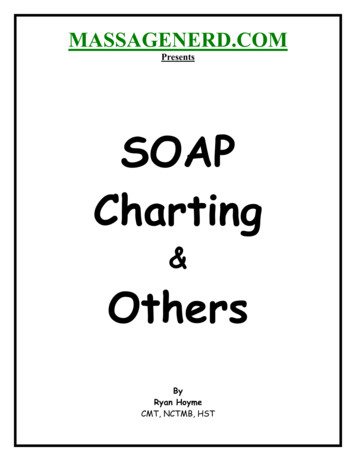
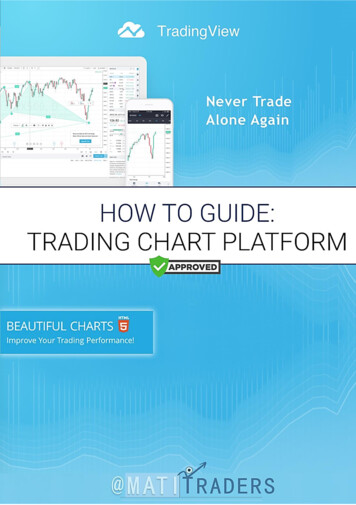
Charting in CQGby Thom HartleEnergy traders build up anexpected scenario for themarkets they track based ona combination of fundamental and technical analysis.price action unfolding within a course they dicators. Here, we’ll review CQG’s collectionexpect, and if price action deviates from of chart styles, fourteen in all.their expectations they have cues to alertthem to a change may be at hand.CQG offers fourteen styles of charts. Theclassic bar (Figure 1), line, candlestick andOnce a scenario is in mind, good traders One foundation for the technical trader is point & figure charts are available. In admonitor the market with an eye towards the the combination of charts and studies or in- dition, a number of other charts styles areFigure 1Source: CQG, Inc. 2007 All rights reserved worldwide. www.cqg.comNYMEX Crude Oil traded on Globex. As with much of CQG’s features, all of the attributes of the OHLC bar charts can be modified. The open menu titles refer to which chart element is to bemodified and lists manageable features. The bars and studies can be marked or colored that meet a “condition.”
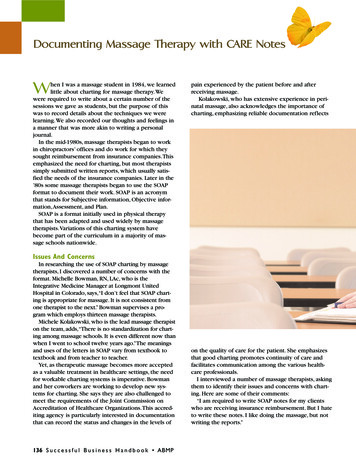
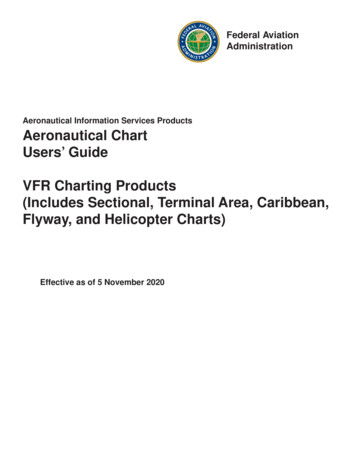
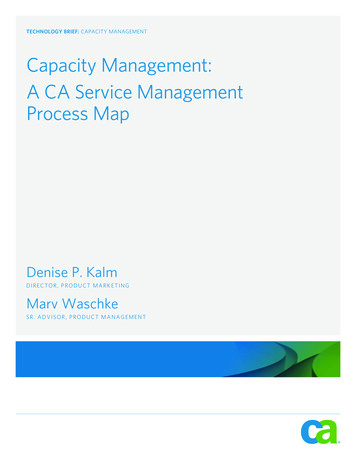
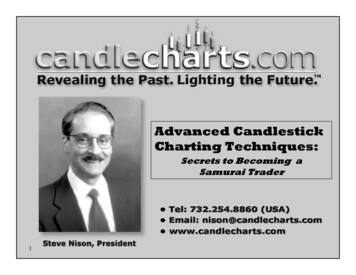
available that aid the trader in chartingmarkets that trade on a 24-basis and experience periods of low activity. Here is a list ofcharting styles available to the trader:BarLineTickSpread barCandlestickMarket ProfileConstant Volume BarFigure 2No gapTradeFlow Equalize SessionsPercent barYield barFill GapPoint & figureTradeFlow charts (Figure 2) highlight whattraders are doing: buying or selling. Othercharting styles display trades as the last price.You do not know whether a trader hit the bid(sold) or paid the ask price (buy) to generatethe last price. TradeFlow charts detail whether traders are lifting offers or hitting bids.Globex Traded Crude Oil TradeFlow Chart. TradeFlow is CQG’s innovative charting style where the TradeFlow bar is colorcoded to track traded volume executed at the ask price versus the bid price. The high and the low of the TradeFlow bar isthe best bid and ask prices.Figure 3TradeFlow chartshighlight whattraders are doing:buying or selling.The TradeFlow bar is color-coded on a percentage basis. The green portion representsthe total volume of executed trades at theask price for the TradeFlow bar. The red portion corresponds to the percentage of volumeof trades at the bid price (selling). The widthand the brightness of the TradeFlow bar isbased on a relative comparison of the currentbar’s volume to a range of volume listing inthe look back period.TradeFlow Charts and Energy Futures Trading. The TradeFlow chart is linked to the CQG DOMTrader as an aid for tradingenergy futures. The DOMTrader is one of CQG’s order routing interfaces. The bottom chart is a 5-minute chart. You can usea multiple time frame approach by tracking the 5-minute chart and executing trades in the DOMTrader based on the actionof the TradeFlow bars.Wide and brightly colored TradeFlow barsindicate heavy volume of trading, while nar-2
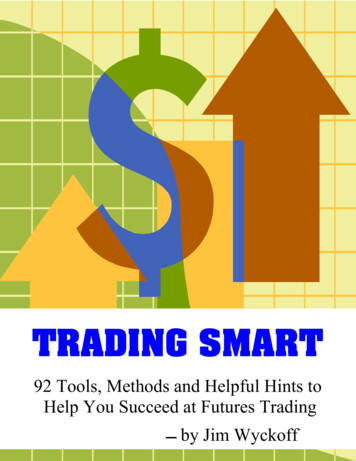
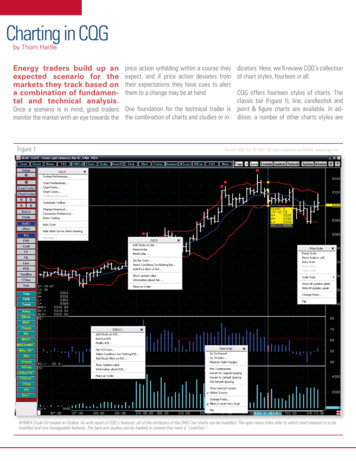
row and dark TradeFlow bars indicate lowparticipation by traders.Figure 4The study in the middle pane is the TradeFlowVolume study (TFVol). This study displaysthe traded volume at ask price as the greenhistogram bars and the traded volume intothe bid price as the red histogram bars. Thetraded volume at the bid is plotted as a negative number.The bottom study is the TradeFlow OnBalance Volume study (TFOBV), which isthe running sum of bid and ask volume.The default version of TradeFlow uses theinside market for the high and low of theTradeFlow bar. There is an aggregation feature available in CQG version 7.5 where theTradeFlow bars are built using a high-lowprice range based upon the minimum pricemovement (ticks), which compresses theprice action and executed volume information. The tick range can be from 1-20 ticks.In addition, CQG traders can create customstudies based on the TradeFlow elements.Bar, Candlestick, Point & Figure, and Line Charts. The energy contracts are displayed using four charting styles with studies.Figure 5TradeFlow Charts can be attached to theCQG DOMTrader (Figure 3, previous page)as an aid to trading energy futures. TheDOMTrader is one of CQG’s order routing interfaces. The depth-of-market view from theGlobex details the current bids and offersalong with the current size. The TradeFlowchart will detail the action traders take atthe best bid and ask prices. You can seewhether traders are hitting bids or payingthe ask price by the color-coding.Figure 4 displays examples of standardcharting types available: bar, candlestick,point & figure, and line charts. Figure 5presents an intraday tick and one minuteline charts (top charts), and the bottom twocharts are a 30-minute bar chart and a 30minute Market Profile Chart.The chart on the bottom right of Figure 5is the Market Profile Chart of the NYMEXCrude Oil traded on Globex. Developed by J.Peter Steidlmayer, the default version of theTick, Line and Market Profile for Globex Crude Oil. The tick chart shows (top left) every print and the line chart (top right)shows the 1-minute closing price. The bottom left chart is a 30-minute chart and the bottom right chart is Market Profile.3
Market Profile chart details price action ona 30-minute basis. The Profile chart breaksdown trades by price and creates a distribution curve. Figure 6 shows two views of CQGSynthetic Spread Bar Charts. Most chartingapplications only display spread charts asline charts. CQG will build bar or candlestickcharts based on intervals, such as 30-minute bars based on 1-minute values.Figure 6Today’s 24-hourCQG Synthetic Spread charts. The spread bars are the open-high-low-close of the spread price. The left-hand chart is the 15-minutecandlestick chart of the CLEH7-CLEJ7 spread price. The right-hand chart is the bar chart version of the same spread with Bollinger Bands.markets presentFigure 7unique problemsfor traders usingtechnical analysis and studies.Analog or Overlay ChartsCQG’s analog chart (Figure 7) offers the ability to make comparisons among differentmarkets. Multiple markets can be placedon one chart for comparison of price action.The right hand and left hand scales can beused to compare markets’ prices. The analog chart can be used with the Percent Barchart display so individual markets can becompared on a percentage basis.Figure 8CQG Chart Solutions to 24-HourMarkets: Today’s 24-hour markets presentunique problems for traders using technical analysis and studies. There are periodswhen low activity creates gaps in the pricecharts, and volume drops down to zero forextended periods. This can lead to chartsdisplaying empty spaces and studies toexhibit unusual readings. The next seriesof charts details CQG’s innovative chartingstyles that deal with these problems in the24-hour markets.Crude Oil Constant Volume Bar Chart (CVB). The left-hand is a 15-minute chart of the Globex crude oil contract and the actualvolume. The chart shows periods of high trading activity with high volume and periods of low to zero activity with low to zerovolume. The chart on the right is the CVB set to 5,000 contract per bar. The CVB chart is a smoother reflection of activity.The Analog Chart. Multiple markets can be overlaid on the same chart. The blue daily bars is Globex crude oil. The white lineis a close only chart of Globex heating oil. The light green line is a close only chart of Globex RBOB Gasoline. In addition, therelative strength study (RSI) is applied to each market and color-coded to match the coloring of the prices.4
Figure 8 compares a standard bar chartand the CQG Constant Volume Chart (CVB).The CVB chart does not use time. The algorithm plots a chart when a defined numberof ticks or actual contracts trade. Figure 8uses a setting of 5,000 contracts. A newbar is plotted once the current bar’s totalactual volume exceeds 5,000 contracts.Time is not a factor.Figure 9The two charts cover approximately thesame period. Notice how the CVB displaysa more orderly trend. The standard bar chartshows extended sideways action and lowvolume readings during the night sessions.The CVB chart compresses these low volume periods into one bar.Figure 9 compares the basic intraday barchart with Fill Gap, No Gap, and EqualizeSession Bar charts. The three charts are different approaches to the low activity overnight sessions.Figure 10 displays one-minute charts ofcrude oil, heating oil, and gasoline tradedon Globex. In addition, technical studies areadded to the charts. CQG comes with over90 basic and custom studies to aid the technically oriented trader.Basic Bar, Fill Gap, No Gap, and Equalize Session Bars. Each chart is the 15-minute bar chart of the heating oil contract tradedon Globex. The chart on the top left-hand side is the 15-minute bar chart. There are periods where the chart has noticeablegaps due to no trading activity. The chart on the top right-hand side is the Fill gap chart with the last price filling the gaps. Thebottom left-hand chart is a No Gap chart. The gaps are removed and time is compressed. The bottom right-hand chart usesthe Equalize Sessions format. In this case, all opening and closing prices are back adjusted to remove gaps.Figure 10SummaryCQG’s charting ranges from the innovativeTradeFlow to the classic bar chart. Here, wehave offered a simple overview of the various displays available. And, because virtually any element of the chart can be customized, traders can match their chart displaysto their trading style.Trading and investment carry a high level of risk,and CQG, Inc. does not make any recommendationsfor buying or selling any financial instruments. Weoffer educational information on ways to use oursophisticated CQG trading tools, but it is up to ourcustomers and other readers to make their owntrading and investment decisions, or to consultwith a registered investment advisor.Learn more at Thom Hartle’s Blog:www.hartleandflow.comGlobex traded Crude Oil and Products. Here, one-minute charts with studies are presented. Studies can be modified byright-clicking on the study. Plot studies in individual panes or on the price bars.5
Contact us:Web: www.cqg.com Email: websales@cqg.com Or call your CQG sales representive.US 1 800-525-7082Japan 81 (0) 3-3286-6633UK 44 (0) 20-7827-9500Russia 7 495-795-2410France 33 (0) 1-74-81-07-81Germany 49 (0) 69-920-7920Singapore 65 6720-3165Australia 61 (2) 9235-2009 2007 CQG, Inc. All rights reserved worldwide. 09/086
The chart on the bottom right of Figure 5 is the Market Profi le Chart of the NYMEX Crude Oil traded on Globex. Developed by J. Peter Steidlmayer, the default version of the Figure 4 Figure 5 Bar, Candlestick, Point & Figure, and Line Charts. The energy contrac