Transcription
Beginner’s Guide to VIIRSImagery DataCurtis SeamanCIRA/Colorado State University10/29/20131
VIIRS Intro VIIRS: Visible Infrared ImagingRadiometer Suite 5 High resolution Imagery channels(I-bands) 16 Moderate resolution channels(M-bands) Day/Night Band (DNB)VIIRS first launched onboardSuomi-NPP on 28 October 2011Suomi-NPP is in the same orbitalplane as the A-Train (CloudSat,CALIPSO, Terra MODIS), but athigher altitude: sun synchronousat 824 km with 13:30 LTequator crossing.2
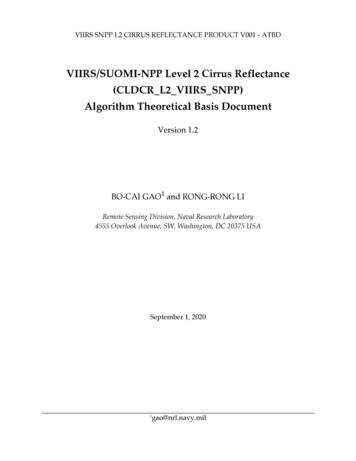
VIIRS ChannelsFrom Lee et al. (2006), BAMS3
VIIRS Data Basics VIIRS is a scanning radiometer– As the satellite orbits the Earth, VIIRS scans a swath that is 3040 km wide (thecross-track direction). Wide enough to prevent data gaps near the Equator (c.f. MODIS)– A rotating mirror reflects radiation onto a set of CCD detectors. One rotationof the mirror is one scan. M-bands and the DNB have 16 detectors to detect this radiation (16 rows of pixels perscan) I-bands have 32 detectors (32 rows of pixels per scan), with twice the resolution of theM-bands and the DNB Each scan produces a strip of data 3040 x 12 km in size– 48 scans comprise one “granule” of data. One granule represents 85 secondsof data collected ( 570 km in the along-track direction)– As a result, each granule covers an area 3040 x 570 km in size Data is distributed as individual granules*– There has been some discussion about combining data from several granulesinto a single file, but these files would likely be prohibitively large for mostusers** NOAA CLASS does distribute multiple granules combined into a single file and these filesare huge. Other known data sources (see slide 31) keep each granule in separate files.4
VIIRS Data Basics Raw data from the satellite is transmitted to Earth as “RDR” files(Raw Data Records). Most users should never come across thesefiles. RDR files are processed (the data is calibrated) and converted to“SDR” files (Sensor Data Records). For most users, these are the“raw” data files.– It is during this step that the geolocation information is calculated andwritten to a file– Data is also converted from raw counts to radiance, reflectance and/orbrightness temperature A limited number of SDR files are processed and mapped to a“ground-track Mercator” projection and, thus, converted to “EDR”files (Environmental Data Records).5
VIIRS Data Basics For each VIIRS granule there are 42 imagery filescurrently produced (SDRs EDRs):–––––8 geolocation files (5 SDRs and 3 EDRs)10 I-band data files (5 SDRs and 5 EDRs)22 M-band data files (16 SDRs and 6 EDRs)1 DNB data file (SDR)1 DNB EDR product, called “NCC” (Near-ConstantContrast) Each VIIRS file is stored in HDF-5 format These 42 files total 2 GB of data (see slide 26)6
VIIRS File Naming ConventionSVM01 npp d20130117 t2059265 e2100506 b06349 c20130118032130407525 noaa ops.h5A BCDEFGHA: file type (in this case, channel M-01 SDR data file)B: satellite identifier (Suomi-NPP)C: date in YYYYMMDD (17 January 2013)D: UTC time at the start of the granule in HHMMSS.S(20:59:26.5 UTC)E: UTC time at the end of the granule in HHMMSS.S(21:00:50.6 UTC)F: orbit number (06349)G: date and time the file was created in YYYYMMDDHHMMSS.SSSSSS (03:21:30.407525 UTC, 18 January 2013)H: source of the data file (operational file produced byNOAA)7
VIIRS File TypesSDRsEDRs Geolocation files: Geolocation files:– GITCO, GMTCO, GIMGO, GMODO,GDNBO I-band Data files:– SVI01, SVI02, SVI03, SVI04, SVI05 M-band Data files:– SVM01, SVM02, SVM03, SVM04,SVM05, SVM06, SVM07, SVM08,SVM09, SVM10, SVM11, SVM12,SVM13, SVM14, SVM15, SVM16 DNB Data file:– SVDNB– GIGTO, GMGTO, GNCCO I-band Data files:– VI1BO, VI2BO, VI3BO, VI4BO,VI5BO M-band Data files:– VM01O, VM02O, VM03O, VM04O,VM05O, VM06O (see slide 22) NCC Data file:– VNCCO8
Geolocation Files I-band SDR geolocation files– GIMGO: projected onto smooth ellipsoid (WGS84 ellipsoid)– GITCO: parallax-corrected for terrain M-band SDR geolocation files– GMODO: projected onto smooth ellipsoid– GMTCO: parallax-corrected for terrain Day/Night Band geolocation file– GDNBO: projected onto smooth ellipsoid (as of May 2013 there is adiscussion of whether or not to produce a terrain-correctedgeolocation) EDR geolocation files (use ground-track Mercator projection)– GIGTO: I-band EDR geolocation– GMGTO: M-band EDR geolocation– GNCCO: Day/Night Band EDR (NCC) geolocation9
Geolocation Files Geolocation files contain, for each face elevation relative to mean sea level (“Height”)Satellite Zenith AngleSatellite Azimuth AngleSolar Zenith AngleSolar Azimuth AngleDistance to satellite (“Satellite Range”) EDR geolocation files add the row and column number of the SDR pixelthat was mapped to the given EDR pixel row and column DNB and NCC geolocation files add lunar zenith and lunar azimuth angles10
SDR Data Files All data files contain radiance values– Visible and Near-IR channels also contain reflectance values– SW- and LW-IR channels contain brightness temperature– One file per channel 5 I-bands:– SVI01, SVI02, SVI03, SVI04, SVI05 16 M-bands:– SVM01, SVM02, SVM03, SVM04, SVM05, SVM06, SVM07,SVM08, SVM09, SVM10, SVM11, SVM12, SVM13, SVM14,SVM15, SVM16 Day/Night Band (radiance only)– SVDNB11
SDRs and the “Bow-tie Effect” The constant angular resolution of thedetectors results in an increasing pixel“footprint” size projected onto the Earth as thescan is further from nadir (see schematics onright)This means that the actual area of each scanhas the shape of a bow-tie (see figure below)– Consecutive scans overlap away from nadir The “bow-tie effect” is reduced duringprocessing from RDR to SDR through acombination of aggregation and deletion ofoverlapping pixels– The red pixels below are deleted from each scan inthe data arrays (given “pixel-trim” fill value)– DNB files do not have “pixel-trim” fill due to uniqueprocessing that keeps pixel resolution nearlyconstant across the swathScan angle12
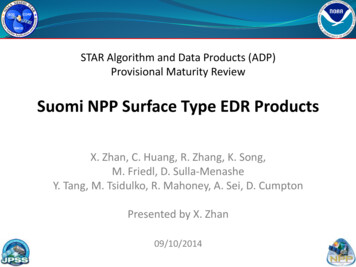
SDR ExampleSVM01 npp d20130117 t2059265 e2100506 b06349 c20130118032130407525 noaa ops.h5Data plotted with no mapping,and with “pixel-trim” fill valueshighlighted as blue. Full granuleplotted above. At right, zoomedin on area in lower right wherepixel trim begins. Pixel-trim fillvalues are only present in thedata arrays, not in thegeolocation arrays.13
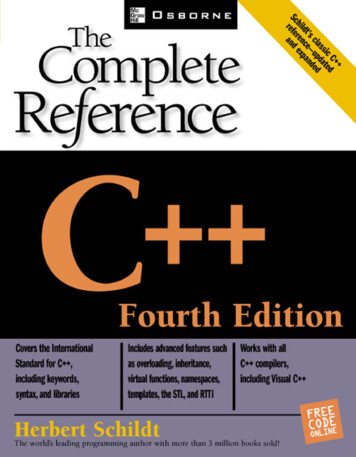
SDR Example with RemappingSVM01 npp d20130117 t2059265 e2100506 b06349 c20130118032130407525 noaa ops.h5Same granule as previous slide with data plotted to “Lambert Azimuthal” projection usingIDL, and with “pixel-trim” fill values removed. Proper mapping and accounting for “pixeltrim” values eliminates “bow-tie deletion” lines and produces the correct image.The removal of the deleted lines typically involves some form of averaging or duplication ofneighboring pixels to replace the fill values, although this is dependent on the softwareused to plot the data and/or the method the user feels produces the best results.14
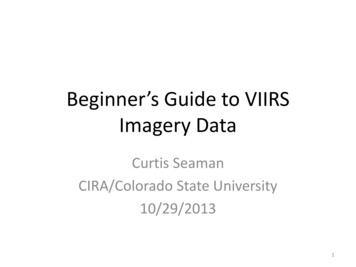
Bow-tie Effect in Non-Pixel-Trim AreasThese two images are of the same hurricane eye, which occurred slightly off-nadir in the granule, butbefore the “pixel-trim” region. On the left, the data is presented exactly as it appears in the file (nomapping). Lines appear where pixels from two adjacent scans overlap (indicated by the arrows). On theright, the data has been mapped onto a projection of the Earth using the geolocation information. Thelines disappear. The geolocation correctly accounts for the overlap. This is a plotting issue, and not aproblem with the satellite or the data.Aside: the eye appears more circular in the mapped image, which is indicative of the fact that thehorizontal resolution of the data is not identical in the cross-track and along-track directions (see slide 3).The geolocation accounts for this also.15
EDRs and Ground-Track Mercator Mapping Imagery EDR files remove the pixel-trim lines and bow-tie effectproblem by mapping the data to the Ground-Track Mercator (GTM)projection– A Mercator projection relative to the satellite During EDR processing, SDR data is mapped to the GTM projection,which maintains constant horizontal resolution in the cross-trackand along-track directions Overlapping SDR pixels are mapped to their proper location in theEDR array The GTM projection also converts granules from their native shapeto something closer to a true rectangle 16
Rotation Between SDR and EDR It takes 0.56 seconds for theinstrument to scan the width of theswath. During this time, the nadir pointof the satellite moves 3.75 km (thesatellite moves at 6.7 km s-1)At the start of the scan, the satellite isat A, looking at the point A’ at the edgeof the swath (perpendicular to thesatellite motion). By the time themirror rotates to view B’, the satellitehas moved to B. The line connecting A’to B’ is not perpendicular to thesatellite motion.Satellite ground trackBB’Scan lineA’AThus, without the bow-tie effect, eachSDR granule is more of a parallelogramthan a rectangle17
Rotation Between SDR and EDRBAThis image is of an EDR file (no mapping):VM01O npp d20130117 t2059140 e2100590 b06349 c20130117225550954634 noaa ops.h5The brown parallelogram outlines where the associated SDR file matches up with it:SVM01 npp d20130117 t2059265 e2100506 b06349 c20130118032130407525 noaa ops.h5The data in the lower-left corner of the EDR (A) comes from the previous SDR granule.The data in the upper-right corner of the EDR (B) comes from the next SDR granule.Notice also that the beginning and ending times given in the EDR filename do notmatch with the times of the SDR filename. This is a reflection of the fact that datafrom the previous and next SDR granules were mapped to this EDR granule.18
EDRs and “N/A Fill” The GTM projection maintains a constant size with constant horizontal resolution in the cross-trackand along-track directions. The physical area represented by each EDR granule is constant. However, the satellite orbit is not a circle, the Earth is not a sphere and the satellite does not travelat constant speed. This means the swath width is not constant and the 48 scans per granule do not cover the samealong-track distance. The data arrays and geolocation arrays are “maximized” - set to the maximum along-track andcross-track dimensions the granules may possess; designed to keep array sizes constant when thephysical area represented by each granule is not constant As a result, the data arrays and geolocation arrays contain “N/A” fill values at the swath edges andat the end of each granule where the data does not reach. The number pixels with “N/A” fill valuesvaries from granule to granule. Removal of the “N/A” fill lines at the end of each granule is required for consecutive granules toproperly match-up. (See next two slides.) There is no loss in resolution when this is done properly.19
EDR ExampleVI1BO npp d20120910 t1748321 e1750260 b04517 c20120911001107561283 noaa ops.h5Data plotted with no mapping,and with “N/A” fill valueshighlighted as red. Full granuleplotted above. At right, zoomedin on area in upper-left cornerwhere N/A fill is present. Thisparticular granule has 19 rows ofN/A fill value at the end of thearray, and a variable number ofN/A fill values in each row.multiple rows of N/A FILL valueat the end of the arrayVariable number of fillvalues in each row of pixelson both sides of swathGeolocation arrays have N/A fill only at the end of the array, not at swath edges.20
EDRs and “N/A” fill In general, the number of rows of N/A fill value at the end ofthe array increases as the satellite approaches either pole.This number is a minimum at the Equator. The opposite is true for fill values at the swath edges: thefewest N/A fill values per row occur at the poles, the mostoccur at the Equator.EquatorPoleExaggeration of the relative aspect ratios of the area of valid EDR data between the Equator and the poles.Pale blue rectangles represent the area of the EDR granule/GTM projection. Darker blue rectanglesrepresent area of valid data within the projection.21
EDR Data Files All I-band and M-band data files contain radiance values–– I-band SDRs each have their own EDR– VI1BO, VI2BO, VI3BO, VI4BO, VI5BO correspond to SVI01, SVI02, SVI03, SVI04, SVI05 SDRs, respectivelyOnly 6 M-band EDRs are currently produced and they do not correspond 1:1 with the SDR channels––––––– Visible and Near-IR channels also contain reflectance valuesSW- and LW-IR channels also contain brightness temperatureSVM01 (SDR) -- VM01O (EDR)SVM04 (SDR) -- VM02O (EDR)SVM09 (SDR) -- VM03O (EDR)SVM14 (SDR) -- VM04O (EDR)SVM15 (SDR) -- VM05O (EDR)SVM16 (SDR) -- VM06O (EDR)The M-band EDR processing is designed to be flexible so that the input channel may vary. The list above isaccurate as of August 2013. Users should locate the metadata item “band id” in the data file to determinewhich SDR channel was the input for the EDR.I-band and M-band EDRs are simply the SDR data remapped to the Ground-Track MercatorprojectionThe Day/Night Band EDR is called the Near-Constant Contrast (NCC) product––VNCCOThe NCC product is the DNB SDR data (which is radiance only) converted to a “reflectance” value andremapped to the ground-track Mercator projection. As a result, NCC data is reflectance-only.22
NCC Imagery EDR ExampleSVDNBNCCThe top image shows a DNB granule that crosses the day/night terminator. Thelower image shows the associated NCC granule (with N/A fill values highlightedin blue). Neither image has been mapped. The goal of the NCC EDR is to reducethe dynamic range of DNB radiance values (which span 7 orders of magnitudebetween day and night) by converting it to a quantity with reduced dynamicrange (i.e. reflectance) to create images with nearly constant contrast acrossscenes like this. Nighttime images of clouds should, in theory, appear similar todaytime images. This is a difficult problem, however 23
NCC Imagery EDR Recall that reflectance is a measure of the ratio between the observed (outgoing)radiation from a surface and the expected incoming radiation incident on thatsurface– reflectance is typically a value between 0 and 1Since the DNB operates day and night, there are two sources of expectedradiation: the sun and moon– Converting DNB radiance to NCC reflectance involves accurate modeling of both solarradiation and lunar radiation However, the DNB also detects radiation from other sources (lightning, auroras,city lights, fires, etc.) which can be several orders of magnitude brighter than thesolar and/or lunar radiation (particularly at night during a new moon) and theselight sources cannot be modeled– NCC reflectance values were originally allowed to vary between 0 and 5, but they mayapproach 100-1000 or more in cases of auroras, city lights and fires, for example– As a result, NCC processing typically produced large areas of “SOUB” fill values indicatingvalues out-of-bounds for nighttime granules when the moon was significantly less than full– A fix for this issue is now operational so that NCC imagery is valid during all phases of themoon as it is supposed to be (fix implemented on 10 July 2013)24
Other VIIRS Channels at Night Except for the Day/Night Band, visible andnear-IR channels do not produce data at night These channels where reflectance iscomputed are not available at night (refer toslides 11 and 22) Data arrays are filled with “VDNE Fill” or “N/AFill” These files have very small file sizes25
VIIRS File Sizes The values at the rightapproximately represent thesize of each file for onegranule All 42 files for one granulecomprise nearly 2 GB of data!– 1012 granules produced perday Differences in file sizesbetween channels are relatedto how the data is storedFile TypeGIMGOGITCOGMODOGMTCOGDNBOSVI (01, 02, 03)SVI04SVI05SVM (01, 02)SVM (03, 04, 05)SVM06SVM07SVM (08, 10, 11)SVM09SVM12SVM13SVM (14, 15, 16)SVDNBFile Size (approximate)309 MB210-250 MB77 MB50-60 MB85 MB40 KB (night) 25-30 MB (day)20-25 MB25-30 MB40 KB (night) 7-8 MB (day)40 KB (night) 11 MB (day)40 KB (night) 6-7 MB (day)5 MB (night) 11 MB (day)660 KB (night) 6-8 MB (day)40 KB (night) 2-5 MB (day)4-8 MB11-12 MB6-7 MB10-11 MBGIGTOGMGTOGNCCOVI (1, 2, 3) BOVI (4, 5) BOVM (01, 02, 03) OVM (04, 05, 06) OVNCCO423 MB106 MB136 MB26 KB (night) 60 MB (day)60 MB24 KB (night) 12 MB (day)12 MB9 MB26
VIIRS Data Storage Data values (radiance, reflectance andbrightness temperature) may be stored as16-bit unsigned integers or 32-bit floatingpoint values16-bit unsigned integer values areaccompanied by the scale factors needed toconvert the value to the proper units–For example, to read in correct radiancevalues stored as integers, one must read inthe “radiance” data array and the“radiancefactors” data vector–The scale factors are always 2 element vectorsof 32-bit floating point values [c0, c1] suchthat the true scientific value is given byf c0 n c1– f is the desired (floating point) value and n isthe input (unsigned integer) value Most geolocation data is stored as 32-bitfloating point values Array sizes below are valid for both the datafiles and associated geolocation filesFile TypeI-band SDRM-band SDRDNBArray Sizes6400 x 15363200 x 7684064 x 768I-band EDRM-band EDRNCC8241 x 15314121 x 7714121 x 77132-bit floating point values are alreadystored in the proper units27
VIIRS Data Units Radiance (except DNB) has units of (W m-2 sr-1 µm-1) DNB radiance is band-integrated and has units of (W cm-2sr-1) Reflectance is unitless Brightness temperature has units of (K) Latitude, longitude, and viewing geometry angles arealways reported in degrees Surface elevation (height) has units of (m MSL) Distance to satellite (satellite range) has units of (m) Times are given either in HHMMSS format (characterstring) or as the number of microseconds since 00:00:00UTC, 1 January 1958 (64-bit integer)28
VIIRS Fill ValuesName and meaning “N/A” – not applicable“MISS” – required value missing attime of processing“OBPT” – onboard pixel trim(overlapping/bow-tie pixel removedduring SDR processing)“OGPT” – on-ground pixel trim(overlapping/bow-tie pixel removedduring EDR processing)“ERR” – error occurred duringprocessing / non-convergence“ELINT” – ellipsoid intersect failed /instrument line-of-sight does notintersect the Earth’s surface“VDNE” – value does not exist /processing algorithm did not execute“SOUB” – scaled out-of-bounds /solution not within allowed range16-bit unsignedinteger arrays32-bit floatingpoint arrays 6553565534 -999.9-999.8 65533 -999.7 65532 -999.6 6553165530 -999.5-999.4 65529 -999.3 65528 -999.229
Pixel-trim (“OBPT”) Fill Values This table and the figurebelow identify thelocation of “OBPT” fillvalues in SDR imageryfilesAlso called “bow-tiedeletions” Double the number ofelements and linesmissing for I-band SDRs OBPT fill does not applyto DNB files or imageryEDRsSequentiallines missing(M-bands)Lines missingout of 16lines/scan(M-bands)Elements (Mbands)Number ofelements (Mbands)Scan angleZenith -32006403681184(2x592)36864056 -44.7 69.4 -52.6 44.7 -32 52.6 -36.7 32 -0 -32 36.7 -0 -36.7 32 -44.7 36.7 -52.6 44.7 -56 52.6 -69.4 Scan angle30
Where to get VIIRS data NOAA CLASS website– http://www.class.ncdc.noaa.gov/ NOAA GRAVITE server– gravite.ipo.noaa.gov Atmosphere PEATE server (SDR files only):– ftp://peate.ssec.wisc.edu/allData/ingest/viirs/– http://peate.ssec.wisc.edu University of Wisconsin Direct Broadcast (SDRfiles over CONUS within the last week only)– ftp://ftp.ssec.wisc.edu/pub/eosdb/npp/viirs/31
Software for Displaying VIIRS DataThis information does not constitute an endorsement of any productor service McIDAS-V– http://www.ssec.wisc.edu/mcidas/software/v/ IDL– http://www.exelisvis.com/ProductsServices/IDL.aspx TeraScan– http://www.seaspace.com/software.php MATLAB– http://www.mathworks.com/products/matlab/ CSPP– http://cimss.ssec.wisc.edu/cspp/32
For Further Reading Documentation– Algorithm Theoretical Basis Document (ATBD), Operational Algorithm Description (OAD), andCommon Data Format Control Book (CDFCB) documents may be found mlhttp://www.star.nesdis.noaa.gov/jpss/ATBD.php Presentations/Discussions of known issues– VIIRS Imagery and Visualization Team pp/ Imagery Examples– ss.com/tag/viirs/– “Realtime” line/npp viirs.asphttp://www.nrlmry.navy.mil/VIIRS.html33
C: date in YYYYMMDD (17 January 2013) D: UTC time at the start of the granule in HHMMSS.S (20:59:26.5 UTC) E: UTC time at the end of the granule in HHMMSS.S (21:00:50.6 UTC) F: orbit number (06349) G: date and time the file was created in YYYYMMDD