Transcription
VIIRS SNPP L2 CIRRUS REFLECTANCE PRODUCT V001 - ATBDVIIRS/SUOMI-NPP Level 2 Cirrus Reflectance(CLDCR L2 VIIRS SNPP)Algorithm Theoretical Basis DocumentVersion 1.2BO-CAI GAO1 and RONG-RONG LIRemote Sensing Division, Naval Research Laboratory4555 Overlook Avenue, SW, Washington, DC 20375 USASeptember 1, 20201gao@nrl.navy.mil
VIIRS SNPP L2 CIRRUS REFLECTANCE PROPDUCT V001 - ry/20201.1August/20201.2September/2020Change recordAuthor/changed byBo-Cai Gao(NRL/DC)Bo-Cai Gao(NRL/DC)Bo-Cai Gao(NRL/DC)Bo-Cai Gao(NRL/DC)2RemarksInitial draftChange formatProduct name changeChange descriptions onquality assurance (QA)
VIIRS SNPP L2 CIRRUS REFLECTANCE PROPDUCT V001 - ATBDTABLE OF CONTENTSREVISIONS .2SUMMARY .41 INTRODUCTION .52 OVERVIEW AND BACKGROUND INFORMATION.52.1 Experimental Objective .52.2 Historical Perspective .62.2.1 The discovery of the 1.38-µm cirrus detecting channel .62.2.2 The selection of MODIS Channel 26 (1.38 µm) .82.3 The VIIRS instrument and the M9 cirrus detecting channel .82.4 Previous experiences in developing cirrus reflectance algorithms .123 ALGORITHM DESCRIPTION .163.1 Theoretical Description .163.1.1 Physics of the problem .163.1.2 Mathematical description of the algorithm .183.1.3 A summary on the empirical cirrus correction procedures .213.1.4 Algorithm implementations .223.1.5 Quality assurance (QA) .263.1.6 Descriptions of input and output data.283.1.7 Variance and uncertainty estimates .293.2 Practical Considerations .303.2.1 Numerical computation considerations .303.2.2 Programming/procedural considerations .304 SAMPLE RESULTS .305. REFERENCES .323
VIIRS SNPP L2 CIRRUS REFLECTANCE PROPDUCT V001 - ATBDSUMMARYThis algorithm theoretical basis document (ATBD) describes an algorithm forretrieving a cloud (CLD) product, namely the cirrus reflectance (CR) level 2 dataproduct from radiances acquired with the VIIRS (Visible Infrared Imaging RadiometerSuite) instrument on board the Suomi NPP (National Polar-orbiting Partnership)satellite. Hereafter, the product name is abbreviated as 'CLDCR L2 VIIRS SNPP'.VIIRS contains 11 narrow channels (M1 – M11) in the 0.4 – 2.5 µm solar spectralregion, in addition to a number of IR emission channels. The M9 channel is specificallydesigned for detecting thin cirrus clouds. It is centered at 1.378 µm with a width of 15nm, which is located within a strong atmospheric water vapor band absorption region.In comparison with the corresponding MODIS Channel 26, the VIIRS M9 channel isnarrower and significantly more sensitive for cirrus detections. Because the radiances ofthe M9 channel over cirrus pixels are subjected to absorption by atmospheric watervapor molecules above and within cirrus, the water vapor absorption effect needs to beproperly taken into consideration when using the M9 channel for quantitative removalof cirrus effects in other VIIRS channels in the 0.4 – 2.5 µm spectral range. In this ATBD,we describe empirical techniques for the retrieval of cirrus reflectances in the visibleand NIR (0.4 – 1.0 µm), where ice particles within cirrus have negligible absorptioneffects, and shortwave IR (SWIR) (1.0 – 2.5 µm) where ice particle absorption effects areobviously observed. The descriptions include all elements leading to the developmentof the operational VIIRS L2 cirrus reflectance algorithm, journal literature backing upthe approach, theoretical descriptions on algorithm’s physics and mathematicalbackground, and sample retrieval results from VIIRS data.4
VIIRS SNPP L2 CIRRUS REFLECTANCE PROPDUCT V001 - ATBD1 INTRODUCTIONThis algorithm theoretical basis document (ATBD) describes an algorithm forretrieving a cloud (CLD) product, namely the cirrus reflectance (CR) level 2 dataproduct from radiances acquired with the VIIRS instrument on board the Suomi NPP(National Polar-orbiting Partnership) satellite. Hereafter, the product name isabbreviated as 'CLDCR L2 VIIRS SNPP'.VIIRS contains 11 narrow channels (M1 – M11) in the 0.4 – 2.5 µm solar spectralregion, in addition to a number of IR emission channels. The M9 channel is specificallydesigned for detecting thin cirrus clouds. It is centered at 1.378 µm with a width of 15nm, which is located within a strong atmospheric water vapor band absorption region.In comparison with the corresponding MODIS Channel 26, the VIIRS M9 channel isnarrower and significantly more sensitive for cirrus detections. Because the radiances ofthe M9 channel over cirrus pixels are subjected to absorption by atmospheric watervapor molecules above and within cirrus, the water vapor absorption effect needs to beproperly taken into consideration when using the M9 channel for quantitative removalof cirrus effects in other VIIRS channels in the 0.4 – 2.5 µm spectral range.In this ATBD, we describe empirical techniques for the retrieval of cirrusreflectances in the visible and NIR (0.4 – 1.0 µm), where ice particles within cirrus havenegligible absorption effects, and shortwave IR (SWIR) (1.0 – 2.5 µm) where ice particleabsorption effects are obviously observed. The descriptions include all elements leadingto the development of the operational VIIRS L2 cirrus reflectance algorithm, journalliterature backing up the approach, theoretical descriptions on algorithm’s physics andmathematical background, and sample retrieval results from VIIRS data.2 OVERVIEW AND BACKGROUND INFORMATIONThe objectives of this algorithm, the historical perspective on the discovery of the1.38-micorn channel for remote sensing of cirrus clouds and for the development ofcirrus reflectance algorithms, and the special characteristics of the VIIRS M9 cirruschannel, are described in this section.2.1 Experimental ObjectiveThe purpose of this algorithm is to derive cirrus reflectances in the visible & NIR,and SWIR spectral regions over the globe. The data products can, in principle, be usedfor improved retrievals of land surface reflectances, water leaving reflectances, and5
VIIRS SNPP L2 CIRRUS REFLECTANCE PROPDUCT V001 - ATBDatmospheric aerosol data products, including optical depths and particle sizedistributions.2.2 Historical Perspective2.2.1 The discovery of the 1.38-µm cirrus detecting channelHistorically, the discovery of the 1.38-µm channel for remote sensing of cirrusclouds didn’t come from the traditional atmospheric sciences research community. Asearly as mid-1960s, researchers already made spectral measurements in the 1.0 – 3.0 µmrange above cirrus clouds from aircraft platforms (Blau et al., 1966). These researchersas well as many researchers in the atmospheric sciences community later on wereunable to realize the utility of 1.38-µm channels for cirrus detections until thehyperspectral imaging spectrometer data acquired from a high altitude aircraft abovecirrus clouds became available in 1990.The break through came up in early 1990s (Gao et al., 1993) with the analysis ofhyperspectral imaging data acquired over cirrus clouds by the NASA JPL AVIRIS(Airborne Visible Infrared Imaging Spectrometer) instrument (Vane et al., 1993; Greenet al., 1998) from an ER-2 aircraft at an altitude of 20 km. The first set of AVIRIS cirrusdata was acquired over Rocky Mountains in March of 1990. Around December of 1990,we were able to view the 3-dimensional AVIRIS data (2D spatial and 1-D spectral) seton the newly available Dec 3100 workstation. Specifically, we were able to displaydifferent band images sequentially on computer screens. We observed that, cirrusclouds showed up very nicely in images of AVIRIS narrow channels (10 nm wide)located within the strong 1.38-µm water vapor band absorption region and land surfacefeatures, such as roads, disappeared in the images. We also observed that, in images ofatmospheric ‘window’ channels centered near 1.24 and 1.5 µm, cirrus cloud featureswere hardly seen while land surface features were seen obviously. After several days ofthinking, we figured out the mechanism for the observation of cirrus and thedisappearance of surface features in the 1.38-µm channel images. Because cirrus cloudswere high in the atmosphere ( 10 km above the sea level or higher), the 1.38-µm solarradiation on the downward sun-surface path was scattered by cirrus and the scatteredradiance was then detected by the AVIRIS sensor. The 1.38-µm solar radiationtransmitted through cirrus in the downward path was absorbed by water vaporbeneath cirrus. As a result, the 1.38-µm channel detected thin cirrus over a nearly ‘black’background.Based on our fresh observation from AVIRIS data and with strong encouragementfrom NASA scientists and managers, we proposed to fly AVIRIS during the NASAsponsored FIRE Phase II field experiment conducted over the Gulf of Mexico andKansas & Oklahoma areas in November and December of 1991. Although NASA HQsmanagers scheduled two weeks for flying AVIRIS during the 2nd half of the FIRE PhaseII experiment, AVIRIS was placed onto ER-2 only for the last three days of the6
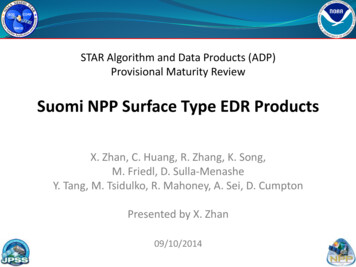
VIIRS SNPP L2 CIRRUS REFLECTANCE PROPDUCT V001 - ATBDexperiment, and collected data on December 5 and 7. At the time, some members withinthe FIRE II science team viewed AVIRIS as a ‘geological’ instrument (due to the fact thatAVIRIS was originated from the geology community for mineral mapping purposes,not from the atmospheric community). They insisted on flying their familiarradiometers on ER-2, and left little time for AVIRIS’s flights. Nevertheless, AVIRIScollected excellent data sets during the two available flights.Figure 1 shows examples of AVIRIS images acquired over the Gulf of Mexicomeasured on December 5, 1991. In the 0.56- and 1.50-µm atmospheric ‘window’ channelimages, both the upper level cirrus clouds and the lower level brighter and isolatedcumulus clouds are seen. In the 1.38-µm channel image, only the upper level cirrusclouds are seen. The lower level cumulus clouds disappeared completely because ofstrong water vapor absorption of solar radiation transmitted through cirrus in thedownward sun-surface path. In the 1.35-micorn channel image, weak cumulus cloudfeatures were seen. This is because the atmospheric water vapor absorption effect wasnot sufficiently strong at this wavelength to result in total absorption of solar radiationbeneath cirrus clouds.Fig. 1. Examples of AVIRIS images for 10-nm wide channels centered at 0.56, 1.35, 1.38,and 1.50 µm. The images were acquired on December 5, 1992 during the NASASponsored FIRE Phase II field experiment over the Gulf of Mexico. The image coversan area of approximately 12 by 10 km2.2.2.2 The selection of MODIS Channel 26 (1.38 µm)During the NASA MODIS Science Team meeting held in December of 1992, we7
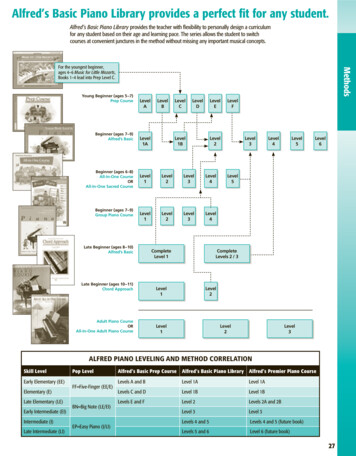
VIIRS SNPP L2 CIRRUS REFLECTANCE PROPDUCT V001 - ATBDpresented AVIRIS cirrus images. The MODIS Science Team endorsed our idea ofputting a narrow channel centered near 1.38 µm (Gao et al., 1995) on MODIS for remotesensing of cirrus clouds. Figure 2 illustrates the position and width of our proposedMODIS cirrus detecting channel, which is centered at 1.375 µm with a width of 30 nm.With strong support from MODIS scientists and management at NASA Goddard SpaceFlight Center, it was possible to implement this cirrus detecting channel (Band 26) ontoMODIS (Salomonson et al., 1989; King et al., 2003) during the very late stage of theMODIS instrument designing.Fig. 2. Illustration of position and width (in thick horizontal bar) of our proposedMODIS 1.38-µm channel for cirrus detections. The three spectral curves are watervapor transmittances for the sun-cloud-sensor ray paths with cloud altitudes at 10, 6,and 0 km (top to bottom) and for a solar zenith angle of 45 degrees, a nadir lookingsatellite sensor, and a model atmosphere with 2.1 cm of column water vapor amountfrom the sea level to space.2.3 The VIIRS Instrument and the M9 Cirrus Detecting ChannelThe VIIRS instrument is similar to the Moderate Resolution ImagingSpectroradiometer (MODIS) instruments (Salomonson et al., 1989; King et al., 2003)currently on board the NASA Terra and Aqua Spacecrafts. The VIIRS channel names,positions, and widths are listed in Table 1. Many VIIRS channels (designated as M1 toM16 in Table 1) have heritages to the MODIS instrument but with minor differences incenter positions and widths. Important differences between VIIRS and MODIS do exist.For examples, MODIS channels located in atmospheric gaseous absorption regions near4.5 µm, 6.7 µm, and above 13 µm are all absent in VIIRS. As a result, VIIRS has, ingeneral, less capability for remote sensing of atmospheric temperatures and clouds incomparison with MODIS.8
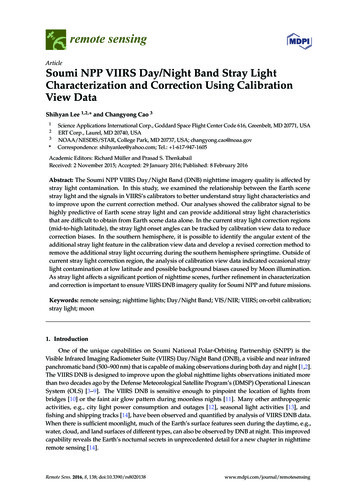
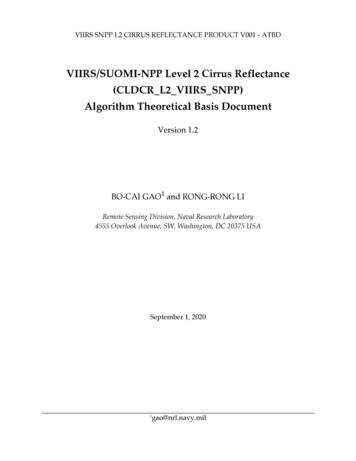
VIIRS SNPP L2 CIRRUS REFLECTANCE PROPDUCT V001 - ATBDFortunately, VIIRS has implemented the M9 channel centered at 1.378 µm with awidth of 15 nm for remote sensing of cirrus clouds from space. Fig. 3 illustrates thepositions and widths of the VIIRS M9 channel and MODIS channel 26. Because the M9channel is narrower and located in a stronger water vapor absorption region, M9 ismore sensitive for thin cirrus detections than MODIS channel 26. The M9 channeldetector sensitivity is approximately four times better than that of the correspondingMODIS channel 26 (based on the conversation with VIIRS engineers in the early 2000time frame). In order to use the M9 channel data for quantitative remote sensing ofcirrus clouds and for the correction of thin cirrus effects in other atmospheric windowchannels, the upper level water vapor absorption effect (as illustrated in Fig. 3) in theM9 channel data needs to be removed. Without accounting for the spatially variablewater vapor absorption effects, the VIIRS M9 channel data can only be usedqualitatively for cirrus detections, not quantitatively for correcting/removing of cirruseffects in other VIIRS channels.Table 1: VIIRS channel names, positions, and full widths at half maximum (FWHMs).VIIRS Channell (µm)FWHM 000.950Soon after the launch of the Suomi VIIRS instrument into space, we evaluated thequality of the M9 channel data. The left plot in Figure 4 shows a VIIRS RGB imageacquired over bright desert and dark ocean water areas. Sunglint patterns in the leftportion are obviously seen. The right plot in Fig. 4 shows the corresponding VIIRS M9channel image. Thin cirrus clouds over the bright desert and water surfaces are nicely9
VIIRS SNPP L2 CIRRUS REFLECTANCE PROPDUCT V001 - ATBDdetected, while the sunglint features are not seen at all. The Fig. 4 image demonstratedthe great capability of the VIIRS M9 channel for cirrus detections over water, land, aswell as the areas affected by sunglint.Fig. 3. Positions and widths of VIIRS M9 channel and MODIS channel 26.Fig. 4. An example of VIIRS images over desert and sunglint areas.Figure 5 illustrates our technique for estimating the noise level of VIIRS M9channel. The left portion shows a section of a VIIRS RGB image strongly affected bysunglint. The middle portion shows the same area of the scene, but for the M9 Channel.The filled ‘red square’ is an area free of cirrus clouds. We calculated the means andstandard deviations for VIIRS M1–M11 channels. The standard deviation for the M9channel in reflectance unit is 0.00016, which is much smaller than the ocean color10
VIIRS SNPP L2 CIRRUS REFLECTANCE PROPDUCT V001 - ATBDcommunity’s requirement of noise level at 0.001 (in reflectance unit). As a result, theM9 channel image is usable for the removal of thin cirrus scattering effects in otherVIIRS channels without introducing noticeable noises into cirrus-corrected images. Itshould be pointed out that, the horizontal stripes in the RGB image in Fig. 5 are mostlikely related to the so called ‘differential’ polarization sensitivities associated with 16detectors of one channel in the along track direction. To our understanding, thedifferential polarization issue has not been fully addressed by various VIIRS calibrationteams till present.Fig. 5. An illustration on signal to noise estimates for the VIIRS M9 channel.Due to the great successes in remote sensing of cirrus clouds with AVIRIS,MODIS, and VIIRS using 1.38-µm channels, scientists and engineers have implementedsimilar 1.38-µm channels with slight differences in center positions and widths onto anumber of other satellite instruments, including the DOE’s MTI (Multispectral ThermalImager), Japanese GLI (GLobal Imager), Landsat8 OLI (Operational Land Imager),GOES-R ABI (Advanced Baseline Imager), and European Sentinel 2 MSI (Multi SpectralInstrument). At present, the concept of using a narrow channel centered near 1.38 µmfor satellite remote sensing of cirrus clouds has gained worldwide acceptance.2.4 Previous experiences in developing cirrus reflectance algorithmsOver many years, we have demonstrated the capability of using 1.38-µm cirrusdetecting channels for cirrus corrections, and therefore for improved remote sensing of11
VIIRS SNPP L2 CIRRUS REFLECTANCE PROPDUCT V001 - ATBDland surfaces, ocean color, and atmospheric aerosols.Fig. 6 shows an example of cirrus detection and correction using a MODIS data setacquired over France and Atlantic Ocean. Fig. 6a is an RGB image of the scene. Theaircraft induced contrail cirrus clouds contaminate portions of the scene. Fig. 6b is the1.38-µm channel image of the same scene. The thin contrail cirrus clouds are obvious tosee in this image, but the land and ocean surface features are not seen at all, because thesolar radiation at this wavelength after transmitting through cirrus clouds in thedownward sun-surface path is absorbed by water vapor beneath the cirrus clouds. Fig.6c shows the cirrus-removed RGB image using the technique described by Gao et al.(2002a). By comparing Fig. 6c with Fig. 6a, it is seen that the land features and waterfeatures associated with a coccolithophore blooming event, are seen much better afterthe cirrus correction.Fig. 6 – An example of cirrus detection and correction over Atlantic Ocean and France.Another example of cirrus detection and correction is shown in Figure 7. A truecolor MODIS image (R: 0.645 µm; G: 0.55 µm; B: 0.47 µm) acquired over northeasternpart of Canada is shown in Fig. 7a. Land surface features, white cirrus clouds, and bluesmoke are seen. The1.38-µm channel image is shown in Fig. 7b. Only the upper levelcirrus clouds are seen in this image. Fig. 7c shows an example of correction of thincirrus effects for three MODIS visible channels using the retrieved cirrus reflectanceimage (Gao et al., 2002a). By comparing Fig. 7c with Fig. 7a, it is seen that the landsurface features and smoke are seen much better after the cirrus correction.Unfortunately, we were unable to convince MODIS aerosol scientists to remove thincirrus effects from MODIS images prior to making aerosol retrievals from MODISimages in the 0.4 – 2.5 solar spectral range. They only agreed for improved thin cirrusscreening using the MODIS Band 26 images (Gao et al., 2002b). At present, within theMODIS aerosol algorithm, pixels with the Band 26 apparent reflectance values greater12
VIIRS SNPP L2 CIRRUS REFLECTANCE PROPDUCT V001 - ATBDthan about 0.015 were screened out. The remaining pixels were assumed to be cirrusfree during MODIS aerosol retrievals. As a result, over certain situations, the thin cirrusinduced errors in the retrieved aerosol optical depths in the visible from MODIS datacan be 0.1 (even up to 0.2).Fig. 7. An example of cirrus detection and correction over North America. The cirruscorrected image in the right allows better observation of blue smoke and landsurface features.We have multi-year experience in developing cirrus reflectance algorithms. Forexample, we described a method for correcting thin cirrus path radiances in the 0.4 1.0 µm spectral region in AVIRIS data using the 1.375-µm cirrus detecting channel (Gaoet al., 1998). Figure 8 shows examples of cirrus detection and corrections with a narrowchannel located within the strong water vapor absorption region near 1.38 µm. Fig. 8a isan AVIRIS RGB image acquired over Bowie, Maryland in the summer of 1997. Surfacefeatures appear blurred because of the presence of thin cirrus clouds. Fig. 8b is the 1.38µm channel image of the same scene. Only the upper level thin cirrus clouds are seen.The surface features seen in Fig. 8a disappear completely in Fig. 8b because ofabsorption of water vapor beneath cirrus. Fig. 8c is the cirrus corrected RGB image. Thecorrections were made using the method described by Gao et al. (1998). By comparingFig. 8c with Fig. 8a, it is seen that the surface features are seen much better after theremoval of thin cirrus effects.13
VIIRS SNPP L2 CIRRUS REFLECTANCE PROPDUCT V001 - ATBDFig. 8. An AVIRIS RGB image acquired over Bowie, Maryland in the summer of 1997(a), the 1.38-µm image (b), and the cirrus-corrected RGB image (c).We developed operational MODIS cirrus reflectance algorithm. A paper on thissubject was published in 2002 (Gao et al., 2002a). The daily ‘pixel-based’ cirrusreflectance product, which is a standard MODIS Level 2 data product, at the 1-kmspatial resolution of the MODIS instrument, and the daily, 8-day, and monthly cirrusreflectance products, which are standard MODIS Level 3 products, at a 1 by 1 latitudelongitude grid globally are operationally produced at a NASA computing facility.Figure 9 shows a sample global MODIS L3 image for October, 2002. Large amounts ofcirrus clouds are observed in the tropical region as well as over the latitude beltbetween about 40 S and 60 S in the southern hemisphere. At present, more than 19years of Terra MODIS and nearly 17 years of Aqua MODIS Level 3 monthly-meancirrus reflectance data products have been generated. The cirrus reflectance data14
VIIRS SNPP L2 CIRRUS REFLECTANCE PROPDUCT V001 - ATBDproducts have been used in a variety of climate research and remote sensingapplications (e.g., Toth et al., 2013; Turk and Miller, 2005; Jin, 2006, Chen and Liu, 2005).Fig. 9. A sample global MODIS L3 image for Oct. 2002. Large amounts of cirrus clouds areobserved in the tropical region as well as over the latitude belts between about 30 S and60 S.Fig. 10. (A) - A Landsat 8 OLI RGB image acquired over Cape Breton Island in easternCanada (northeast to Halifax) on September 16, 2014, (B) - the corresponding Band9 (cirrus band) image, and (C) - the cirrus-corrected RGB imageMore recently, we developed a version of cirrus reflectance algorithm (Gao and Li,2017) suitable for processing Landsat 8 OLI (Operational Land Imager) data. In thisversion of the algorithm, techniques of retrieving cirrus reflectances for both the15
VIIRS SNPP L2 CIRRUS REFLECTANCE PROPDUCT V001 - ATBDvisible/NIR channels and SWIR channels (centered at 1.61 and 2.2 µm), where iceparticles within cirrus clouds have absorption effects, are described. Figure 10 shows anexample on cirrus detection and corrections with this algorithm. Fig. 10a shows aportion of an OLI true color RGB image. The data was acquired over Cape Breton Islandin eastern Canada (northeast of Halifax) on September 16, 2014. Thin cirrus clouds overboth land and water surfaces are seen. Fig. 10b shows the OLI Band 9 (1.38-µm) image,where only the upper level thin cirrus clouds are seen. The land and water surfacefeatures in Fig. 10a are not seen in Fig. 10b. This demonstrates clearly that the OLI Band9 is very effective for thin cirrus detection. Fig. 10c shows the resulting cirrus-correctedRGB image. By comparing Fig. 10c with Fig. 10a, it is seen that most cirrus features seenin Fig. 10a are not seen in Fig. 10c, which demonstrates the success of our technique forcirrus corrections of OLI visible bands.Because Landsat8 OLI has several bands, particularly SWIR bands centered near1.61 and 2.25 µm, that are very similar to those of the corresponding VIIRS bands, theprinciples for cirrus reflectance retrievals from Landsat8 OLI and that from VIIRS areabout the same. However, the detailed algorithm implementations are different, mainlyfor dealing with very different spatial coverages between a standard OLI scene ( 200km by 200 km) and a VIIRS scene ( 3000 km by 2000 km).3 Algorithm DescriptionThe proposed algorithm for retrieving the Level 2 cirrus reflectance data productsfrom VIIRS Level 1b calibrated radiance data is described from both theoretical andpractical point of view in this section.3.1 Theoretical Description3.1.1 Physics of the problemCirrus clouds generally consist of ice particles having different sizes and shapes.The "effective" particle sizes (radii of equivalent spheres) are usually greater than 5 µm.We illustrate the scattering and absorption properties of cirrus clouds through recenthyperspectral imaging data acquired with the AVIRIS-NG instrument from an ER-2aircraft at an altitude of 20 km. Figure 11 shows a sample AVIRIS-NG spectrum(apparent reflectances) acquired over an area covered by thick cirrus on March 21, 2017.The VIIRS M1 – M11 channel positions and widths are marked in short and thickhorizontal bars. In this thick cirrus spectrum, the atmospheric water vapor absorptionbands centered near 0.94, 1.14, 1.38, and 1.88 µm are seen. The narrower atmosphericoxygen bands centered near 0.69, 0.76, and 1.26 µm are also seen. In addition, a broadatmospheric ozone absorption band (Chapius band) centered near 0.60 µm. For the16
VIIRS SNPP L2 CIRRUS REFLECTANCE PROPDUCT V001 - ATBDcirrus spectrum, the reflectances of ice particles in the 0.4 - 1.0 µm spectral region arenearly constant with wavelength, because ice particles are much larger than thewavelength and non-absorbing in this spectral region. Past 1.0 µm one finds several iceabsorption bands, for example those centered near 1.5 and 2.0 µm. Both the M10(1.61 µm) and M11 (2.25) channels are affected by ice absorption effects. Because M11 iscentered near a local reflectance maximum, the overall ice absorption effect for the M11channel can be smaller than that of the M10 channel. Weak ice absorptions occur near1.24 µm (M8) and 1.375 µm (M9); the imaginary parts of the ice refractive index areabout the same at both wavelengths. The measured reflectances at 1.375 µm are smallerthan those in the 0.4 - 1.0 µm region mainly because of absorption by water vaporabove and within the cirrus clouds. These upper-level water vapor absorption effectsneed to be accounted for in order to use the VIIRS M9 channel for quantitative removalof cirrus effects in M1 - M8 channels. The use of the M9 channel for the removal of M10and M11 cirrus effects need to take into considerations of the M9 water vaporabsorption effects and the M10 and M11 ice absorption and scattering effects.Fig. 11. A thick cirrus apparent reflectance spectrum with VIIRS M1 – M11 channelsmarked in short and thick horizontal bars.At present, our knowledge of cirrus ice particle size, shape, and orientationdistributions, spatial variability, and scattering phase functions is not sufficient forreliable, routine modeling of cirrus reflectivity (Shiobara and Asano, 1994). Cirrusspatial inhomogeneity and adjacency effects (contamination of one pixel by photonsscattered from neighboring pixels) are poorly treated in radiative transfer models. Inview of these difficulties, we decided to use empirical relationships to characterize themain cirrus properties, and from these to develop an empirical cirrus removaltechnique.17
VIIRS SNPP L2 CIRRUS REFLECTANCE PROPDUCT V001 - ATBD3.1.2 Mathematical description of the algorithmCirrus clouds are typically located at the upper portion of the troposphere and thelower end of the tropopause. As far as atmospheric scattering effect is concerned, wecan assume that a homogeneous thin cirrus layer is located above a "virtual surface",which includes the effects of scattering by molecules, aerosols, and low clouds as wellas land or ocean surface reflection and sub-surface scattering. Omitting for conveniencethe wavelength (l) and cosine-solar-zenith-angle (µ0) dependencies, we denote the“apparent reflectance” at the satellite asr* (p L / µ0 E0),(1)where L is the radiance measured by the satellite and E0 is the
hyperspectral imaging data acquired over cirrus clouds by the NASA JPL AVIRIS (Airborne Visible Infrared Imaging Spectrometer) instrument (Vane et al., 1993; Green et al., 1998) from an ER-2 aircraft at an altitude of 20 km. The first set of AVIRIS cirrus data was acquired over Rocky Mountains in March of 1990. Around December of 1990,