Transcription
Short Call Management StudyThe short call option strategy is used by bearish traders with a high tolerancefor risk, as the strategy has unlimited loss potential (in theory).In this video, we’ll examine over 10 years of 16-delta short call managementdata from 41,600 trades in the S&P 500 (ETF).Which strategies were the most profitable?Which were the least profitable?How did implied volatility impact profitability?
Study MethodologyUnderlying: S&P 500 ETF (SPY)Time Frame: January 2007 to May 2017 (Most Recent Standard Expiration)Entry Dates: Every Trading DayExpiration Cycle: Standard Expiration Closest to 45 Days to Expiration(resulted in trades between 30-60 days to expiration)Trade: Sell the 16-Delta Call OptionNumber of Contracts: 1
16 Different Management CombinationsProfit or Expiration: 25% Profit, 50% Profit, 75% Profit or ExpirationProfit or -100% Loss: 25% Profit, 50% Profit, 75% Profit or -100% LossProfit or -200% Loss: 25% Profit, 50% Profit, 75% Profit or -200% LossProfit or -300% Loss: 25% Profit, 50% Profit, 75% Profit or -300% LossExample: 25% Profit or -100% LossEntry Credit: 1.00Profit Target: 0.25 ( 1.00 x 25%). Buy back call when it trades 0.75.Loss Limit: 1.00 ( 1.00 x 100%). Buy back call when it trades 2.00
Metrics We’ll AnalyzeWin Rates: The percentage of trades that were profitable.Win Rate – Breakeven Win Rate: The difference between the success rateand what the strategy required to break even (based on average profits andlosses).Average P/L: The average profitability of each trade.10th Percentile P/L: The P/L that 90% of trades exceeded (a probabilistic wayof analyzing the worst drawdowns).45-Day Adjusted P/L: Not all trades were held for the same amount of time.We standardized the average P/L of each trade to a 45-day period.
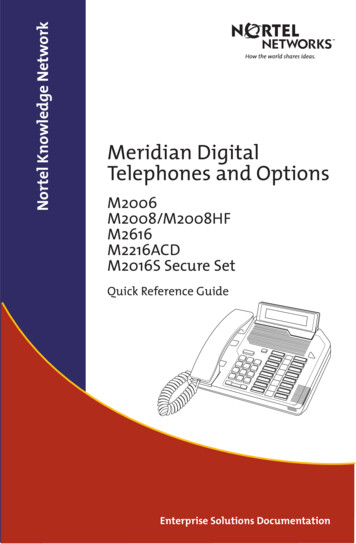
Win Rates
Win Rates: 16-Delta Short CallAs expected, closing profitable trades early boosted the success rate, whiletaking losses reduced the success rate.
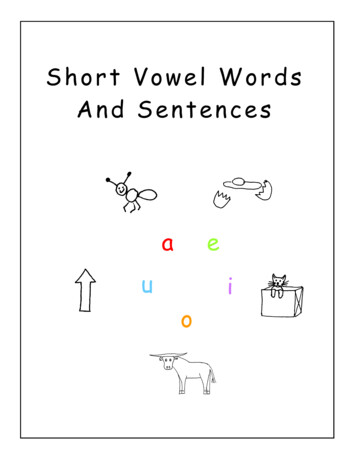
Win Rates - Breakeven Win Rates
Win Rate – Breakeven Win Rate: 16-Delta Short CallInterestingly, all strategies had a very slim margin between the success ratesand the win rates required to break even.
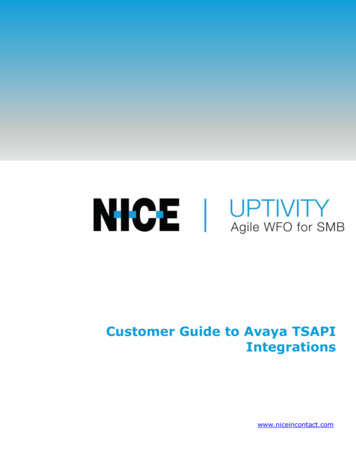
Average P/L Per Trade
Average P/L: 16-Delta Short CallAs the Win Rate – Breakeven Win Rate suggests, the earlier profit-takingapproaches had the lowest average profitability on a per-trade basis:
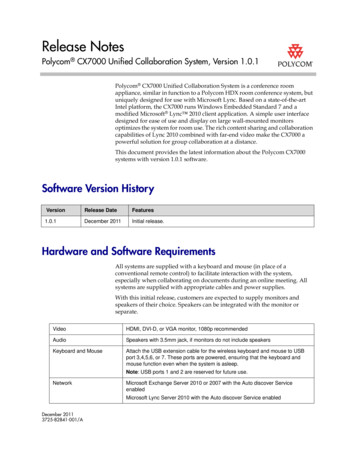
th10Percentile P/L
10th Percentile P/L: 16-Delta Short CallTaking losses reduced the worst-case drawdowns of the short call positions,as expected.
Average Time in Trade & 45-DayAdjusted P/L
Average Time in Trade: 16-Delta Short CallBy closing trades earlier, each position is held for less time, on average:
Average 45-Day P/L: 16-Delta Short CallTaking profits and losses earlier generates more trades in the same period oftime, which increases the 45-day P/L estimations when taking profits early:*45-Day Adjusted P/L Avg. P/L x (45 / Avg. Days in Trade)
Short Call Performance by VIX LevelHow did each short callmanagement approach perform in various impliedvolatility environments?We evenly divided all of the occurrences into four VIX buckets based on theVIX level at the time of trade entry:1.2.3.4.VIX Below 14VIX Between 14 and 17.5VIX Between 17.5 and 23.5VIX Above 23.5
Win Rates by VIX Level
Win Rates by VIX: 16-Delta Short CallsEach approach was relatively consistent across VIX environments:
Win Rates - Breakeven Win Rates by VIX Level
Win Rates - Breakeven Win Rates by VIX LevelWhen analyzing the success rates relative to breakeven success rates, someshort call approaches did not perform well:
Average P/L by VIX Level
Average P/L: 16-Delta Short CallsWhen filtered by VIX environment, the short call approaches with generousstop-losses and high profit targets performed the best with high VIX entries:
Worst Drawdowns by VIX Level
10th Percentile P/L: 16-Delta Short CallsConsistent with the short put findings, short calls entered in high VIXenvironments have historically experienced the largest drawdowns:
45-Day Adjusted P/L by VIX Level
45-Day Average P/L: 16-Delta Short CallsThe 25% profit target approaches typically performed best in the low VIX environments.Stop-loss approaches performed the best in high VIX environments:*45-Day Adjusted P/L Avg. P/L x (45 / Avg. Days in Trade)
The KEY Findings
Key Findings: 16-Delta Short CallsHistorically, the 16-delta short call strategy has performed best in high VIX environments when paired with ahigh profit target (50-100%) and a generous stop-loss (-200% or -300%). Additionally, the worst drawdownshave historically occurred in the high VIX environments, which explains why using a stop-loss has addedvalue.Avg. P/L by VIXWorst Drawdowns by VIX
DisclaimerThe risk of loss in trading securities, options, futures and forex can be substantial. Options involve risk and are not suitable for allinvestors. Consider all relevant risk factors, including their own personal financial situation, before trading. Past results of anyindividual or trading system published by projectoption are not indicative of future returns. Any earnings or income statements orexamples shown through projectoption are only estimates of what might be possible now or in the future. There can be no assuranceas to any particular financial outcome based on the use of projectoption. The information contained on this site is provided forgeneral education and information purposes and therefore should not be considered complete, precise, or current. Some of thematters discussed are subject to detailed rules, regulations, and statutory provisions which should be referred to for additional detailand are subject to changes that may not be reflected in the website. projectoption assumes no responsibility for any errors oromissions in the website. projectoption will not be held liable for losses resulting from information or advice presented in thiswebsite (or third party); the use of such information is entirely at the risk of the user. projectoption assume no responsibility orliability for your trading and investment results whatsoever and under any circumstances. You agree that projectoption.com is notresponsible for your earnings, the success or failure of your personal or business decisions, the increase or decrease of your financesor income level, or any other result of any kind that you may have as a result of information presented to you throughprojectoption.com. No statement or example used within projectoption.com should be construed as a recommendation to buy or sella security or to provide investment advice. The inclusion of advertisements on projectoption should not be construed as anendorsement or an indication of the value of any product, service, or website. By accessing, viewing, or using this site in any way, youagree to be bound by the above conditions and disclaimers found on this site.The examples and demonstrations in this presentation are for educational purposes only, and do not serve as recommendations tobuy or sell securities.
Study Methodology Underlying: S&P 500 ETF (SPY) Time Frame: January 2007 to May 2017 (Most Recent Standard Expiration) Entry Dates: Every Trading Day Expiration Cycle: Standard Expiration Closest to 45 Days to Expiration (resulted in trades between 30-60 days to expiration) Trade: Sell the 16-Delta Call Option Number of Contracts: 1