Transcription
Square Jigsaw Puzzle Solver Literature ReviewPrepared by: Zayd Hammoudeh(zayd.hammoudeh@sjsu.edu)1
Introduction “Jigsaw Puzzle Problem”– Problem Statement: Reconstruct an image from a set ofimage pieces– Problem Complexity: NP-Complete (via the set partitionproblem) when the pairwise affinity of pieces is unreliable [1] Problem Formulation: Set of square, non-overlapping pieces– “Type 1” (also know as “jig swap”) Puzzle: Has fixed, knownorientation of pieces [19]– Type 2 Puzzles: Correct rotation of pieces is unknown [19] A Key Difference with Standard Jigsaw Puzzle Solving: Thesource image you are trying to reconstruct is unknown.2
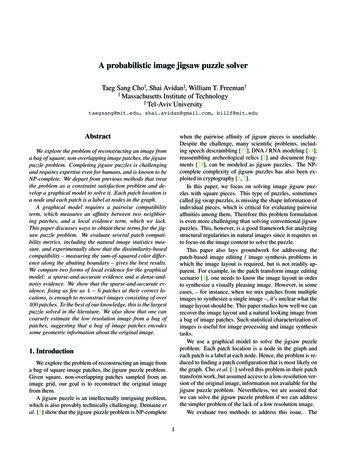
Square Jigsaw Puzzle Example Source image (left) is divided into 81 (9x9) uniform, squarepieces (center). The goal is to organize the pieces toreconstruct the source image (right).3
Jigsaw Puzzle Solver Applicability Possible and existing applications of the jigsaw puzzleproblem include:– Computer Forensics: Reconstructing deleted JPEG, block-basedimages [2]– Document Investigation: Reconstruct shredded documents [3]– Bioinformatics: DNA/RNA modelling and reconstruction [4]– Archeology: Reconstruction of damaged relics [5]– Audio Processing: Voice descrambling [6]4
Additional Variants of ProblemSome of the possible variants to the jigsaw puzzle probleminclude: Missing pieces Extra pieces Three dimensional puzzles Unknown puzzle dimension Multiple puzzles mixed into a single set of pieces.5
Quantifying Piece to Piece Similarity6
Pairwise Affinity Definition: Quantifies the similarity/compatibility between two pieces. Between two pieces 𝑥𝑖 and 𝑥𝑗 , there are 4 pairwise affinity values whenrotation is not allowed and 16 when rotation is allowed. Metrics of particular interest in the literature are divided into twocategories.– Boundary/Edge Based: Normalized and Unnormalized Dissimilarity-based Compatibility Mahalanobis Gradient Distance [12] Prediction-based Compatibility– Statistical based using the entire piece and its statistical properties [14]7
Dissimilarity-Based Compatibility Proposed in Cho et. al. [7] Uses the LAB (lightness and a/b color opponent dimensions), which is three (3) dimensions. Given two pieces 𝑥𝑖 and 𝑥𝑗 that are size 𝐾 pixels by K pixels, then the left-right (𝐿𝑅) dissimilarity(where 𝑥𝑗 is to the right of 𝑥𝑖 ) is:𝐾3𝐷𝐿𝑅 𝑥𝑖 , 𝑥𝑗 𝑥𝑖 𝑙, 𝐾, 𝑑 𝑥𝑗 𝑙, 1, 𝑑2𝑙 1 𝑑 1Where 𝑥𝑚 𝑟, 𝑐, 𝑑 is value for the pixel in row 𝑟 and column 𝑐 of piece 𝑥𝑚 at dimension 𝑑. Disadvantage of this Approach:–Severely penalizes boundary differences between pieces which do occur in actual images [10].–It is common that actual image does not the minimum dissimilarity. Hence, this “better than perfectscore” where the solved solution has a lower score than the original is a type of overfitting [9].8
𝑳𝒑𝒒Dissimilarity-Based Compatibility Proposed by Pomeranz et. al. in [10]. Generalizes thedissimilarity metric from [7] with the 𝐿𝑝𝐾𝑞norm.𝑞𝑝3𝐷𝑝,𝑞 𝑥𝑖 , 𝑥𝑗 𝑥𝑖 𝑙, 𝐾, 𝑑 𝑥𝑗 𝑙, 1, 𝑑𝑝𝑙 1 𝑑 1Hence, [7]’s metric is essentially the 𝐿22norm. While 𝑞 has no effect on the piece pairwise classificationaccuracy, [10] observed it had an effect on their solver’sperformance9
Prediction-Based Compatibility The dissimilarity based approach measured the difference between twopieces.– Prediction based attempts to predict the boundary pixel value of the neighboringpiece. First-Order Example:– Use the last two pixels of each piece to predict the neighboring piece’s value.– Gradient between two right edge pixels for piece 𝑥𝑖 in row 𝑙 for dimension 𝑑:𝑥𝑖 𝑙, 𝐾, 𝑑 𝑥𝑖 (𝑙, 𝐾 1, 𝑑)– Gradient between two left edge pixels for piece 𝑥𝑗 row 𝑙 for dimension 𝑑:𝑥𝑗 𝑙, 1, 𝑑 𝑥𝑖 (𝑙, 2, 𝑑)10
Prediction-Based Compatibility (Continued) The two pixel gradient can be combined with the dissimilarity-based compatibility as shown belowfor piece 𝑥𝑖 ’s right edge:𝑥𝑖 𝑙, 𝐾, 𝑑 𝑥𝑗 𝑙, 1, 𝑑 𝑥𝑖 𝑙, 𝐾, 𝑑 𝑥𝑖 𝑙, 𝐾 1, 𝑑which is equivalent to:2 𝑥𝑖 𝑙, 𝐾, 𝑑 𝑥𝑖 𝑙, 𝐾 1, 𝑑 𝑥𝑗 𝑙, 1, 𝑑𝑞If the 𝐿𝑝 dissimilarity is used, the entire prediction based compatibility for the left-rightboundary of 𝑥𝑖 and 𝑥𝑗 is:𝐾32 𝑥𝑖 𝑙, 𝐾, 𝑑 𝑥𝑖 𝑙, 𝐾 1, 𝑑 𝑥𝑗 𝑙, 1, 𝑑𝑝𝑙 1 𝑑 1 2 𝑥𝑗 𝑙, 1, 𝑑 𝑥𝑗 𝑙, 2, 𝑑 𝑥𝑖 𝑙, 𝐾, 𝑑𝑞𝑝 𝑝Advantage of this Approach: Incorporates a predictor of the pairwise change which may betterestimate pairwise affinity.11
Accuracy Comparison of the Compatibility Metrics Pomeranz et. al. in [10] compared the accuracy of the three compatibilitymetrics on 20 images in a test dataset.𝑞 Using the 𝐿𝑝 norm resulted in a 7% to 10% improvement in selectingthe correct neighbor. The impact of using the prediction-technique varied from no change up toa 3% improvement.𝟏/𝟏𝟔Puzzle SizeDissimilarity-Based432 Pieces78%86%86%540 Pieces76%85%88%805 mparison of Pairwise Similarity Metric Accuracy12
Asymmetric Dissimilarity Proposed by Paikin and Tal [20] and consists of a two parts. The previous definitions of pairwise affinity have beensymmetrically similar such that:𝐷 𝑝𝑖 , 𝑝𝑗 , 𝑟𝑖𝑔ℎ𝑡 𝐷(𝑝𝑗 , 𝑝𝑖 , 𝑙𝑒𝑓𝑡) [20] proposes using an asymmetric dissimilarity such that equalityin the above equation does not hold. Part #1: Paikin and Tal use a one sided, 𝐿1 version of Pomeranz et.al.’s prediction based distance as shown below:𝐾3𝐷 𝑥𝑖 , 𝑥𝑗 , 𝑟𝑖𝑔ℎ𝑡 2 𝑥𝑖 𝑙, 𝐾, 𝑑 𝑥𝑖 𝑙, 𝐾 1, 𝑑 𝑥𝑗 𝑙, 1, 𝑑𝑙 1 𝑑 113
Benefits of Asymmetric Dissimilarity Three times faster due to the elimination of the exponent(80% of runtime is in distance calculations)– Additional speedup can be gained if when the asymmetricdissimilarity is sufficiently large (i.e. no chance of a pairing), thecalculation is stopped and the distance set to infinity. Number of correct “best buddies” increased Number of incorrect decreased Using the benchmark in [17], the number of correctly solvedpuzzles increased from 25 to 37.14
Confident Compatibility In smooth areas, every piece has a small dissimilarity to every other piece in the region.– Hence, having a small dissimilarity by itself does not tell the full story. Part #2: If a piece’s dissimilarity to its closest neighbor is far less than the distance tosecond closest neighbor, then we can have higher confidence they are actually neighbors.– Paikin and Tal use that as the basis for their confident compatibility measure.𝐶 𝑝𝑖 , 𝑝𝑗 , 𝑟 1 𝐷 𝑝𝑖 , 𝑝𝑗 , 𝑟𝑠𝑒𝑐𝑜𝑛𝑑𝐷 𝑝𝑖 , 𝑟 𝑟 – Spatial relationship (e.g. left, right, top bottom) between pieces 𝑝𝑖 and 𝑝𝑗 𝐷 𝑝𝑖 , 𝑝𝑗 , 𝑟 - Asymmetric dissimilarity between pieces 𝑝𝑖 and 𝑝𝑗 𝑠𝑒𝑐𝑜𝑛𝑑𝐷(𝑝𝑖 , 𝑟) – Second best similarity between piece 𝑝𝑖 and all other pieces withrelation 𝑟 Goal: Maximize the value of 𝐶(𝑝𝑖 , 𝑝𝑗 , 𝑟).15
Quantifying Solution Quality16
Measuring Solution Quality Problem Statement: There is no uniform technique for gradingthe final output of a square jigsaw puzzle solver. Two Divergent Approaches:– Performance Metrics: Use the original image to grade solutionquality. Direct Comparison [7] Neighbor Comparison [7]– Estimation Metrics: Evaluates the quality of a solution withoutreference to the original image [10]. “Best Buddies” Ratio17
Performance Metrics Summary: Evaluate the performance of a jigsaw puzzle solveragainst the original (correct) image. Cho et. al. proposed three performance metrics, but only two aregenerally relevant. They are:– Direct Comparison Method: Most naïve approach. The ratio of thenumber of pieces in their correct locations versus the total number ofpieces. Disadvantage: Susceptible to shifts– Neighbor Comparison Method: For each piece, calculate the fractionof its four neighbors that are correct. The total accuracy is theaverage neighbor accuracy of all pieces.18
“Best Buddies”Definition: Two pieces are best buddies if they are more similar to each other on their respective sidesthan they are two any other pieces [10].Hence, two pieces, 𝑥𝑖 and 𝑥𝑗 , are said to be “best buddies” for a spatial relationship 𝑅. if and only if,two conditions hold: 𝑥𝑘 𝑃𝑎𝑡𝑐ℎ𝑒𝑠 , 𝐶 𝑥𝑖 , 𝑥𝑗 , 𝑟1 𝐶 𝑥𝑖 , 𝑥𝑘 , 𝑟1 𝑥𝑘 𝑃𝑎𝑡𝑐ℎ𝑒𝑠 , 𝐶 𝑥𝑗 , 𝑥𝑖 , 𝑟2 𝐶(𝑥𝑗 , 𝑥𝑘 , 𝑟2 )Where: 𝐶(𝑥𝑖 , 𝑥𝑗 , 𝑅1 ) – Compatibility between pieces 𝑥𝑖 and 𝑥𝑗 on side 𝑅𝑖 of 𝑥𝑖 {𝑃𝑎𝑡𝑐ℎ𝑒𝑠} – Set of all pieces in the puzzle 𝑟1 – Spatial relationship (e.g. top, bottom, left, right) of 𝑥𝑖 where 𝑥𝑗 will be placed assuming norotation. 𝑟2 - Given 𝑥𝑖 and 𝑟1 , this represents the complementary side of 𝑥𝑗 . For example if 𝑟1 is “left”, then𝑟2 would be “right”19
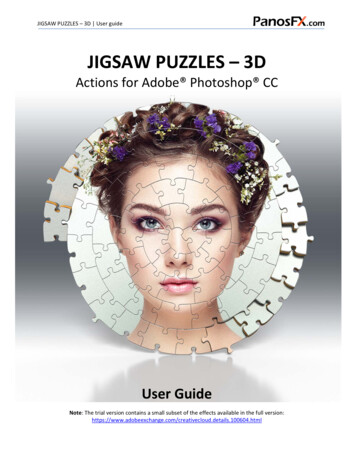
“Best Buddies” Estimation Metric Definition: Ratio of the number of neighbors who are said to be “best buddies” tothe total number of best-buddy neighbors [10]. Correlation between the “Best Buddies” Estimation Metric and Cho et. al.’s twoperformance metrics:– Direct Comparison Metric: Little to no correlation since direct comparison method is notbased on pairwise accuracy.– Neighbor Comparison Metric: Stronger correlation Graph below is for 20 images tested10 times each (for 200 total points)Scatterplot of “Best Buddy” Metricversus Neighbor Comparison Metric20
Existing Jigsaw Puzzle Solver Approaches Dynamic Programming and the “Hungarian” Procedure [13] Patch Transform using a Low Resolution “Solution Image” [8] “Dense and Noisy” or “Sparse and Accurate” with Loopy BeliefPropagation [7] Particle Filter-Based Solver [11] Greedy Algorithm [10] Genetic Algorithm [9] Loop Constraint Solver [19]21
Cho et. al. – The Patch Transform and itsApplication to Image Editing (2008)22
Patch Transform Introduced by Cho et. al. in [8] Overview of the Patch Transform: Segment a source image into aset of non-overlapping “patches” and rearrange these patches andreorganize the image in the “patch” domain.– Intended Usage: Image editing “Inverse” Patch Transform: Reconstruct an image from a set ofpatches. This requires two components:– A patch compatibility function– An algorithm that places all patches Uses a provided low resolution image as part of the patchplacement algorithm.23
Markov Random Field Use a Markov Random Field (MRF) to enforce three rules:– Adjacent pieces should fit plausibly together– A patch should “never” (or in the loosened case “seldomly”) be reused.– User constraints (e.g. board size) on patch placement. Consider each possible patch location as a node in the MRF. The keynotation definitions:– 𝑥𝑖 – Undetermined state for the node 𝑖 𝑡ℎ in the MRF.– 𝜓𝑖,𝑗 (𝑘, 𝑙) – Compatibility between patches 𝑘 and 𝑙 at adjacent MRFlocations 𝑖 and 𝑗– 𝑋 – Vector of 𝑁 determined patch indices, 𝑥𝑖– 𝑌 – Low resolution version of the original image.24
Maximizing the Patch Assignment ProbabilityFor a given patch assignment 𝑋, the probability of that assignment is defined as:1𝑃 𝑋 𝑍𝜙𝑖 𝑥𝑖𝑖𝜓𝑖𝑗 𝑥𝑖 , 𝑥𝑗 𝐸(𝑥)𝑗 𝜁 𝑖 𝑖 : 𝑖 𝑡ℎ node in the MRF/board 𝑁 : Number of nodes in the MRF/board. 𝜙𝑖 𝑥𝑖 : User constraints (e.g. board size) 𝜓𝑖𝑗 𝑥𝑖 , 𝑥𝑗 : Patch to patch compatibility 𝜁 𝑖 : Markov blanket of node 𝑖 𝐸 𝑋 : Exclusion term that discourages patches being used more than once. 𝑍 : Normalization term to ensure 𝑃 𝑋 𝑑𝑋 125
Loopy Belief Propagation Solver Maximizes the preceding probability function using loopybelief propagation. Susceptible to local maxima so random restarts may beperformed. Segue Question: What if I do not have access to a lowresolution version of the original image? Can I make one oruse a substitute?26
Cho et. al. – A ProbabilisticJigsaw Puzzle Solver (2010)27
“Dense and Noisy” Estimation Proposed by Cho et. al. in [7] in 2010. Review: In Cho et. al.’s work in [8], they assumed access to acorrect, low resolution version of the original image.– In many real world applications, such a low resolution image isnot available. Solution: Estimate a low resolution image from a “bag ofpatches.” The simplified procedure is:– Creating a histogram of the bag of patches– “Estimate” a low resolution version by comparing the histogramto a set of 𝐾 centroids with predefined low resolution images.28
“Dense and Noisy” Clusteringand Histogram Generation Training Set: 8.5M patches from 15,000 images.– Patch Size: 7px by 7px by 3 (LAB) for 147 total, originaldimensions. This dimensionality is reduced via PCA. Clustering the Patches– Step #1: Cluster each image’s patches into 𝐿 (e.g. 20) centroids.– Step #2: Re-cluster the 𝐿 centroids from all images into 𝑁 (e.g.200) centroids. Creating the Histogram: For a given image, assign each patchto its closest centroid.29
“Dense and Noisy” – Generating the Low Res. Image Theoretical Motivation: Different colors are more likely to beat different places in an image.– Example: Blue (sky) is more likely to be towards the top of theimage while brown (soil) tends to be in the image foreground. Mapping Bins to the Image: Use the training set to generateprobability density maps for each histogram bin. Use the Histogram to Create the Low Resolution Image: Usea trained, linear regression function to map the “bag ofpatches” histogram to the training images (i.e. use priorknowledge).30
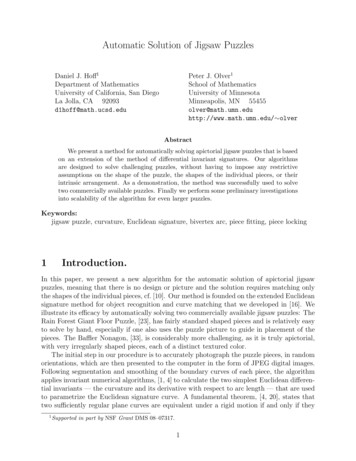
“Dense and Noisy” Results Summary: Patch histogram can “coarsely predict” a lowresolution of the original image.– Possible Explanation: There is enough “structural regularity” inimages that a bag of patches provides spatial information. Patch Rank Map: For each pixel in the low resolution images,patches are ranked from least likely to most likely to reside inthat location.– Ideal Case: The set of patches that map to the low resolutionwill have the best rank (i.e. 1)– Worst Case: The matching set of patches will have rank 𝑁(where 𝑁 is the number of patches in the image).31
“Dense and Noisy” End to End ExampleBest ResultsWorst ResultsConfusedsnow for sky32
“Sparse and Accurate” Proposed by Cho et. al. in [7] Common Human Approach to Solving Puzzles: “Outside-in”– Find the puzzle’s four corner pieces.– Build from the corner pieces until all four sections converge. “Sparse and accurate” is based off the “outside-in” technique.– Definition on an “Anchor Patch”: A puzzle patch that is placed in its correctlocation and orientation.– Summary of the Approach: Place a set of 𝑁 anchor patches and then solve thepuzzle. Two most important criteria of anchor patches– Quantity– Uniform Spatial Distribution of the Anchors33
Pomeranz et. al. – A Fully AutomatedGreedy Square Jigsaw Puzzle Solver (2011)34
Generalized Greedy Algorithm Proposed by Pomeranz et. al. in [10] in 2011. Goal: Provide a computational framework for handling square jigsawpuzzles in reasonable time that does not rely on any prior knowledge orhuman intervention. Solver divides the puzzle reconstruction into three subproblems:– Placement: Given a single piece or partially-placed set of pieces, placethe remaining pieces.– Segmentation: Given a fully-placed board, segment the board intotrusted subcomponents that are believed to be placed correctly.– Shifting: Given a set the trusted segments, relocate entire segmentsand individual pieces to improve solution quality.35
Overview of the Greedy Placement Phase Given a partially assembled board (either a single piece or set of pieces), continueapplying the greedy choice until all pieces are placed. Overview of the Greedy Choice:– Board dimensions are known in advance and fixed– Board locations with a higher number of occupied neighbors are preferred as the choice ofthe next piece is more informed.– Piece selection criteria: Primary Criteria: Prefer a “best buddy” first. Secondary Criteria: If no or multiple pieces satisfy the primary criteria, select the piece with thehighest compatibility score. Question: Why is a placer not enough? Answer: A greedy placer works solely on local information. To get the best results, wemust also look at the entire global solution.36
Segmenter Phase Definition of “Segments”: Areas of the puzzle that are (or“are believed to be”) assembled correctly. Procedure: Using random seeds and a segmentationpredicate based on the “best buddies” metric, grow thesegments via “region growing segmentation algorithm”described in [15]. Accuracy of the Segmenter: 99.7%37
Pomeranz’s Complete Algorithm Step #1: Select a single puzzle piece as the seed to placementphase. Step #2: Perform the placement phase around the seed. Step #3: Use the segmenter to partition the board. Step #4: Calculate the “best buddies” ratio. If you are at alocal maximum, stop. Step #5: Select the largest segment from step #3 and use it asthe seed of the placement phase. Return to step #2.– Performing this step is similar to shifting the largest segment.38
Sholomon et. al. – A Genetic Algorithm-BasedSolved for Very Large Jigsaw Puzzles (2013)39
Genetic Algorithm (GA) Solver Proposed by Sholomon et. al. in 2013 [9].– A genetic algorithm puzzle solver was first proposed in [16] in2002. Genetic Algorithm Review– Based off the biological theory of natural selection.– GAs are divided into a series of stages Random generation of initial populationSuccessor selectionReproductionMutation– Requires a “fitness function” that measures solution quality.40
Sholomon’s GA Implementation Puzzle Type: 1 (pieces have known orientation) Chromosome (Solution) Representation: 𝑁 by 𝑀 matrix where each cell represents one patch inthe puzzle. Population Size: 1,000 Number of Generations: 100 Number of Restarts: 10 Successor Selection Algorithm: Roulette Wheel Elitism: Always pass the four best solutions to the next generation Culling: None Mutation Rate: 5% Fitness Function: Sum of the 𝐿2 dissimilarity of all pieces in the puzzle Color Space: LAB41
GA Crossover Takes two “highly fit” parents and returns one child.– Non-trivial as the crossover must ensure there are noduplicate/missing pieces in the solution. Correctly assembled segments may be at incorrect absolutelocations. Hence, the crossover must allow for “positionindependence”, which is the ability to shift segments. Sholomon et. al.’s Approach: Kernel-growing.42
Sholomon’s Kernel Growing Algorithm Start with a single puzzle piece that is “floating” in the board such that the puzzlecan grow in any direction.– Boundary size (i.e. length by width) is fixed and known. Piece Placement Algorithm: When deciding on the next piece to place, thealgorithm iterates through up to three phases.– Phase #1: In an available boundary location, place the piece where both parents agreeon the neighbor.– Phase #2: Place a “best buddy” that exists in one of the parents.– Phase #3: Select a location randomly and pick the piece with the best pairwise affinity.– If in any phase there is a tie, the tie is broken randomly.– After a piece is placed, the placement algorithm returns to phase #1 for the next piece.– Once a piece is placed, it can never be reused.43
Kernel Growing with Mutation Mutations in genetic algorithms are used to improve thequality of the final solution via increased population diversity. Sholomon’s Mutation Strategy: During the first and thirdphase of placement, place a piece at random with some lowprobability (e.g. 5%)44
A Possible Benchmark Sholomon et. al. provide three large puzzle datasets as well astheir results for comparative benchmarking [17].– Dataset Puzzle Sizes: 5,015, 10,375, and 22,834 Unfortunately the website seems to no longer exist. I willseparately send an email to the authors about why theremoved the content. Used as a benchmark in [20].45
Algorithm Runtime ComparisonTo improve execution time, Sholomon et. al. precompute and store all pairwisedissimilarity values.# of PiecesSholomon et. al.Pomeranz et. 3.21hrN/A22,83413.19hrN/AComparison of the Algorithm Execution Timefor Sholomon et. al. and Pomeranz et. al.46
Son et. al. – Solving Square Jigsaw Puzzleswith Loop Constraints (2014)47
Solving Jigsaw Puzzles with Loop Constraints Proposed by Son et. al. in [19]. Best buddies can be viewed as a loop of two pieces that agreeon one boundary.– Son et. al. propose using a larger loop of 4 pieces (2x2) that agreeon four boundaries. Other work on the puzzle problem has either ignored orexplicitly avoided cycles [12].– By using cycles, you are able to achieve a type of outlierrejection.48
Small Loops Notation:– 𝑆𝐿𝑖 – Small loop of size 𝑖 by 𝑖 pieces.– 𝑆𝐿𝑁 – Maximum size of a small loop. The term “small loop” is used to emphasize that the algorithmfocuses on the shortest possible cycle at each stage. Benefits ofshorter loops include:– Longer loops are less likely to be made of entirely correct pairwisematches.– The number (i.e. permutations) of different cycles increasesexponentially with the length of the cycle.– Longer loops can be constructed by assembling multiple smaller loops. Smaller loops are merged to form larger loops.– Example: Four 2x2 loops are merged to form one 3x3 loop.49
Representing Pieces and Puzzles Each piece in the puzzle is represented by a complex number.– Real Component: A unique piece ID between 1 and the totalnumber of pieces in the board.– Imaginary Component: A whole number in the set {0, 1, 2, 3}with the number representing the number of counter clockwisepiece rotations. For type 1 puzzles, there is no imaginary component. Structures (e.g. small loops, even the entire puzzle) arerepresented as complex value matricies.50
Relationships between the Complex Matrices If two complex-valued matrices, 𝑈 and 𝑉, do not share at least two of thesame ID pieces in complementary locations, they are considered unrelated(𝑈 𝑉). If 𝑈 and 𝑉 that share at least two of the same ID pieces, they can beconsidered geometrically consistent (𝑈 𝑉). Types of geometric conflicts that make two matrices, 𝑈 and 𝑉,geometrically inconsistent (𝑈 𝑉) are:– Overlap with different complex numbers (i.e. ID or rotation)– Existing of the same ID (real) in a non-shared region. If two matrices, 𝑈 and 𝑉, are geometrically consistent, they can bemerged (𝑈 𝑉).51
Managing Piece-wise Computations If for a given pair of pieces the distance is above somethreshold, the two pieces are consider not pair worthy andignored with respect to each other.– Each piece will have a maximum number (e.g. 10) of pair worthyneighbors. Pairwise compatibility is stored in a 𝐾 by 𝐾 by 16 matrix (𝑀)where 𝐾 is the number of pieces and 16 represents thenumber of possible rotations for each piece in a Type-2puzzle.– If 𝑀 𝑥, 𝑦, 𝑧 1, then pieces 𝑥 and 𝑦 are compatible withconfiguration (rotation and side) 𝑧.52
Creating Larger Small Loops Larger “small loops” are build iteratively. In the first iteration, 𝑆𝐿2 (i.e. two piece by two piece) loopsare formed.– Consistency between all loops is them check. In the next iteration, four consistent 𝑆𝐿2 loops can be mergedto form 𝑆𝐿3 loops. Hence, the algorithm constructs 𝑆𝐿𝑖 loops using 𝑆𝐿𝑖 1 loops. This process continues until no higher order loops can be builtand some highest order loop (𝑆𝐿𝑁 ) is found.53
Managing Structure-Wise Computations Ω𝑖 {𝜔𝑖1 , 𝜔𝑖2 , , 𝑤𝑖𝐾𝑖 } represents all of the 𝑆𝐿𝑖 dimensionstructures– Similar to what was done for piece-wise compatibility,structure-wise compatibility is stored in a 𝐾𝑖 by 𝐾𝑖 by 16 matrix(where 𝐾𝑖 is the number of structures of dimension 𝑆𝐿𝑖 ). Structures that are consistent and overlap on more than twopieces are merged.– If two structures both align at a given location, the one with thesuperior pairwise matching is prefered.54
Paikin and Tal – Solving Multiple SquareJigsaw Puzzles with Missing Pieces (2015)55
Managing Missing Pieces and Multiple Puzzles Proposed by Paikin and Tal in [20]. Inspired by Pomeranz et. al.’s greedy algorithm [10] withthree additional requirements:– New Requirement #1: A modified compatibility function– New Requirement #2: Superior initial seed selection.– New Requirement #3: Rather than making the “best”/ “closestmatching” selection at each iteration, make the selection withthe lowest chance of erring regardless of location. This makes their algorithm deterministic eliminating the need forrestarts. Accuracy: 97.7% on dataset in [17]56
Puzzle Problem RequirementsPaikan’s & Tal’s jigsaw puzzle problem definition (as enumeratedbelow) is the most difficult presented to date. Size of the puzzle(s) is unknown and may be different Orientation of the pieces is unknown Pieces may missing Input may contain pieces from multiple puzzlesOnly Input to the Algorithm: Number of puzzles to be solved.57
Overview of Paikin and Tal’s Algorithm Similar to Pomeranz et. al., Paikin and Tal use a greedystrategy. With greedy algorithms, early suboptimal decisions can leadto major divergences in the future.– To reduce the likelihood such poor decisions, Paikin and Tal’salgorithm focuses on delaying potentially poor decisions. Phase #1: Calculate and store all piece to piece the confidentcompatibility values.58
Phase #2 – Initial Piece Selection Previous work by [9] and [10] selected a random piece as the seed fortheir placer– This spawns the need to run their algorithms multiple times to get betterresults. Paikin and Tal select the most distinctive piece in the most distinctiveregion as their algorithm’s initial seed. Picking the Most Distinctive Piece: Select as the initial seed the piece thathas four best buddies as its neighbors and whose neighbors also have fourbest buddies.– This approach helps ensure both the piece and region are distinctive– Note: Best buddies is defined based off the confident compatibility unlikehow it is defined in Pomeranz et. al. [10].59
Phase #2 – Mutual Compatibility If multiple pieces satisfy the “most distinctive” piece criteria, then select the piece withthe “strongest” best buddies in all four directions. Paikin and Tal’s approach: Maximize the mutual compatibility with all four neighbors.𝐶 𝑝𝑖 , 𝑝𝑗 , 𝑟1 𝐶 𝑝𝑗 , 𝑝𝑖 , 𝑟2𝐶 𝑝𝑖 , 𝑝𝑗 , 𝑟1 𝐶(𝑝𝑗 , 𝑝𝑖 , 𝑟2 ) 2 𝐶 𝑝𝑖 , 𝑝𝑗 , 𝑟1 – Mutual compatibility between pieces 𝑝𝑖 and 𝑝𝑗 for spatial relation 𝑟1 𝐶 𝑝𝑖 , 𝑝𝑗 , 𝑟1 - Confident dissimilarity between pieces 𝑝𝑗 and 𝑝𝑖 for spatial relation 𝑟1 𝑟2 - Complementary spatial relationship with 𝑟1 . For example, if 𝑟1 is “right”, then 𝑟2 is“left”.60
Phase #3: Basic Placement AlgorithmWhile there are unplaced piecesif the pool is not emptyExtract the best candidate from the poolelseRecalculate the compatibility functionFind the best neighbors (not best buddies)Place the above best piece.Add the best buddies of the placed piece tothe pool61
Phase #3: Placement Overview If the placement pool is not empty, then the “best candidate”is defined as the one in the pool with the highest mutualcompatibility.– Unlike best buddies which used asymmetric dissimilarity, thegreedy placer uses mutual compatibility. If the pool is empty, the mutual compatibility values arerecalculated using only the unplaced pieces and the borderpieces in the puzzle.– The piece with the highest mutual compatibility is then placedonto the board– The newly placed piece’s best buddies (if any) are placed intothe pool.62
Phase #3: Handling Multiple Puzzles Other than the pieces themselves, the only input into Paikinand Tal’s algorithm is the number of puzzles Modified Approach for Multiple Boards: When the mutualcompatibility between placed and unplaced pieces dropsbelow a specified threshold (e.g. 0.5), the candidate pool iscleared, and a new puzzle is started.– The seed of the new puzzle uses the same approach that wasused for the first puzzle.– New puzzles can be created up to the specified input number.– Placement goes on simultaneously across all puzzles.63
Phase #3: Handling Missing Pieces Unlike previous attempts at the problem, Paikin and Tal neverspecifically try to fill a particular slot in the puzzle. Rather Paikin and Tal always try to fill the slot in which theyhave the most confidence. This allows their algorithm to handle missing puzzle pieces.64
Puzzle Piece Size65
Comparison of Piece SizesReferencePiece SizeCho et. al. (2010)7px by 7pxPomeranz et. al. (2010)28px by 28pxSholomon et. al. (2013)28px by 28pxWu (SJSU Thesis) [20]25px by 25px66
List of References[1]Erik D. Demaine and Martin L. Demaine, “Jigsaw Puzzles, Edge Matching, andPolyomino Packing: Connections and Complexity”, Graphs and Combinatorics,volume 23 (Supplement), June 2007, pages 195–208.[2]Simson L. Garfinkel. 2010. Digital forensics research: The next 10 years. DigitalInvestigation 7 (August 2010), S64-S73.[3]Liangjia Zhu, Zongtan Zhou, and Dewen Hu. 2008. Globally ConsistentReconstruction of Ripped-Up Documents. IEEE Trans. Pattern Anal. Mach.Intell. 30, 1 (January 2008), 1-13.[4]Marande, W., and Burger, G. 2007. Mitochondrial DNA as a genomic jigsawpuzzle. Science 318-415.[5]Benedict J. Brown, Corey Toler-Franklin, Diego Nehab, Michael Burns, DavidDobkin, Andreas Vlachopoulos, Christos Doumas, Szymon Rusinkiewicz, andTim Weyrich. 2008. A system for high-volume acquisition and matching offresco fragments: reassembling Theran wall paintings. In ACM SIGGRAPH 2008papers (SIGGRAPH '08).67
List of References (Continued)[6]Yu-Xiang Zhao, Mu-Chun Su, Zhong-Lie Chou, and Jonathan Lee. 2007. Apuzzle solver and its application in speech descrambling. In Proceedings of the2007 annual Conference on International Conference on ComputerEngineering and Applications (CEA'07), 171-176.[7]Cho, Taeg Sang, Avidan, Shai and Freeman, William T. "A probabilistic imagejigsaw puzzle solver." Proc. IEEE Conf. Computer Vision and PatternRecognition, 2010.[8]Cho, Taeg Sang, Avidan, Shai and Freeman, William T. "The Patch Transformand Its Applications to Image Editing," Proc. IEEE Conf. Computer Vision andPattern Recognition, 2008.[9]Sholomon, D.; David, O. E.; and Netanyahu, “A genetic algorithm-based solverfor very large jigsaw puzzles”. Proc. IEEE Conference on Computer Vision andPattern Recognition, 2013.[10]Pomeranz, D.; Shemesh, M. & Ben-Shahar, O “A fully automated greedysquare jigsaw puzzle solver,” Proc. IEEE Conf. Computer Vision and PatternRecognition, 2011.68
Lis
Introduction "Jigsaw Puzzle Problem" -Problem Statement: Reconstruct an image from a set of image pieces -Problem Complexity: NP-Complete (via the set partition problem) when the pairwise affinity of pieces is unreliable [1] Problem Formulation: Set of square, non-overlapping pieces -"Type 1" (also know as "jig swap") Puzzle: Has fixed, known