Transcription
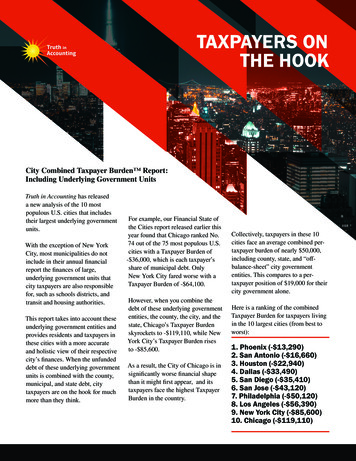
TAXPAYERS ONTHE HOOKCity Combined Taxpayer Burden Report:Including Underlying Government UnitsTruth in Accounting has releaseda new analysis of the 10 mostpopulous U.S. cities that includestheir largest underlying governmentunits.With the exception of New YorkCity, most municipalities do notinclude in their annual financialreport the finances of large,underlying government units thatcity taxpayers are also responsiblefor, such as schools districts, andtransit and housing authorities.This report takes into account theseunderlying government entities andprovides residents and taxpayers inthese cities with a more accurateand holistic view of their respectivecity’s finances. When the unfundeddebt of these underlying governmentunits is combined with the county,municipal, and state debt, citytaxpayers are on the hook for muchmore than they think.For example, our Financial State ofthe Cities report released earlier thisyear found that Chicago ranked No.74 out of the 75 most populous U.S.cities with a Taxpayer Burden of- 36,000, which is each taxpayer’sshare of municipal debt. OnlyNew York City fared worse with aTaxpayer Burden of - 64,100.However, when you combine thedebt of these underlying governmententities, the county, the city, and thestate, Chicago’s Taxpayer Burdenskyrockets to - 119,110, while NewYork City’s Taxpayer Burden risesto - 85,600.As a result, the City of Chicago is insignificantly worse financial shapethan it might first appear, and itstaxpayers face the highest TaxpayerBurden in the country.Collectively, taxpayers in these 10cities face an average combined pertaxpayer burden of nearly 50,000,including county, state, and “offbalance-sheet” city governmententities. This compares to a pertaxpayer position of 19,000 for theircity government alone.Here is a ranking of the combinedTaxpayer Burden for taxpayers livingin the 10 largest cities (from best toworst):1. Phoenix (- 13,290)2. San Antonio (- 16,660)3. Houston (- 22,940)4. Dallas (- 33,490)5. San Diego (- 35,410)6. San Jose (- 43,120)7. Philadelphia (- 50,120)8. Los Angeles (- 56,390)9. New York City (- 85,600)10. Chicago (- 119,110)
PHOENIX TAXPAYERS ONTHE HOOK FOR - 13,290- 5,900May 2019truthinaccounting.orgTaxpayer Burden City of Phoenix- 1,140Maricopa County- 470Phoenix Union High School District No. 210- 310- 330Washington Elementary School District No. 6Paradise Valley Elementary School District No. 69- 150- 260Glendale Union High School District- 100Roosevelt Elementary School District No. 66Phoenix Elementary School District No. 1- 70Maricopa Community College District- 60Madison Elementary School District No. 38 0Riverside Elementary School District No. 2- 4,500ArizonaAmount needed to pay off state, city,county, and underlying governments’unfunded debt.- 13,290per taxpayer
Phoenix’s Combined Taxpayer BurdenFAST FACTS Phoenix has a Taxpayer Burden of - 5,900, which is each taxpayer’s share of the city’s debt. Phoenix taxpayers also pay taxes to the county and the city’s underlying government units. Ifthese debts are included, each taxpayer’s burden is - 8,790. When state debt is combined with this debt, each taxpayer has a burden of - 13,290.Less BillsAssets availableto pay bills*Unfundedpension benefitsdueUnfunded OPEBOther bills **Money available(needed) to paybillsPhoenix 3.8 billion 4.5 billion 185.5 million 1.8 billionMaricopa County 957.0 million 2.0 billion( 6.3 million)Phoenix UnionHigh SchoolDistrict No. 210 208.5 million 271.4 millionWashingtonElementary SchoolDistrict No. 6 119.2 millionParadise ValleyElementary SchoolDistrict No. 69Government UnitTaxpayerSurplus(Burden)Grade( 2.7 billion)( 5,900)D 360.3 million( 1.4 billion)( 1,140)C 57.8 million 92.3 million( 213.0 million)( 470)C 183.6 million( 200,000) 83.3 million( 147.5 million)( 330)C 207.7 million 240.3 million 12.9 million 95.5 million( 141.0 million)( 310)CGlendale UnionHigh SchoolDistrict 79.8 million 127.1 million 22.2 million 45.8 million( 115.3 million)( 260)CRooseveltElementary SchoolDistrict No. 66 33.4 million 77.7 million( 100,000) 24.5 million( 68.7 million)( 150)CPhoenix ElementarySchool DistrictNo. 1 35.4 million 66.3 million 700,000 14.5 million( 46.1 million)( 100)CMaricopaCommunity CollegeDistrict 669.4 million 571.8 million( 700,000) 182.4 million( 84.1 million)( 70)CMadisonElementary SchoolDistrict No. 38 77.2 million 41.8 million 800,000 59.6 million( 24.9 million)( 60)CRiversideElementary SchoolDistrict No. 2 13.5 million 7.2 million 0 5.7 million 600,000 0CArizona 9.8 billion 7.6 billion 1.2 billion 9.8 billion( 8.8 billion)( 4,500)C( 13,290)* Does not include capital assets or restricted assets** Does not include debt related to capital assetsTruth in Accounting is committed to educating and empowering citizens with understandable, reliable, andtransparent government financial information. To be knowledgeable participants in their government and itsbudget process, citizens need truthful and transparent financial information.
SAN ANTONIO TAXPAYERSON THE HOOK FOR - 16,660- 3,200May 2019truthinaccounting.orgTaxpayer Burden City of San Antonio- 1,430Bexar County- 630North East Independent School District (ISD)- 340San Antonio ISD- 270Northside ISD- 240Alamo Community College District- 140VIA Metropolitan Transit- 130Harlandale ISD- 100South San Antonio ISD- 80Edgewood ISD- 10,100TexasAmount needed to pay off state, city,county, and underlying governments’unfunded debt.- 16,660per taxpayer
San Antonio’s Combined Taxpayer BurdenFAST FACTS San Antonio has a Taxpayer Burden of - 3,200, which is each taxpayer’s share of the city’s debt. San Antonio taxpayers also pay taxes to the county and the city’s underlying government units.If these debts are included, each taxpayer’s burden is - 6,560. When state debt is combined with this debt, each taxpayer has a burden of - 16,660.Less BillsMoneyavailable(needed) to Assetsavailable topay bills*Unfundedpensionbenefits dueUnfundedOPEBOther bills **San Antonio 4.5 billion 1.6 billion 1.0 billion 3.3 billion( 1.4 billion)( 3,200)CBexar County 2.1 billion 332.7 million 191.8 million 2.4 billion( 784.7 million)( 1,430)CNorth East ISD 274.0 million 119.4 million 219.6 million 198.2 million( 263.3 million)( 630)CSan AntonioISD 246.3 million 86.1 million 204.9 million 98.3 million( 143.0 million)( 340)CNorthside ISD 683.7 million 202.5 million 333.4 million 261.6 million( 113.8 million)( 270)CAlamoCommunityCollege District 212.8 million 54.7 million 158.4 million 134.0 million( 134.2 million)( 240)CVIAMetropolitanTransit 197.2 million 144.9 million 22.1 million 88.0 million( 57.8 million)( 140)CHarlandale ISD 130.5 million 35.3 million 57.6 million 91.2 million( 53.7 million)( 130)CSouth SanAntonio ISD 40.6 million 20.0 million 35.2 million 27.2 million( 41.8 million)( 100)CEdgewood ISD 57.1 million 27.6 million 45.9 million 18.4 million( 34.7 million)( 80)CTexas 76.1 billion 45.0 billion 65.5 billion 47.8 billion( 82.2 billion)( 10,100)D( 16,660)* Does not include capital assets or restricted assets** Does not include debt related to capital assetsTruth in Accounting is committed to educating and empowering citizens with understandable, reliable, andtransparent government financial information. To be knowledgeable participants in their government and itsbudget process, citizens need truthful and transparent financial information.
HOUSTON TAXPAYERS ONTHE HOOK FOR - 22,940May 2019truthinaccounting.org- 11,300Taxpayer Burden City of Houston- 750Harris County- 390Houston Independent School District (ISD)- 320Metropolitan Transit Authorityof Harris County (METRO)- 150Spring Branch ISD- 140Alief ISD- 20Houston Community College 230Port of Houston Authority ofHarris County- 10,100TexasAmount needed to pay off state, city,county, and underlying governments’unfunded debt.- 22,940per taxpayer
Houston’s Combined Taxpayer BurdenFAST FACTS Houston has a Taxpayer Burden of - 11,300, which is each taxpayer’s share of the city’s debt. Houston taxpayers also pay taxes to the county and the city’s underlying government units. Ifthese debts are included, each taxpayer’s burden is - 12,840. When state debt is combined with this debt, each taxpayer has a burden of - 22,940.Less BillsUnfundedpensionbenefits dueUnfundedOPEBOther bills **Moneyavailable(needed) to Assetsavailable topay bills*Houston 4.1 billion 5.1 billion 2.2 billion 4.3 billion( 7.4 billion)( 11,300)DHarris County 3.8 billion 741.7 million 1.9 billion 2.2 billion( 990.2 million)( 750)CHouston ISD 2.4 billion 464.7 million 653.0 million 1.5 billion( 252.6 million)( 390)CMetropolitanTransitAuthority ofHarris County(METRO) 508.6 million 243.5 million 584.7 million 282.2 million( 601.8 million)( 320)CSpring BranchISD 199.0 million 64.4 million 113.7 million 121.3 million( 100.4 million)( 150)CAlief ISD 213.6 million 110.6 million 179.3 million 114.1 million( 190.4 million)( 140)CHoustonCommunityCollege 312.3 million 74.3 million 84.8 million 167.4 million( 14.2 million)( 20)CPort of HoustonAuthority ofHarris County 401.2 million 10.3 million 6.2 million 81.7 million 303.0 million 230BTexas 76.1 billion 45.0 billion 65.5 billion 47.8 billion( 82.2 billion)( 10,100)D( 22,940)* Does not include capital assets or restricted assets** Does not include debt related to capital assetsTruth in Accounting is committed to educating and empowering citizens with understandable, reliable, andtransparent government financial information. To be knowledgeable participants in their government and itsbudget process, citizens need truthful and transparent financial information.
DALLAS TAXPAYERS ONTHE HOOK FOR - 33,490May 2019truthinaccounting.org- 21,600Taxpayer Burden City of Dallas- 1,670Dallas Independent School DIstrict- 420Dallas County 40Dallas County Community College District 260Dallas/Fort Worth InternationalAirport- 10,100TexasAmount needed to pay off state, city,county, and underlying governments’unfunded debt.- 33,490per taxpayer
Dallas’ Combined Taxpayer BurdenFAST FACTS Dallas has a Taxpayer Burden of - 21,600, which is each taxpayer’s share of the city’s debt. Dallas taxpayers also pay taxes to the county and the city’s underlying government units. Ifthese debts are included, each taxpayer’s burden is - 23,390. When state debt is combined with this debt, each taxpayer has a burden of - 33,490.Less BillsUnfundedpensionbenefits dueUnfundedOPEBOther bills **Moneyavailable(needed) to Assetsavailable topay bills*Dallas 2.2 billion 7.3 billion 499.9 million 2.3 billion( 7.8 billion)( 21,600)FDallasIndependentSchool District 1.5 billion 371.2 million 629.3 million 1.1 billion( 603.7 million)( 1,670)CDallas County 1.8 billion 652.8 million 300.7 million 1.1 billion( 311.9 million)( 420)CDallas CountyCommunityCollege District 436.0 million 64.0 million 204.3 million 134.6 million 33.1 million 40B 1.9 billion 176.0 million 6.2 million 1.2 billion 547.1 million 260B 76.1 billion 45.0 billion 65.5 billion 47.8 billion( 82.2 billion)( 10,100)DDallas/Fort WorthInternationalAirportTexas( 33,490)* Does not include capital assets or restricted assets** Does not include debt related to capital assetsTruth in Accounting is committed to educating and empowering citizens with understandable, reliable, andtransparent government financial information. To be knowledgeable participants in their government and itsbudget process, citizens need truthful and transparent financial information.
SAN DIEGO TAXPAYERS ONTHE HOOK FOR - 35,410May 2019truthinaccounting.org- 5,000Taxpayer Burden City of San Diego- 4,590San Diego Unified School District- 2,190San Diego County- 870Poway Unified School District- 730San Diego Community College District- 110San Ysidro School District- 100San Diego Metropolitan Transit District 180San Diego County Water Authority- 22,000CaliforniaAmount needed to pay off state,city, county, and underlyinggovernments’ unfunded debt.- 35,410per taxpayer
San Diego’s Combined Taxpayer BurdenFAST FACTS San Diego has a Taxpayer Burden of - 5,000, which is each taxpayer’s share of the city’s debt. San Diego taxpayers also pay taxes to the county and the city’s underlying government units. Ifthese debts are included, each taxpayer’s burden is - 13,410. When state debt is combined with this debt, each taxpayer has a burden of - 35,410.GovernmentUnitAssetsavailable topay bills*San DiegoLess BillsMoneyavailable(needed) topay billsTaxpayerSurplus(Burden)Grade 1.4 billion( 2.2 billion)( 5,000)D 179.9 million 1.1 billion( 2.1 billion)( 4,590)C 3.4 billion 132.2 million 2.2 billion( 2.3 billion)( 2,190)C 100.7 million 384.2 million 73.3 million 33.6 million( 390.5million)( 870)CSan DiegoCommunityCollege District 292.1 million 332.6 million 14.3 million 273.9 million( 328.6million)( 730)CSan YsidroSchool District 36.5 million 54.4 million 6.9 million 24.5 million( 49.4 million)( 110)CSan DiegoMetropolitanTransit District 208.3 million 181.3 million 45.4 million 89.2 million( 107.6million)( 100)CSan DiegoCounty WaterAuthority 458.4 million 70.1 million( 800,000) 197.3 million 191.7 million 180BCalifornia 100.1 billion 102.5 billion 107.0 billion 160.4 billion( 269.9 billion)( 22,000)FUnfundedpensionbenefits dueUnfunded OPEBOther bills ** 2.2 billion 2.5 billion 553.9 millionSan DiegoUnified SchoolDistrict 779.8 million 1.5 billionSan DiegoCounty 3.4 billionPoway UnifiedSchool District( 35,410)* Does not include capital assets or restricted assets** Does not include debt related to capital assetsTruth in Accounting is committed to educating and empowering citizens with understandable, reliable, andtransparent government financial information. To be knowledgeable participants in their government and itsbudget process, citizens need truthful and transparent financial information.
SAN JOSE TAXPAYERS ONTHE HOOK FOR - 43,120- 10,200May 2019truthinaccounting.orgTaxpayer Burden City of San Jose- 7,110Santa Clara County- 960East Side Union High School District- 480- 870San Jose Unified School DistrictSan Jose-Evergreen Community College District- 410Evergreen School District- 370- 350Alum Rock Union School DistrictOak Grove School District- 260Franklin-McKinley School District- 130Moreland School District 20Santa Clara Valley Transportation Authority- 22,000CaliforniaAmount needed to pay off state, city,county, and underlying governments’unfunded debt.- 43,120per taxpayer
San Jose’s Combined Taxpayer BurdenFAST FACTS San Jose has a Taxpayer Burden of - 10,200, which is each taxpayer’s share of the city’s debt. San Jose taxpayers also pay taxes to the county and city’s underlying government units. If thesedebts are included, each taxpayer’s burden is - 21,120. When state debt is combined with this debt, each taxpayer has a burden of - 43,120.Less BillsOther bills **Money available(needed) to paybillsTaxpayerSurplus(Burden)Grade 1.1 billion 783.2 million( 3.4 billion)( 10,200)D 4.1 billion 1.3 billion 2.9 billion( 4.4 billion)( 7,110)D 332.1 million 278.7 million 40.0 million 333.7 million( 320.2 million)( 960)CSan Jose UnifiedSchool District 187.0 million 341.4 million 4.3 million 132.2 million( 290.9 million)( 870)CSan JoseEvergreenCommunityCollege District 124.9 million 117.2 million( 10.6 million) 177.4 million( 159.1 million)( 480)CEvergreen SchoolDistrict 58.0 million 121.0 million 38.1 million 35.8 million( 137.0 million)( 410)CAlum Rock UnionSchool District 69.6 million 137.3 million 0 54.6 million( 122.4 million)( 370)COak GroveSchool District 75.5 million 119.2 million 22.9 million 49.7 million( 116.4 million)( 350)CFranklinMcKinley SchoolDistrict 59.4 million 101.7 million 600,000 45.2 million( 88.1 million)( 260)CMoreland SchoolDistrict 41.0 million 59.2 million 5.2 million 20.1 million( 43.3 million)( 130)CSanta ClaraValleyTransportationAuthority 618.3 million 291.9 million( 58.0 million) 372.6 million 11.8 million 20BCalifornia 100.1 billion 102.5 billion 107.0 billion 160.4 billion( 269.9 billion)( 22,000)FGovernmentUnitAssets availableto pay bills*Unfundedpension benefitsdueUnfunded OPEBSan Jose 1.6 billion 3.2 billionSanta ClaraCounty 4.0 billionEast Side UnionHigh SchoolDistrict( 43,120)* Does not include capital assets or restricted assets** Does not include debt related to capital assetsTruth in Accounting is committed to educating and empowering citizens with understandable, reliable, andtransparent government financial information. To be knowledgeable participants in their government and itsbudget process, citizens need truthful and transparent financial information.
PHILADELPHIA TAXPAYERSON THE HOOK FOR - 50,120May 2019truthinaccounting.org- 27,900Taxpayer Burden City of Philadelphia- 4,220Southeastern Pennsylvania Transportation Authority(SEPTA) 800Philadelphia Housing Authority- 18,800PennsylvaniaAmount needed to pay off state, city,county, and underlying governments’unfunded debt.- 50,120per taxpayer
Philadelphia’s Combined Taxpayer BurdenFAST FACTSGovernmentUnit Philadelphia has a Taxpayer Burden of - 27,900, which is each taxpayer’s share of the city’sdebt. Philadelphia taxpayers also pay taxes to the city’s underlying government units. If these debtsare included, each taxpayer’s burden is - 31,320. When state debt is combined with this debt, each taxpayer has a burden of - 50,120.Less BillsAssetsavailable topay bills*Unfundedpensionbenefits dueUnfundedOPEBOther bills **Moneyavailable(needed) to paybillsTaxpayerSurplus(Burden)GradePhiladelphia 5.1 billion 10.0 billion 2.6 billion 7.4 billion( 15.0 billion)( ority(SEPTA) 685.2 million 951.7 million 1.2 billion 797.7 million( 2.3 billion)( 4,220)CPhiladelphiaHousingAuthority 639.0 million 78.9 million 0 129.4 million 430.6 million 800BPennsylvania 38.0 billion 42.8 billion 29.8 billion 47.5 billion( 82.1 billion)(18,800)D( 50,120)* Does not include capital assets or restricted assets** Does not include debt related to capital assetsTruth in Accounting is committed to educating and empowering citizens with understandable, reliable, andtransparent government financial information. To be knowledgeable participants in their government and itsbudget process, citizens need truthful and transparent financial information.
LOS ANGELES TAXPAYERSON THE HOOK FOR - 56,390May 2019truthinaccounting.org- 6,000Taxpayer Burden City of Los Angeles- 15,500Los Angeles Unified School District- 11,350Los Angeles County- 1,080Los Angeles Community College District- 460LA County Metropolitan Transportation Authority (LACMTA/Metra) 0Metropolitan Water District of Southern California- 22,000CaliforniaAmount needed to pay off state, city,county, and underlying governments’unfunded debt.- 56,390per taxpayer
Los Angeles’ Combined Taxpayer BurdenFAST FACTS Los Angeles has a Taxpayer Burden of - 6,000, which is each taxpayer’s share of the city’s debt. Los Angeles taxpayers also pay taxes to the county and the city’s underlying government units.If these debts are included, each taxpayer’s burden is - 34,390. When state debt is combined with this debt, each taxpayer has a burden of - 56,390.Less BillsMoneyavailable(needed) to Assets availableto pay bills*Unfundedpensionbenefits dueLos Angeles 12.7 billion 8.4 billion 2.7 billion 9.2 billion( 7.7 billion)( 6,000)DLos AngelesUnified SchoolDistrict 5.1 billion 7.0 billion 15.0 billion 3.1 billion( 19.9 billion)( 15,500)DLos AngelesCounty 9.8 billion 10.8 billion 26.3 billion 9.8 billion( 37.1 billion)( 11,350)DLos AngelesCommunityCollege District 619.9 million 744.7 million 591.8 million 677.4 million( 1.4 billion)( 1,080)C 1.9 billion 572.6 million 1.3 billion 1.5 billion( 1.5 billion)( 460)C 1.5 billion 660.9 million 240.6 million 622.8 million( 29.3 million) 0C 100.1 billion 102.5 billion 107.0 billion 160.4 billion( 269.9 billion)( 22,000)FLA etra)MetropolitanWater Districtof SouthernCaliforniaCaliforniaUnfundedOPEBOther bills **( 56,390)* Does not include capital assets or restricted assets** Does not include debt related to capital assetsTruth in Accounting is committed to educating and empowering citizens with understandable, reliable, andtransparent government financial information. To be knowledgeable participants in their government and itsbudget process, citizens need truthful and transparent financial information.
NEW YORK TAXPAYERS ONTHE HOOK FOR - 85,600May 2019truthinaccounting.org- 64,100Taxpayer Burden New York City- 21,500New YorkAmount needed to pay off state, city,county, and underlying governments’unfunded debt.- 85,600per taxpayer
New York’s Combined Taxpayer BurdenFAST FACTS New York City has a Taxpayer Burden of - 64,100, which is each taxpayer’s share of the city’sdebt. Unlike other cities, New York City’s underlying government units are already included in thecity’s annual financial report. When state debt is added to city debt, each taxpayer has a burden of - 85,600.Less BillsOther bills **Moneyavailable(needed) topay billsTaxpayerSurplus(Burden)Grade 96.0 billion 87.7 billion( 185.5 billion)( 64,100)F 110.7 billion 151.8 billion( 143.0 billion)( 21,500)FGovernmentUnitAssetsavailable topay bills*Unfundedpensionbenefits dueUnfundedOPEBNew York City 58.5 billion 60.4 billionNew York 135.0 billion 15.5 billion( 85,600)* Does not include capital assets or restricted assets** Does not include debt related to capital assetsTruth in Accounting is committed to educating and empowering citizens with understandable, reliable, andtransparent government financial information. To be knowledgeable participants in their government and itsbudget process, citizens need truthful and transparent financial information.
CHICAGO TAXPAYERS ONTHE HOOK FOR - 119,110May 2019truthinaccounting.org- 36,000Taxpayer Burden City of Chicago- 17,690Chicago Public Schools- 9,890Cook County- 3,690Chicago Transit Authority- 1,190Chicago Park District- 110- 560Metro Water Reclamation Districtof Greater ChicagoChicago Community College District 820Chicago Housing Authority- 50,800IllinoisAmount needed to pay off state,city, county, and underlyinggovernments’ unfunded debt.- 119,110per taxpayer
Chicago’s Combined Taxpayer BurdenFAST FACTS Chicago has a Taxpayer Burden of - 36,000, which is each taxpayer’s share of the city’s debt. Chicago taxpayers also pay taxes to the county and the city’s underlying government units. Ifthese debts are included, each taxpayer’s burden is - 68,310. When state debt is combined with this debt, each taxpayer has a burden of - 119,110.Less BillsMoneyavailable(needed) topay billsTaxpayerSurplus(Burden)Grade 13.1 billion( 32.5 billion)( 36,000)F 2.2 billion 4.2 billion( 16.0 billion)( 17,690)D 14.4 billion 2.0 billion 2.9 billion( 17.2 billion)( 9,890)D 1.3 billion 1.7 billion( 151 million) 3.1 billion( 3.3 billion)( 3,690)CChicago ParkDistrict 510.7 million 1.2 billion 37.1 million 320.1 million( 1.1 billion)( 1,190)CMetro WaterReclamationDistrictof GreaterChicago 704.8 million 985.1 million 113.5 million 580.2 million( 974.1million)( 560)CChicagoCommunityCollege District 172.1 million 0 123.7 million 150.5 million( 102.0million)( 110)CChicagoHousingAuthority 925.9 million( 5.9 million) 0 188.7 million 743.1 million 820BIllinois 28.8 billion 134.4 billion 52.5 billion 58.0 billion( 216.1 billion)( 50,800)FGovernmentUnitAssetsavailable topay bills*Unfundedpensionbenefits dueUnfundedOPEBOther bills **Chicago 9.5 billion 28.0 billion 842.9 millionChicago PublicSchools 2.8 billion 12.4 billionCook County 2.1 billionChicago TransitAuthority* Does not include capital assets or restricted assets** Does not include debt related to capital assets( 119,110)Truth in Accounting is committed to educating and empowering citizens with understandable, reliable, andtransparent government financial information. To be knowledgeable participants in their government and itsbudget process, citizens need truthful and transparent financial information.
Truth in Accounting is committed to educating and empowering citizens with understandable, reliable, and transparent government financial information. To be knowledgeable participants in their government and its budget process, citizens need truthful and transparent financial informatio